Comments (9)
 junedchhipa
commented on April 30, 2024
3
junedchhipa
commented on April 30, 2024
3
@MichaelDanielTom
Removed the condition where smaller values were generating no ticks / single tick on y-axis.
Now, You can control the number of ticks that can be generated by this option
options.yaxis.tickAmount = 6
However, the way you have handled the float values by .toFixed(2) is required for now. I will check whether the series contains float numbers and based on that - decide whether to round off or not.
Thanks
from apexcharts.js.
junedchhipa
commented on April 30, 2024
3
Updated the "fraction/decimal" part to allow the user to give a default value.
Currently, the default is set to 2 - b37f249
The option can be set at options.yaxis.decimalsInFloat
Need to add in the docs
from apexcharts.js.
 ffxsam
commented on April 30, 2024
2
ffxsam
commented on April 30, 2024
2
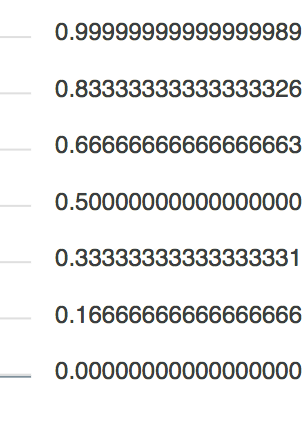
Seems like yaxis.decimalsInFloat doesn't work. I set it to 0, yet I still see decimals in my Y axis:

Instead, I have to set this in my yaxis options:
labels: {
  formatter: (value: number) => Math.floor(value),
},
from apexcharts.js.
junedchhipa
commented on April 30, 2024
1
Fixed the decimal places also.
Now you don't need to provide options.yaxis.labels.formatter = val => val.toFixed(2) for handling small values
from apexcharts.js.
 MichaelDanielTom
commented on April 30, 2024
MichaelDanielTom
commented on April 30, 2024
Thanks so much Juned!
from apexcharts.js.
MichaelDanielTom
commented on April 30, 2024
@junedchhipa Quick possible improvement could also be to default the representation for floats to truncate after a reasonable amount. Thoughts?
from apexcharts.js.
junedchhipa
commented on April 30, 2024
Not a bad idea to avoid long fraction parts.
And what should be the name of this option? options.yaxis.decimalsInFloat sounds good? :)
from apexcharts.js.
 paaaz
commented on April 30, 2024
paaaz
commented on April 30, 2024
Seems like
yaxis.decimalsInFloatdoesn't work. I set it to0, yet I still see decimals in my Y axis:Instead, I have to set this in my yaxis options:
labels: {
  formatter: (value: number) => Math.floor(value),
},
I can confirm that, it already worked with previous versions, now with v3.27.3 it does not seem to work
from apexcharts.js.
 malcolm7778
commented on April 30, 2024
malcolm7778
commented on April 30, 2024
try using react-chartjs-2
from apexcharts.js.
Related Issues (20)
- Treemap chart is not showing data properly in Angular. HOT 1
- Wish to have yaxis 0 tick always showing, but forceNiceScale does not seem to work properly with min/max values -1 < value < 1 HOT 4
- Certain stacked bar doesn't stack but overlaid on another series HOT 1
- Add SSR Support
- Grid lines overlaps floating legend HOT 1
- seriesIndex and dataPointIndex set to -1 if tooltips disabled HOT 2
- Grid lines overlapping legends
- Upgrade to 3.46.0 leads to not taking into account tickAmount in xaxis HOT 1
- Deselecting all series in a rangeArea graph results in an error
- Event for toolbar zoomin and zoomout
- X-Axis type says that the library doesn't support functions for dynamically calculating min and max HOT 1
- Apply border radius for stacked bar chart only for last and first items
- Make the Annotation to the background of the series
- Show markers for each line on Hover in combined charts of rangeArea type
- Indicate position of the tooltip relative to cursor
- DataLabels misplaced when zooming and toolbar not showing when show=true
- Accessibility: Request to replace height and width html attributes with CSS on rect and foreignObject elements HOT 1
- Stepline chart - choose preferred line interpolation
- The border of the x-axis is misaligned in the Reversed Horizontal Bar Chart. HOT 1
- HeatMap Chart Not Support rgba / 8HEX To RGBA error
Recommend Projects
-
 React
React
A declarative, efficient, and flexible JavaScript library for building user interfaces.
-
Vue.js
🖖 Vue.js is a progressive, incrementally-adoptable JavaScript framework for building UI on the web.
-
 Typescript
TypeScript is a superset of JavaScript that compiles to clean JavaScript output.
-
TensorFlow
An Open Source Machine Learning Framework for Everyone
-
Django
The Web framework for perfectionists with deadlines.
-
 Laravel
A PHP framework for web artisans
-
D3
Bring data to life with SVG, Canvas and HTML. 📊📈🎉
-
Recommend Topics
-
javascript
JavaScript (JS) is a lightweight interpreted programming language with first-class functions.
-
web
Some thing interesting about web. New door for the world.
-
server
A server is a program made to process requests and deliver data to clients.
-
Machine learning
Machine learning is a way of modeling and interpreting data that allows a piece of software to respond intelligently.
-
Visualization
Some thing interesting about visualization, use data art
-
Game
Some thing interesting about game, make everyone happy.
Recommend Org
-
Facebook
We are working to build community through open source technology. NB: members must have two-factor auth.
-
Microsoft
Open source projects and samples from Microsoft.
-
Google
Google ❤️ Open Source for everyone.
-
Alibaba
Alibaba Open Source for everyone
-
D3
Data-Driven Documents codes.
-
Tencent
China tencent open source team.
from apexcharts.js.