Giter Site home page Giter Site logo

cybertec-postgresql / pgwatch2 Goto Github PK

View Code? Open in Web Editor NEW
1.8K 55.0 232.0 11.15 MB

PostgreSQL metrics monitor/dashboard

License: BSD 3-Clause "New" or "Revised" License

Shell 5.70% Go 22.60% PLpgSQL 56.59% Python 9.85% HTML 4.87% Dockerfile 0.39% CSS 0.01%
postgresql postgres monitoring grafana metrics postgresql-metrics-monitor metrics-gathering-daemon dashboard docker-setup metrics-gatherer

pgwatch2's Introduction

Documentation Status Release Github All Releases Docker Pulls

Important

🚨pgwatch2 is now in maintenance mode, accepting only bug fixes. Check out the WIP pgwatch3 repository for new features and enhancements!

pgwatch2

Flexible self-contained PostgreSQL metrics monitoring/dashboarding solution. Supports monitoring PG versions 9.0 to 16 out of the box.

Demo

https://demo.pgwatch.com/

Documentation

https://pgwatch2.readthedocs.io/en/latest/

Quick Start

For the fastest setup experience Docker images are provided via Docker Hub (for a Docker quickstart see here). For custom setups see the according chapter from documentation or turn to the "Releases" tab for pre-built DEB / RPM / Tar packages directly.

# fetch and run the latest Docker image, exposing Grafana on port 3000, the administrative web UI on port 8080
# and the internal configuration and metrics DB on localhost port 5432
docker run -d --restart=unless-stopped --name pw2 \
  -p 3000:3000 -p 8080:8080 -p 127.0.0.1:5432:5432 \
  -e PW2_TESTDB=true \
  cybertec/pgwatch2-postgres:latest

After some minutes you could open the "db-overview" dashboard and start looking at metrics. For defining your own dashboards you need to log in as admin (admin/pgwatch2admin).

NB! If you don't want to add the "test" database (the pgwatch2 configuration db) for monitoring, remove the NOTESTDB=1 env parameter when launching the container.

The behaviour of the Docker images can be customized in many ways - for a complete list of all supported Docker environment variables see ENV_VARIABLES.md.

Main features

  • Non-invasive setup, no extensions nor superuser rights required for the base functionality
  • Intuitive metrics presentation using the Grafana dashboarding engine with optional Alerting
  • Lots of pre-configured dashboards and metric configurations covering all Statistics Collector data
  • Easy extensibility by defining metrics in pure SQL (thus they could also be from business domain)
  • 4 supported data stores for metrics storage (PostgreSQL with or without TimescaleDB, InfluxDB, Graphite, Prometheus)
  • Multiple configuration options (YAML, PostgreSQL, ENV) supporting both "push" and "pull" models
  • Possible to monitoring all or a subset of DBs of a PostgreSQL cluster
  • Global or DB level configuration of metrics/intervals
  • Kubernetes/OpenShift ready with sample templates and a Helm chart
  • PgBouncer, Pgpool-II, AWS RDS and Patroni support
  • Internal health-check API to monitor metrics gathering status
  • Security options like SSL / HTTPS for all connections and password encryption for connect strings
  • Very low resource requirements for the collector - 1 CPU core can handle ~3k monitored DBs at 1GB RAM usage
  • Log parsing capabilities when deployed locally in "push" mode

Component diagram for the default Docker setup

pgwatch2 can be deployed in various configurations, as all components are "loosely coupled". This means that you can very well reuse your existing PostgreSQL or Grafana installations, adding only pgwatch2 specific components - see here for more information.

Two most common deployment options are:

The Configuration DB centric "pull" model

Component diagram

The de-centralized "push" model

Component diagram

Metrics storage options

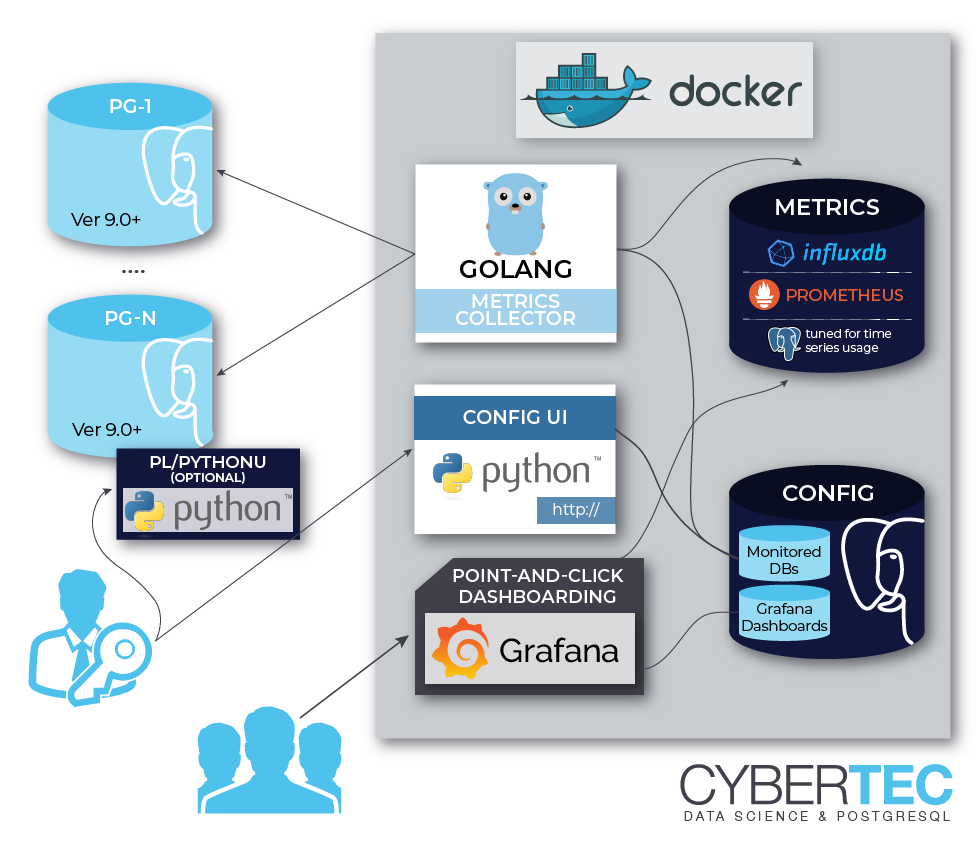
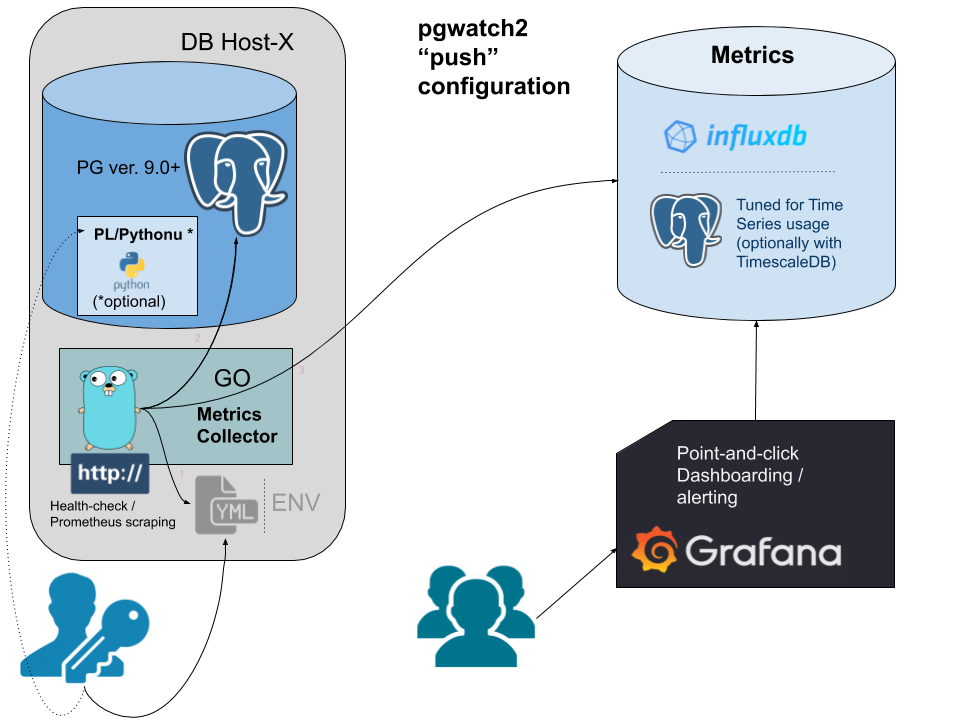
For storing metrics collected by the pgwatch2 daemon there are quite some options available:

  • PostgreSQL - v11+ recommended. Multiple storage partitioning layouts available depending on the amount of servers to be monitored.
  • PostgreSQL with the TimescaleDB extension - offers good compression and generally recommended when monitoring 100+ databases.
  • InfluxDB - Time-Series optimized database. Note that the newly released v2.0 is not yet supported. Good Grafana integration but quite limited query language.
  • Prometheus - here the pgwatch2 daemon would not store anything directly but just expose an endpoint for remote scraping / storage via Prometheus.
  • Graphite - legacy support for Graphite. Not recommended anymore for new installations as it does not support the "tag" system.

See the documentation for more details.

Steps to configure your database for monitoring

As a base requirement you'll need a login user (non-superuser suggested) for connecting to your PostgreSQL servers and fetching metrics queries. Using a user named "pgwatch2" is recommended though, as otherwise your might need to adjust some scripts for advanced monitoring options, in case an unpriveleged monitoring account is used. More documentation on that can be found here.

CREATE ROLE pgwatch2 WITH LOGIN PASSWORD 'secret';
-- NB! For very important databases it might make sense to ensure that the user
-- account used for monitoring can only open a limited number of connections (there are according checks in code also though)
ALTER ROLE pgwatch2 CONNECTION LIMIT 3;
GRANT pg_monitor TO pgwatch2;   -- system role available for v10+ servers to reduce superuser usage
GRANT CONNECT ON DATABASE mydb TO pgwatch2;
GRANT USAGE ON SCHEMA public TO pgwatch2; -- NB! pgwatch doesn't necessarily require using the public schema though!

Additionally, for extra insights on "to be monitored" databases, it's recommended to install and activate the pg_stat_statement contrib extension and enable the track_io_timing parameter in server configuration.

Helper functions to retrieve protected statistics

If for security reasons a plain unprivileged database account is used for metrics gathering, this would mean that some protected PostgreSQL internal statistics cannot be fetched. This might be just OK (there's also an "unprivileged" preset), but it's also possible to expose such protected information in a safe and controlled way via a set of predefined SECURITY DEFINER functions. Note that another way to expose most of the protected metrics for Postgres v10+ instances would be to grant the special "pg_monitor" system role to the monitoring user like in the above paragraph.

To be executed on the "to be monitored" database:

psql -h mydb.com -U superuser -f /etc/pgwatch2/metrics/00_helpers/get_stat_activity/$pgver/metric.sql mydb
psql -h mydb.com -U superuser -f /etc/pgwatch2/metrics/00_helpers/get_stat_statements/$pgver/metric.sql mydb
psql -h mydb.com -U superuser -f /etc/pgwatch2/metrics/00_helpers/get_stat_replication/$pgver/metric.sql mydb

NB! By default the "helpers" assume that a role called "pgwatch2" will be used for metrics gathering. If not so, you need to change the SQL definitions. Also note that some helper scripts can refuse to install if the security of the target schema is too "open" for everyone (i.e. to the built-in "public" meta-role) and thus there's potential for misuse.

Integration of OS level metrics

Similar to above described plain SQL helper functions, one can also create such wrapper functions in any PostgreSQL supported PL-language, like most commonly PL/Python. This will allow to return metrics on any information deemed useful. Main use case though is to extract OS statistics like CPU, RAM, disk utilization and backup status over regular Postgres connections. The pgwatch2 project provides a good set of such wrappers, so that in simpler cases you would not need any additional system monitoring tools.

# first install the Python bindings for Postgres
apt install postgresql-plpython3-XY
# yum install postgresqlXY-plpython3

psql -c "CREATE EXTENSION plpython3u" mydb
psql -f /etc/pgwatch2/metrics/00_helpers/get_load_average/9.1/metric.sql mydb

# psutil helpers are only needed when full set of common OS metrics is wanted
apt install python3-psutil
psql -f /etc/pgwatch2/metrics/00_helpers/get_psutil_cpu/9.1/metric.sql mydb
psql -f /etc/pgwatch2/metrics/00_helpers/get_psutil_mem/9.1/metric.sql mydb
psql -f /etc/pgwatch2/metrics/00_helpers/get_psutil_disk/9.1/metric.sql mydb
psql -f /etc/pgwatch2/metrics/00_helpers/get_psutil_disk_io_total/9.1/metric.sql mydb

Metric definitions

Metrics in pgwatch2 are named SQL queries that can return pretty much everything you find useful. Metrics can have different query text versions for different target PostgreSQL versions, also optionally taking into account recovery state (primary / standby) and as of v1.8 also versions of installed extensions. Query output is automatically stored into the metric DB and optionally also indexed if a column's name is prefixed with the "tag_" modifier.

A sample custom metric looks like that:

  -- a sample metric
  SELECT
    (extract(epoch from now()) * 1e9)::int8 as epoch_ns,
    extract(epoch from (now() - pg_postmaster_start_time()))::int8 as postmaster_uptime_s,
    case when pg_is_in_recovery() then 1 else 0 end as in_recovery_int;

File based operation

From v1.4.0 one can also deploy pgwatch2 gatherer daemons de-centrally without a configuration database, based on YAML config files. This means a more resilient setup (the only point of failure will be the metrics storage DB) and more security, so that even superuser roles can be used on the agents running locally on monitored database. See here for details.

Ad-hoc operation

From v1.4.0 it's also possible to run the gatherer daemon in ad-hoc / test mode, by giving a single standard connection string as input, and optionally also specifying the metrics to monitor (a Preset Config name or a custom JSON string). In that case there is no need for the central Postgres "Config DB", nor any YAML files, i.e. the setup can be based purely on environment variables, which can be beneficial for Cloud setups. Details here.

# launching in ad-hoc / test mode
docker run --rm -d --name pw2_temp \
    -p 3000:3000 \
    -e PW2_ADHOC_CONN_STR="postgresql://postgres:[email protected]:5432/postgres" \
    -e PW2_ADHOC_CONFIG=unprivileged cybertec/pgwatch2-postgres

Prometheus mode

In v1.6.0 support for one of the most popular metrics gathering solutions – Prometheus, was added. When the "datastore" parameter is set to "prometheus" then the pgwatch2 metrics collector doesn't do any normal interval-based fetching but listens on port 9187 (changeable) for scrape requests configured and performed on Prometheus side.

In this mode the pgwatch2 agents should be running on all database hosts separately, not centrally. While technically possible though, it would counter the core idea of Prometheus and would make scrapes also longer, risking timeouts. There's also a separate "Preset Config" named "prometheus". More details.

Kubernetes / OpenShift / Helm

Cloud deployments of pgwatch2 should be no problem - there are some simple deployment templates provided and also some Helm charts in the "pgwatch2-charts" repository.

Helm setup values should always be reviewed / edited as the defaults are rather for testing purposes. Installation is done by the following command:

cd openshift_k8s
helm install -f chart-values-k8s-pg-storage.yml pgwatch2 helm-chart-k8s-pg-storage

Please have a look at the according (K8s or OpenShift) values.yaml files to get additional information of configurable options.

Contributing

Feedback, suggestions, problem reports and pull requests are very much appreciated.

pgwatch2's People

Contributors

andrewjackson2020 avatar bukem avatar cah-tyler-rasor avatar carobme avatar cleitondomazak avatar dankasak avatar dependabot[bot] avatar dtmdl avatar eshkinkot avatar fireemerald avatar henriavelabarbe avatar ilyatsoi avatar jcarnu avatar jimgolfgti avatar jinnerbichler avatar kmoppel avatar kmoppel-cognite avatar kostiantyn-nemchenko avatar krisavi avatar marcelorauldiaz avatar markwort avatar michalbartos avatar palmalcheg avatar pashagolub avatar pmpetit avatar rockaut avatar sascha8a avatar slardiere avatar vladimirfx avatar yanchenko-igor avatar

Stargazers

 avatar  avatar  avatar  avatar  avatar  avatar  avatar  avatar  avatar  avatar  avatar  avatar  avatar  avatar  avatar  avatar  avatar  avatar  avatar  avatar  avatar  avatar  avatar  avatar  avatar  avatar  avatar  avatar  avatar  avatar  avatar  avatar  avatar  avatar  avatar  avatar  avatar  avatar  avatar  avatar  avatar  avatar  avatar  avatar  avatar  avatar  avatar  avatar  avatar  avatar  avatar  avatar  avatar  avatar  avatar  avatar  avatar  avatar  avatar  avatar  avatar  avatar  avatar  avatar  avatar  avatar  avatar  avatar  avatar  avatar  avatar  avatar  avatar  avatar  avatar  avatar  avatar  avatar  avatar  avatar  avatar  avatar  avatar  avatar  avatar  avatar  avatar  avatar  avatar  avatar  avatar  avatar  avatar  avatar  avatar  avatar  avatar  avatar  avatar  avatar

Watchers

 avatar  avatar  avatar  avatar  avatar  avatar  avatar  avatar  avatar  avatar  avatar  avatar  avatar  avatar  avatar  avatar  avatar  avatar  avatar  avatar  avatar  avatar  avatar  avatar  avatar  avatar  avatar  avatar  avatar  avatar  avatar  avatar  avatar  avatar  avatar  avatar  avatar  avatar  avatar  avatar  avatar  avatar  avatar  avatar  avatar  avatar  avatar  avatar  avatar  avatar  avatar  avatar  avatar  avatar  avatar

pgwatch2's Issues

cybertec logo not shown on grafana_default_dashboard

Hello Karel,

since some weeks the grafana_default_dashboard doesn't show the cybertec logo anymore as the domain has changed.
The code still points to the old cybertec domain
content": "Brought to you by: <a href=\"http://cybertec.at/en\"><img src=\"http://static.cybertec.at/wp-content/themes/cybertec-optimus/assets/img/logo.png\"

kind regards
Georg

Idea - JSON endpoints for high level metrics

This could be used to easily integrate with other external tools or custom scripts without having to write any InfluxQL

  • Latest notifications
  • DBs with potential problems (increased query runtime / IO / CPU )
  • ...

can't select DB's in http://localhost:3000

First of all Thank you for this monitoring system. I've already tested it on "docker run -d -p 3000:3000 -p 8080:8080 --name pw2 cybertec/pgwatch2"

But I try to do it localy from Dockerfile. (by the way there is an error "Step 43 : COPY build_git_version.txt /pgwatch2/build_git_version.txt
lstat build_git_version.txt: no such file or directory
" I've skipped it)
I have done everything and now can connect to the server, can add DBs but in Grafana http://localhost:3000 I can't select even test DB it's empty

When I select db in http://localhost:8080 and then press show I have this maybe errors
`500 Internal Server Error

The server encountered an unexpected condition which prevented it from fulfilling the request.

Traceback (most recent call last):
File "/usr/local/lib/python3.5/dist-packages/cherrypy/_cprequest.py", line 670, in respond
response.body = self.handler()
File "/usr/local/lib/python3.5/dist-packages/cherrypy/lib/encoding.py", line 220, in call
self.body = self.oldhandler(*args, **kwargs)
File "/usr/local/lib/python3.5/dist-packages/cherrypy/_cpdispatch.py", line 60, in call
return self.callable(*self.args, **self.kwargs)
File "/pgwatch2/webpy/web.py", line 173, in index
data = pgwatch2_influx.get_db_overview(dbname)
File "/pgwatch2/webpy/pgwatch2_influx.py", line 86, in get_db_overview
data['TPS'] = exec_for_time_pairs(tps, dbname, time_pairs)
File "/pgwatch2/webpy/pgwatch2_influx.py", line 65, in exec_for_time_pairs
res = influx_query(isql.format(dbname, where_time, group_by_time))
File "/pgwatch2/webpy/pgwatch2_influx.py", line 33, in influx_query
return client.query(influxql, params=params)
File "/usr/local/lib/python3.5/dist-packages/influxdb/client.py", line 347, in query
in data.get('results', [])
File "/usr/local/lib/python3.5/dist-packages/influxdb/client.py", line 346, in
for result
File "/usr/local/lib/python3.5/dist-packages/influxdb/resultset.py", line 23, in init
raise InfluxDBClientError(self.error)
influxdb.exceptions.InfluxDBClientError: database not found: pgwatch2`

Could you please help me in my problem.

Thank you for your reply

Create dashboards in different organization

Hi,

Thanks for sharing this tool.

We would like to centralize the metrics of several databases on the same server.
We have to create different organizations to limit what users can see.

Is there an easy wait to create the dashboard in a different organisation from the pgwatch2 interface ?

Benoit.

PS: I noticed a small typo in README.md
"(e.g. docker exec -it ps2 /bin/bash)" => should be pw2 instead of ps2.
I can create a PR if you want.

pgwatch2 stopped working with "panic: runtime error: index out of range"

Hello Kaarel,
I noticed today morning that pgwatch2 died yesterday with:

2017/11/02 13:28:49 13:28:49.879 WARN DetectSprocChanges: detected delete of sproc: public.soundex , oid: 16425
2017/11/02 13:28:49 13:28:49.950 WARN DetectIndexChanges: detected drop of index: public.ffh1e_menu_types_pkey
panic: runtime error: index out of range

goroutine 288 [running]:
main.DetectIndexChanges(0xc4201195a0, 0xf, 0x4023333333333333, 0xc420010840, 0xc420539e48, 0x0, 0x0, 0x0)
/pgwatch2/pgwatch2.go:707 +0x19d2
main.CheckForPGObjectChangesAndStore(0xc4201195a0, 0xf, 0x4023333333333333, 0xc420010840, 0xc420539e48)
/pgwatch2/pgwatch2.go:774 +0x152
main.MetricsFetcher(0xc420319c80, 0xc420010840)
/pgwatch2/pgwatch2.go:820 +0xa58
created by main.main
/pgwatch2/pgwatch2.go:1169 +0x1d27

used versions:
{"influxdb": "InfluxDB v1.3.5 (git: HEAD 9d9001036d3585cf21925c13a57881bc6c8dcc7e)", "postgres": "PostgreSQL 9.5.8 on x86_64-pc-linux-gnu, compiled by gcc (Ubuntu 5.4.0-6ubuntu1~16.04.4) 5.4.0 20160609, 64-bit", "grafana": "Version 4.5.1 (commit: c114c46)", "pgwatch2_git_version": "b4ad2fd324b1ff8aef315c0998c427240898dcc3"}

I've restarted the docker container and now it's working again but misses all the data in between.

grafana dashboards: 2 independent charts (QPS + Sessions) are wired together

Hello Karel,
I've noticed that when I click "Show" or "Edit" in the panel headers of "QPS" or "Sessions" (both dashboard "DB Overview) I get always both charts shown while all other charts are single opened. Also "sessions" doesn't show its query and other settings. (see attached screenshot)
So it seems that their definition (JSON ? ) is somehow mixed.
grafana_editsessionschart

kind regards
Georg

Metrics improvements

Some notes I gathered when setting this up.

In table details:

  • For table size it would be good to have toast table size too.
  • Scans and probably others use mean() to calculate number of scans. If there are multiple tables with same name in different schemas this is wrong. sum() would be better.
  • 1h rate in 1min timeslices leads to confusing numbers. If there is an occasional sequential scan it shows up as a spike of 60 scans per hour. I guess just using 1m rate would be more intuitive.

Stat statements overview

  • Legend is mostly useless and should be disabled.

Bad datatype in m_pg_version_from

In the table metric, the field m_pg_version_from use float datatype, which is wrong, because it could approximate 9.6 to 9.59999999
Please use numeric for this

Expose or document data data storage locations

It would be very helpful if the locations for the various configs and data stores (postgres, Influx, Grafana) were exposed in docker (or at least their paths documented) so we can save setups between container reloads.

Feature idea - integrated log parsing

Integration with database logs is missing currently, so a good log parser running on DB host would benefit error diagnosis greatly - showing most frequent error messages/patterns etc.

Some approaches (a Docker ):

  1. A binary that could parse and send all messages to main metrics DB (Influx)
  2. A docker image that could parse, store and expose a Influx datasource itself so that dashboards could pull data from it

docker database user/password incorrect

default user/pw postgres/pgwatch2admin can't login the database!

and I install the plpythonu extension, why dashboard don't display the query runtime!

thanks!

"WAL ratio" doesn't make any sense

The item "WAL Ratio" doesn't make any sense. I had to check the code, and it is actually getting the derivative, which would be the "WAL Rate", which makes a lot more sense.

No preset configurations in management web ui

I failed to understand how to enable same dashboard metrics, as in example.

By default, I have not presets at localhost:15433/dbs and I have no idea of what to write in custom config.

So, localhost:15434/dashboard/db/db-overview?orgId=1 yields N/A.

From what I understood, when new entry is added in management ui, it will be possible to select this entry in dashboard.

Please, provide me with custom config example, or teach where to get presets.

docker-compose.yml

    pw2:
        container_name: pw2
        image: cybertec/pgwatch2
        ports:
            - 15433:8080 #Management
            - 15434:3000 #Dashboard
        environment:
            NOTESTDB: 1
            PW2_PGHOST: psql-master
            PW2_PGPORT: 5432
            PW2_PGDATABASE: dev
            PW2_PGUSER: pgwatch2
            PW2_PGPASSWORD: 12345

    psql-master:
        container_name: psql-master
        hostname: psql-master
        image: postgres:9.3-alpine
        ports:
            - 5433:5432
        volumes:
            ...
        environment:
            PGDATA: /var/lib/postgresql/data
            POSTGRES_DB: dev
            POSTGRES_USER: postgres
            POSTGRES_PASSWORD: 12345

Integrating pgwatch2 with existing InfluxDB/Grafana

Hi - pgwatch2 is exactly what we're looking for to monitor our AWS RDS postgres instance. If we wanted to use the built-in pgwatch2, postgres config, and Web UI, but ship metrics to an existing InfluxDB/Grafana installation that we have, what would be the easiest way? Thanks!

Missing functions get_load_average() and get_stat_statements()

Hello,

The Docker container runs fine and we can get to the admin interface and get some metrics in Graphana. Thanks for the awesome job :)

We run into two errors in the logs you'll see below.
Pgwatcher2 doesn't find 2 functions get_load_average and get_stat_statements.

The share_preloaded_library for pg_stat_statement as well as the Extension are properly loaded and work as expected, but no luck with the aforementioned function.
I can't find any references to the get_load_average function anywhere on the Internet.

Our Postgres is a 9.4.

Do you know what the missing extensions are?

Thanks!
Nicolas

2017/02/02 13:46:19 13:46:19.401 ERRO DBExecRead: pq: function public.get_load_average() does not exist
2017/02/02 13:46:19 13:46:19.401 ERRO MetricsFetcher: failed to fetch metrics for  sql-data cpu_load pq: function public.get_load_average() does not exist
2017/02/02 13:46:19 13:46:19.416 ERRO DBExecRead: pq: function public.get_stat_statements() does not exist
2017/02/02 13:46:19 13:46:19.416 ERRO MetricsFetcher: failed to fetch metrics for  sql-data stat_statements pq: function public.get_stat_statements() does not exist

latest pgwatch2 gives http error 404 (not found) for localhost:8086 - InfluxDB API

Hello Kaarel,
after getting latest pgwatch2 I found that InfluxDB API is giving http error 404 (not found) when opening http://localhost:8086 (this worked in my previous version)
The port is included in my docker run xxx command:
-p 127.0.0.1:8083:8083 -p 127.0.0.1:8086:8086 -p 127.0.0.1:8088:8088
but doesn't work anymore. Nevertheless netstat -ln shows this port as listening on the host

]$ netstat -ln
Active Internet connections (only servers)
Proto Recv-Q Send-Q Local Address Foreign Address State
tcp 0 0 0.0.0.0:111 0.0.0.0:* LISTEN
tcp 0 0 x.x.x.x:8080 0.0.0.0:* LISTEN
tcp 0 0 127.0.0.1:8083 0.0.0.0:* LISTEN
tcp 0 0 127.0.0.1:8086 0.0.0.0:* LISTEN
tcp 0 0 10.192.64.101:3000 0.0.0.0:* LISTEN
tcp 0 0 127.0.0.1:5432 0.0.0.0:* LISTEN
tcp 0 0 127.0.0.1:8088 0.0.0.0:* LISTEN

Fetching PG version not working on EDB Postgres Advanced Server

2017/03/15 14:31:14 14:31:14.746 ERRO DBGetPGVersion: DBGetPGVersion failed pq: invalid input syntax for type double precision: "9.5.4"
2017/03/15 14:31:14 14:31:14.746 ERRO MetricsFetcher: failed to fetch pg version for IISTESTDB kpi pq: invalid input syntax for type double precision: "9.5.4"

missing in documentation

Hello @kmoppel ,
I'm missing some details within the documentation that took me some time to figure out and many dropped and recreated containers.
As I tried to restore the backup I wasn't able to access the mounted folder from inside docker because of "access denied" for root caused by SElinux(on the host, CentOS 7).
To solve this I had to mount the folder with :rw,z and the complete command looks now like this:

docker run -d --net=bridge -p 10.xxx.xxx.101:3000:3000 -p 10.xxx.xxx.101:8080:8080 -p 127.0.0.1:5432:5432 -p 127.0.0.1:8083:8083 -p 127.0.0.1:8086:8086 -p 127.0.0.1:8088:8088 --restart unless-stopped -v /home/pgwatch2/pgwbackup:/pgwbackup:rw,z --name pw2 -e PW2_WEBNOANONYMOUS=1 -e PW2_WEBUSER=OurWebADM -e PW2_WEBPASSWORD=OurWebPW -e PW2_WEBSSL=1 -e PW2_GRAFANASSL=1 cybertec/pgwatch2

I'm using a configured docker bridge to have a static Bridge IP and also DNS:

/etc/docker/daemon.json :

{
"bip": "172.17.0.1/16",
"mtu": 1392,
"dns": ["172.17.0.1","10.xxx.xxx.101","8.8.8.8"]
}

source: https://docs.docker.com/engine/userguide/networking/default_network/custom-docker0/

Maybe you could add above information to your documentation to speed up others while getting familiar with pgwatch2 :)

Invalid syntax of sql queries for buffercache-related metrics

Hi,

The following SQL statements in pgwatch2/sql/datastore_setup/metric_definitions.sql have invalid syntax possibly due to copy/paste mistakes.

select
  (extract(epoch from now()) * 1e9)::int8 as epoch_ns,
  SELECT datname,
  count(*) * 8192
FROM
  pg_buffercache AS b,
  pg_database AS d
WHERE
  d.oid = b.reldatabase
GROUP BY
  1;
select
  (extract(epoch from now()) * 1e9)::int8 as epoch_ns,
    SELECT       CASE WHEN relkind = 'r' THEN 'Table'   -- TODO all relkinds covered?
                 WHEN relkind = 'i' THEN 'Index'
                 WHEN relkind = 't' THEN 'Toast'
                 WHEN relkind = 'm' THEN 'Materialized view'
                 ELSE 'Other' END,
            count(*) * 8192
    FROM    pg_buffercache AS b, pg_class AS d
    WHERE   d.oid = b.relfilenode
    GROUP BY 1;

Grafana alerting with permanent "no data" state

Hello @kmoppel ,
I'm having problems with Grafanas alerting function. I do have current data within the dashboards and I'm also able to download time series but the alerting tells me always and on any places I've tried that state is "no data" causing no alerts to be fired.
Checking the data source gives also a "valid" back.
So it seems that just alerting doesn't get anything for some reason. If you don't have any hints for me I'll ask within the Grafana community.

kind regards
Georg

massive errors "SendToInflux: NewPoint failed: max key length exceeded" after pulling fresh pgwatch2

Hello Kaarel,
since you proposed to update pgwatch2 at all to get your fixes for my older issues and new grafana I did this today but encountered some errors afterwards.

When checking pgwatch2.log via web console :8080/logs/pgwatch2/200 I see now a lot of these errors below:

2017/10/12 12:52:07 12:52:07.414 ERRO SendToInflux: NewPoint failed: max key length exceeded: 71714 > 65535
2017/10/12 12:52:07 12:52:07.415 ERRO SendToInflux: NewPoint failed: max key length exceeded: 71843 > 65535
2017/10/12 12:52:07 12:52:07.416 ERRO SendToInflux: NewPoint failed: max key length exceeded: 71300 > 65535
2017/10/12 12:52:07 12:52:07.417 ERRO SendToInflux: NewPoint failed: max key length exceeded: 71724 > 65535
2017/10/12 12:52:07 12:52:07.419 ERRO SendToInflux: NewPoint failed: max key length exceeded: 71744 > 65535
2017/10/12 12:52:07 12:52:07.421 ERRO SendToInflux: NewPoint failed: max key length exceeded: 71839 > 65535
2017/10/12 12:52:07 12:52:07.421 ERRO SendToInflux: NewPoint failed: max key length exceeded: 71719 > 65535

I've tried to figure out from where they are coming but ad no success.
To make sure that my restored influx backup hasn't caused these errors I started from scratch and restored only the config of pgwatch2, pgwatch2_grafana and the influxdb metastore. Before I've dropped all docker images ( "docker rmi $(docker images -q)" ) and pulled it again.
But it didn't help.

feature request: switch to prevent creation of "test" data

Hello @kmoppel ,
it would be nice to have a switch when pulling the docker image to prevent creation of the "test" data.
Even if I delete the configuration for it (as renaming isn't possible) grafana shows this as default choice every time one accesses the dashboards. And it's really hard to delete these data out of the influx db...

kind regards
Georg

Limitations, alerts and connections

Hi,

First of all thanks for pgwatch2. We've started working with it 2 months ago and after testing period we decided it's good to go on production servers as well.
We have some questions/issues which I'm not sure if it has to do with pgwatch2 or with Influx/Grafana, but here it goes:

  1. Is there some sort of limitation for how many DB's to monitor?
  • we will have something like 14 servers, each with 5-7 databases. For now we set 4 servers with a total of 12 databases. This means for us 38 entries in DB's to monitor for now with multiple Metrics configs (each database type has a different metric config). LE. Between 1 and 15 metrics for each db.
  1. Alerts
  • for now we have 73 alerts that are on but unfortunately a lot of the following error pops-up randomly: Error: Could not find datasource Data source not found and of course alerts start to make noise (for me it seems it's losing connections to the InlfuxDB inside the docker).
  • working now with 55 alerts on and 18 paused seem to be ok (we also paused DB's to watch); don't know why, maybe you have an idea?
  1. Postgres
  • on the postgres log inside the docker we can see a lot of the following:
    pgwatch2@pgwatch2_grafana FATAL: remaining connection slots are reserved for non-replication superuser connections
  • unfortunately did not find anything useful while googling it
  • while having all the DB's to watch on (38 entries) the log is quite full of these errors; making 7 of them inactive, thus eliminating a server completely from monitor seems to almost clear the error, at least it shows very rare.
  • we increased the max_connections = 200 and decreased superuser_reserved_connections = 2 (this was the only thing i could find online) but it's not helping apparently; increasing superuser to 10 for example just floods the log with the same message every second.
    Any ideas?
  1. Retention policy
  • can we change the retention policy to 30 days for example? As far as i can tell it's 90 now right?

Hardware:
Pgwatch2 runs on a dedicated VM with 4 gigs of RAM and 2 cores.

To me it seems that these are some minor changes we might need to do but can't seem to figure it out. Otherwise it runs great, metrics, alerts and so on.

If there are any details we need to provide, please, let us know.
Thanks again.

A little advice about pgwatch2

hello @kmoppel
about pgwath2, I have a little advice. pgwatch2 default provide some graph, could provide some default threshold value about the metric alert.
I not the pg dba, but as a sys admin, that will helps a lot, just the advice. I hope the application become better and better.
thanks for the develop team.

add db to monitor

Hello,
While adding a new db to monitor, if you leave "db name" empty, for it to add all the db, then it will use the connection parameters from the line 1

capture du 2017-11-06 14-23-22

for example, adding a new db in this context without setting db_name : all newly added database will come from the line 1 instead of bditz1pgs03

documentation doesn't note stat_activity_wrapper.sql

Hello Karel,

as I was wondering why the "sessions" chart (DB overview dashboard) doesn't show any values for my configured DBs while both pgwatch2 DBs show graphs.
While sneaking through the /pgwatch2/sql/metric_fetching_helpers folder I noticed that there is a new script stat_activity_wrapper.sql which solves this problem but isn't mentioned in the documentation on the <>Code page.

kind regards
Georg

Support AWS RDS PostgreSQL database monitoring. provide alternative of 'cpu_load_plpythonu.sql'

Support AWS RDS PostgreSQL database monitoring,

AWS RDS PostgreSQL database does not support plpython programming.

Need alternative of 'cpu_load_plpythonu.sql' in RDS Postgresql supported language to deploy pgWatch2 to monitor RDS Postgresql databases.

RDS PostgreSQL support following language extension: Perl, pgSQL, Tcl, and JavaScript (via the V8 JavaScript engine) Ref. https://aws.amazon.com/rds/postgresql/

pgWatch2 is amazing tool and looking forward to deploy it on AWS RDS postgresql database monitring.

Thanks,
Ravi

Influx max key length exceeded

After 30 minutes of work, all the statistics is no longer updated and the next message appears in the logs:

CRIT SendToInflux: NewPoint failed: max key length exceeded: 70284 > 65535

pg_stat_statements_reset - helped, but after 5 min stable work error appears again.

PS here some debug info:

DEBU SendToInflux: SendToInflux data[0] of  14 : 
map[shared_blks_written:0 epoch_ns:1485952965864720128 tag_queryid:1691203631 calls:7 total_time:7.696999999999999 shared_blks_hit:1862 blk_write_time:0 
tag_query:SELECT (extract(? from now()) * ?)::int8 as epoch_ns, schemaname::text as tag_schema, indexrelname::text as tag_index_name, relname::text as tag_table_name, coalesce(idx_scan, ?) as idx_scan, coalesce(idx_tup_read, ?) as idx_tup_read, coalesce(idx_tup_fetch, ?) as idx_tup_fetch, coalesce(pg_relation_size(indexrelid), ?) as index_size_b 
FROM pg_stat_user_indexes WHERE pg_relation_size(indexrelid) > ? -- >1MB AND NOT schemaname like ? 
ORDER BY schemaname, relname, indexrelname;  
shared_blks_read:0 temp_blks_read:0 temp_blks_written:0 blk_read_time:0]

graphite for storing metrics

pgwatch2 looks really useful, and I am keen on using it. We're already gathering metrics into Graphite within my company and I'd like to ask if you think one can easily swap influxDB by Graphite in your setup.

I am not asking you to implement it :), I'm just asking if you think that would be an easy thing to do (and I might even have a go at it myself, even though I have never written anything in go).

Thanks!

Pgwatch2 stops collecting data

Hi again,

Weird things happening on my side. From time to time pgwatch2 just stops collecting data on 1-2 random databases. Checking the logs I could not find anything to help me determine the issue, or maybe I'm not looking at the problem right. The only suspicious thing is this error from pgwatch2 logs: ERRO DBExecRead: read tcp 172.17.0.2:36978->xx.xx.xx.xx:5432: read: connection reset by peer , xx.xx.xx.xx being one of my monitored machines. Keep in mind that pgwatch2 is in a different datacenter than some of the servers, but I'm not sure this is actually an issue because I get No data on alerts quite often for servers in the same datacenter.
Do you have any idea? I'm not sure what to debug anymore or what to look at.
The collecting only resumes after I restart the docker image, but is not consistent, its possible that on the same server data would not be collected shortly.

Regards.

runtime error:index out of range stops pgwatch2 from gathering metrics anymore

While it was monitoring a running postgres instance the following runtime error occurred without a obvious reason. From this point in time, no more new metrics are shown in Grafana, while old metrics still persist.

public.pgstattuple , oid: 12535437
panic: runtime error: index out of range

goroutine 219 [running]:
main.DetectSprocChanges(0xc4201329e0, 0x12, 0xc42032ba60, 0xc4ffffffff, 0xc420010840, 0xc420327e48, 0x0, 0x3, 0xc42001a050)
	/pgwatch2/pgwatch2.go:578 +0x1bab
main.CheckForPGObjectChangesAndStore(0xc4201329e0, 0x12, 0xc42032ba60, 0xffffffff, 0xc420010840, 0xc420327e48)
	/pgwatch2/pgwatch2.go:779 +0x82
main.MetricsFetcher(0xc420356720, 0xc420010840)
	/pgwatch2/pgwatch2.go:827 +0xa70
created by main.main
	/pgwatch2/pgwatch2.go:1177 +0x1d27

During my tests today this error appeared several times.

Backends count for multiple DBs mixed together

The Backends + Deadlocks + Temp bytes panel, the SQL for the backends report is missing the dbname filter, so it mixes all the DBs together, and makes a sawtooth pattern. I fixed it in my install by modifying the query SQL from:
SELECT mean("numbackends") FROM "db_stats" WHERE $timeFilter GROUP BY time($interval) fill(none)
to
SELECT mean("numbackends") FROM "db_stats" WHERE "dbname" =~ /^$dbname$/ AND $timeFilter GROUP BY time($interval) fill(none)

how to get updates of pgwatch2 when restoring data from backup

Hello Karel,

your guide for restoring data from take_backup.sh says that one should rename the databases created by pulling the docker image and to restore the data from pg_dump.
But on this way I would never get changes that you've puplished (saw some scripts changing tables / functions but I have still the content from my first pull --e.g. pgwatch2/sql/datastore_setup/migrations/ * ) Maybe you've updated some of the dashboards too?
Is there a way to apply these updates to the existing DBs without loosing my data?

kind regards
Georg

Security issue [https]

Hello Kaarel,
Thanks for that great tool!

I placed pgwatch2 behind https proxy, but browser shows that connection unsafe, the reason: logo of Cybertec use http connection (DB overview dashboard), can you change it to https.

thanks!

$GOPATH

Very good tool - easy and useful, thank you. I'm trying to make a small change and build it myself, but got the following errors about $GOPATH. Is this something that needs to be set in the Dockerfile?

package github.com/lib/pq: cannot download, $GOPATH not set. For more details see: go help gopath
package github.com/op/go-logging: cannot download, $GOPATH not set. For more details see: go help gopath
package github.com/jmoiron/sqlx: cannot download, $GOPATH not set. For more details see: go help gopath
package github.com/influxdata/influxdb/client/v2: cannot download, $GOPATH not set. For more details see: go help gopath
package github.com/jessevdk/go-flags: cannot download, $GOPATH not set. For more details see: go help gopath
pgwatch2.go:7:2: cannot find package "github.com/influxdata/influxdb/client/v2" in any of:
        /usr/lib/golang/src/github.com/influxdata/influxdb/client/v2 (from $GOROOT)
        ($GOPATH not set)
pgwatch2.go:8:2: cannot find package "github.com/jessevdk/go-flags" in any of:
        /usr/lib/golang/src/github.com/jessevdk/go-flags (from $GOROOT)
        ($GOPATH not set)
pgwatch2.go:9:2: cannot find package "github.com/jmoiron/sqlx" in any of:
        /usr/lib/golang/src/github.com/jmoiron/sqlx (from $GOROOT)
        ($GOPATH not set)
pgwatch2.go:10:2: cannot find package "github.com/lib/pq" in any of:
        /usr/lib/golang/src/github.com/lib/pq (from $GOROOT)
        ($GOPATH not set)
pgwatch2.go:11:2: cannot find package "github.com/op/go-logging" in any of:
        /usr/lib/golang/src/github.com/op/go-logging (from $GOROOT)
        ($GOPATH not set)

take_backup.sh doesn't backup grafana db

Hello @kmoppel ,
while deploying pgwatch2 for our PG databases I've noticed, that the backupscript isn't complete / current.

I tried to restore a backup taken with the provided script but my grafana config was gone including all dashboards a.s.o.
So I poked around to find the reason and finally found that the script dumps twice the same database and both times schema pgwatch2

--=====

echo "backing up Postgres config store DB..."
pg_dump -p $PGPORT -U $PGUSER -n pgwatch2 $PGDATABASE > pgwatch2_config.sql

echo "backing up Grafana config DB..."
pg_dump -p $PGPORT -U $PGUSER -n pgwatch2 $PGDATABASE > grafana_config.sql

--=====

while the docker PG cluster contains 2 databases called pgwatch2 and pgwatch2_grafana and within pgwatch2_grafana schema public is used for the grafana config.
So I've added an additional variable for the second database and modified the pg_dump line for the grafana db.

--=====

PGHOST=127.0.0.1
PGPORT=5432
PGDATABASE=pgwatch2
GRAFANADATABASE=pgwatch2_grafana #this one is new
PGUSER=pgwatch2
PGPASSWORD=pgwatch2admin

echo "backing up Grafana config DB..." #I've left -n pgwatch2 for the case that later versions might switch back to use this schema instead of public
pg_dump -h $PGHOST -p $PGPORT -U $PGUSER -n public -n pgwatch2 $GRAFANADATABASE > grafana_config.sql
--=====

Now the backup contains the data I missed before.

kind regards
Georg

adding multiple databases at once?

Is there a way to add all the databases from an instance to the monitoring dashboard in one go? I tried leaving database as blank and * but didn't work.

Recommend Projects

  • React photo React

    A declarative, efficient, and flexible JavaScript library for building user interfaces.

  • Vue.js photo Vue.js

    🖖 Vue.js is a progressive, incrementally-adoptable JavaScript framework for building UI on the web.

  • Typescript photo Typescript

    TypeScript is a superset of JavaScript that compiles to clean JavaScript output.

  • TensorFlow photo TensorFlow

    An Open Source Machine Learning Framework for Everyone

  • Django photo Django

    The Web framework for perfectionists with deadlines.

  • D3 photo D3

    Bring data to life with SVG, Canvas and HTML. 📊📈🎉

Recommend Topics

  • javascript

    JavaScript (JS) is a lightweight interpreted programming language with first-class functions.

  • web

    Some thing interesting about web. New door for the world.

  • server

    A server is a program made to process requests and deliver data to clients.

  • Machine learning

    Machine learning is a way of modeling and interpreting data that allows a piece of software to respond intelligently.

  • Game

    Some thing interesting about game, make everyone happy.

Recommend Org

  • Facebook photo Facebook

    We are working to build community through open source technology. NB: members must have two-factor auth.

  • Microsoft photo Microsoft

    Open source projects and samples from Microsoft.

  • Google photo Google

    Google ❤️ Open Source for everyone.

  • D3 photo D3

    Data-Driven Documents codes.