Comments (17)
 amirnissim
commented on April 28, 2024
amirnissim
commented on April 28, 2024
@arikfr, @ranbena how about we call this 'Goal' visualization?
from redash.
amirnissim
commented on April 28, 2024
@arikfr any thoughts on how the dataset should look like? maybe something like:
SELECT foo as "::goal" ...
from redash.
 arikfr
commented on April 28, 2024
arikfr
commented on April 28, 2024
- "Goal" is too specific. Better to have a counter with goal option.
- I don't want to keep using the "::" convention. To make it easier, we can add heuristics to pick what column contains the data, but anyway it should have settings like all the charts visualization.
from redash.
amirnissim
commented on April 28, 2024
for the query:
select 13 as "count";

from redash.
amirnissim
commented on April 28, 2024
first draft. please share your thoughts @arikfr @ranbena.
from redash.
 ranbena
commented on April 28, 2024
ranbena
commented on April 28, 2024
- Does it work well with the other widgets in a dashboard? (currently can't access rd)
- The arrow and number look like they represent change and not diff from goal. Should consult UX.
from redash.
arikfr
commented on April 28, 2024
I think the visualization is a bit confusing, my suggestion:
Show it as : "Number (Target)" in your example 13 (15). If the number<target show it in red, otherwise green.
from redash.
amirnissim
commented on April 28, 2024
I was inspired by @itaimiller design for tabla

from redash.
arikfr
commented on April 28, 2024
Itai is a great inspiration, but he tried convey different information :-) "9% ^" in this screenshot means increase of 9% over some period of time. That's not the kind of information you show...
If you prefer you can show +X (green) -X (red) without the arrows. Maybe like this:
First row: [VALUE]
Second row: -X (TARGET)
from redash.
amirnissim
commented on April 28, 2024
@arikfr I initially tried value (goal) and it looked confusing to me.
It's still not clear to me what the use case would be, @ranbena should have a real example.
Maybe if the use case is "current VS target" we should simply show the delta: +10 or -5 as the main number.
from redash.
arikfr
commented on April 28, 2024
What about my second suggestion?
from redash.
 joeysim
commented on April 28, 2024
joeysim
commented on April 28, 2024
I think we shouldn't have a predefined visualization target value but rather return both values from the query itself, allowing us to basically support both visualizations in one (a - number vs. static number and b - number vs. change coming from a time shifted query)
from redash.
arikfr
commented on April 28, 2024
+1 for @joeysim.
from redash.
amirnissim
commented on April 28, 2024
how about this (pushed):
select 17 as "counter", 16 as "target";
select 13 as "counter", 16 as "target";
from redash.
arikfr
commented on April 28, 2024
SUPER!
Just covert the column picker into a drop down... although even as is it's great. So only if you have time.
from redash.
 shishirsharma
commented on April 28, 2024
shishirsharma
commented on April 28, 2024
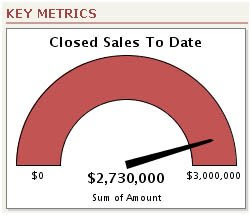
If we put a monthly target, There is no point of showing up or down. Monthly targets might be really big/can be hard to achieve. There should be a visualisation like this one here
http://1.bp.blogspot.com/_XPquV_XKF1c/SSHwj6uuDzI/AAAAAAAAAbc/a5DFj7izu9Q/s400/g1.jpg

from redash.
arikfr
commented on April 28, 2024
@shishirsharma makes sense. It's better if you open a new issue for it (or even better: a pull request 😉).
from redash.
Related Issues (20)
- Uncaught promise error in Edit Visualization Dialog Modal
- date parameter configuration in redash self hosting. HOT 3
- Redash does not connect to Microsoft SQL Azure HOT 2
- queury in queue issue
- SchedulerWorker doesn't refresh query HOT 1
- Redash can't refresh mongodb schema unless all collections are granted HOT 2
- How to customize data label in redash HOT 1
- Query Results Error When I Join Multitable
- How can I disable/hide filters in an embedded dashboard? HOT 1
- Problem with asset location server.css after setup on Ubuntu HOT 1
- Slack as Alert destination: URLs in messages posted to Slack are not clickable links HOT 1
- Downgrading then upgrading redash schemas doesn't work HOT 6
- DynamoDB Support (regression issue) HOT 2
- numberFormat and thousandsSep HOT 6
- How to add counter visualization clickable its is possible ? HOT 2
- Feature request: an installation script for Fedora! HOT 1
- Front end data type display exception HOT 7
- puppeteer issue with Apple Silicon chips HOT 19
- Data Source "Redshift (with IAM User/Role)" does not support Redshift Serverless HOT 2
- Redash adds `/redash` prefix if a string starts with `/api` HOT 2
Recommend Projects
-
 React
React
A declarative, efficient, and flexible JavaScript library for building user interfaces.
-
Vue.js
🖖 Vue.js is a progressive, incrementally-adoptable JavaScript framework for building UI on the web.
-
 Typescript
TypeScript is a superset of JavaScript that compiles to clean JavaScript output.
-
TensorFlow
An Open Source Machine Learning Framework for Everyone
-
Django
The Web framework for perfectionists with deadlines.
-
 Laravel
A PHP framework for web artisans
-
D3
Bring data to life with SVG, Canvas and HTML. 📊📈🎉
-
Recommend Topics
-
javascript
JavaScript (JS) is a lightweight interpreted programming language with first-class functions.
-
web
Some thing interesting about web. New door for the world.
-
server
A server is a program made to process requests and deliver data to clients.
-
Machine learning
Machine learning is a way of modeling and interpreting data that allows a piece of software to respond intelligently.
-
Visualization
Some thing interesting about visualization, use data art
-
Game
Some thing interesting about game, make everyone happy.
Recommend Org
-
Facebook
We are working to build community through open source technology. NB: members must have two-factor auth.
-
Microsoft
Open source projects and samples from Microsoft.
-
Google
Google ❤️ Open Source for everyone.
-
Alibaba
Alibaba Open Source for everyone
-
D3
Data-Driven Documents codes.
-
Tencent
China tencent open source team.
from redash.