Comments (4)
 hediet
commented on April 28, 2024
hediet
commented on April 28, 2024
Which debugger do you use for rust?
I remember that calling trait methods from gdb was not possible.
If you visualize a suitable json string, it should work out of the box.
from vscode-debug-visualizer.
 Nugine
commented on April 28, 2024
Nugine
commented on April 28, 2024
The debugger is lldb.
I manually generate a visualization string at each break point and get the visualizer worked.
Here is a proof of concept.

use serde::Serialize;

#[derive(Debug, Serialize)]
struct Label {
    label: Option<String>,
}
#[derive(Debug, Serialize)]
struct Row {
    label: Option<String>,
    columns: Vec<Column>,
}
#[derive(Debug, Serialize)]
struct Column {
    content: Option<String>,
    tag: Option<String>,
    color: Option<String>,
}
#[derive(Debug, Serialize)]
struct Marker {
    id: String,
    row: u64,
    column: u64,
    rows: Option<u64>,
    columns: Option<u64>,
    label: Option<String>,
    color: Option<String>,
}

#[allow(clippy::trivially_copy_pass_by_ref)]
fn is_false(b: &bool) -> bool {
    !*b
}

#[derive(Debug, Serialize)]
struct Kind {
    #[serde(skip_serializing_if = "is_false")]
    array: bool,
}

#[derive(Debug, Serialize)]
pub struct Grid {
    kind: Kind,
    #[serde(rename = "columnLabels")]
    column_labels: Option<Vec<Label>>,
    rows: Vec<Row>,
    markers: Option<Vec<Marker>>,
}

fn show_arr(a: &[i32]) -> String {
    let n = a.len();
    let labels: Vec<Label> = (0..n)
        .map(|i| Label {
            label: Some(i.to_string()),
        })
        .collect();
    let columns: Vec<Column> = a
        .iter()
        .map(|x| Column {
            content: Some(format!("{:?}", x)),
            tag: Some(x.to_string()),
            color: None,
        })
        .collect();
    let row = Row {
        label: None,
        columns,
    };
    let kind = Kind { array: true };

    let grid = Grid {
        kind,
        column_labels: Some(labels),
        rows: vec![row],
        markers: None,
    };

    serde_json::to_string(&grid).unwrap()
}

fn main() {
    let mut arr = vec![1, 2, 3];
    let mut _s = show_arr(&arr);
    for _ in 0..5 {
        arr.swap(0, 2); // break point
        _s = show_arr(&arr);
    }
    dbg!(arr); // break point
    println!("Hello, world!");
}
It is more difficult for no-vm languages to debug with visualization. I think it's impossible to visualize without intrusive code.
from vscode-debug-visualizer.
hediet
commented on April 28, 2024
I think it's impossible to visualize without intrusive code [for no-vm languages].
You might be right. Injecting code into runtimes of scripting languages is very easy (you can just eval' a class declaration), into languages interpreting bytecode harder (you need to invoke the class loader) and compiled languages very hard.
The vscode-lldb extension already supports debug visualizers. They are written in python and output html using lldb's debugging API and are very specific to Rust/C++. My extension is almost generic and builds a lot of infrastructure around the visualizations. Maybe, by implementing a special case for lldb, my extension use the same approach.
A year ago, I worked on a MiniJava compiler in Rust.
Back then, I hacked together a prototype of this extension that could visualize the lattice states during constant folding and load store optimization. It was incredibly useful, without it I don't think I could've tackled that task in the given time.
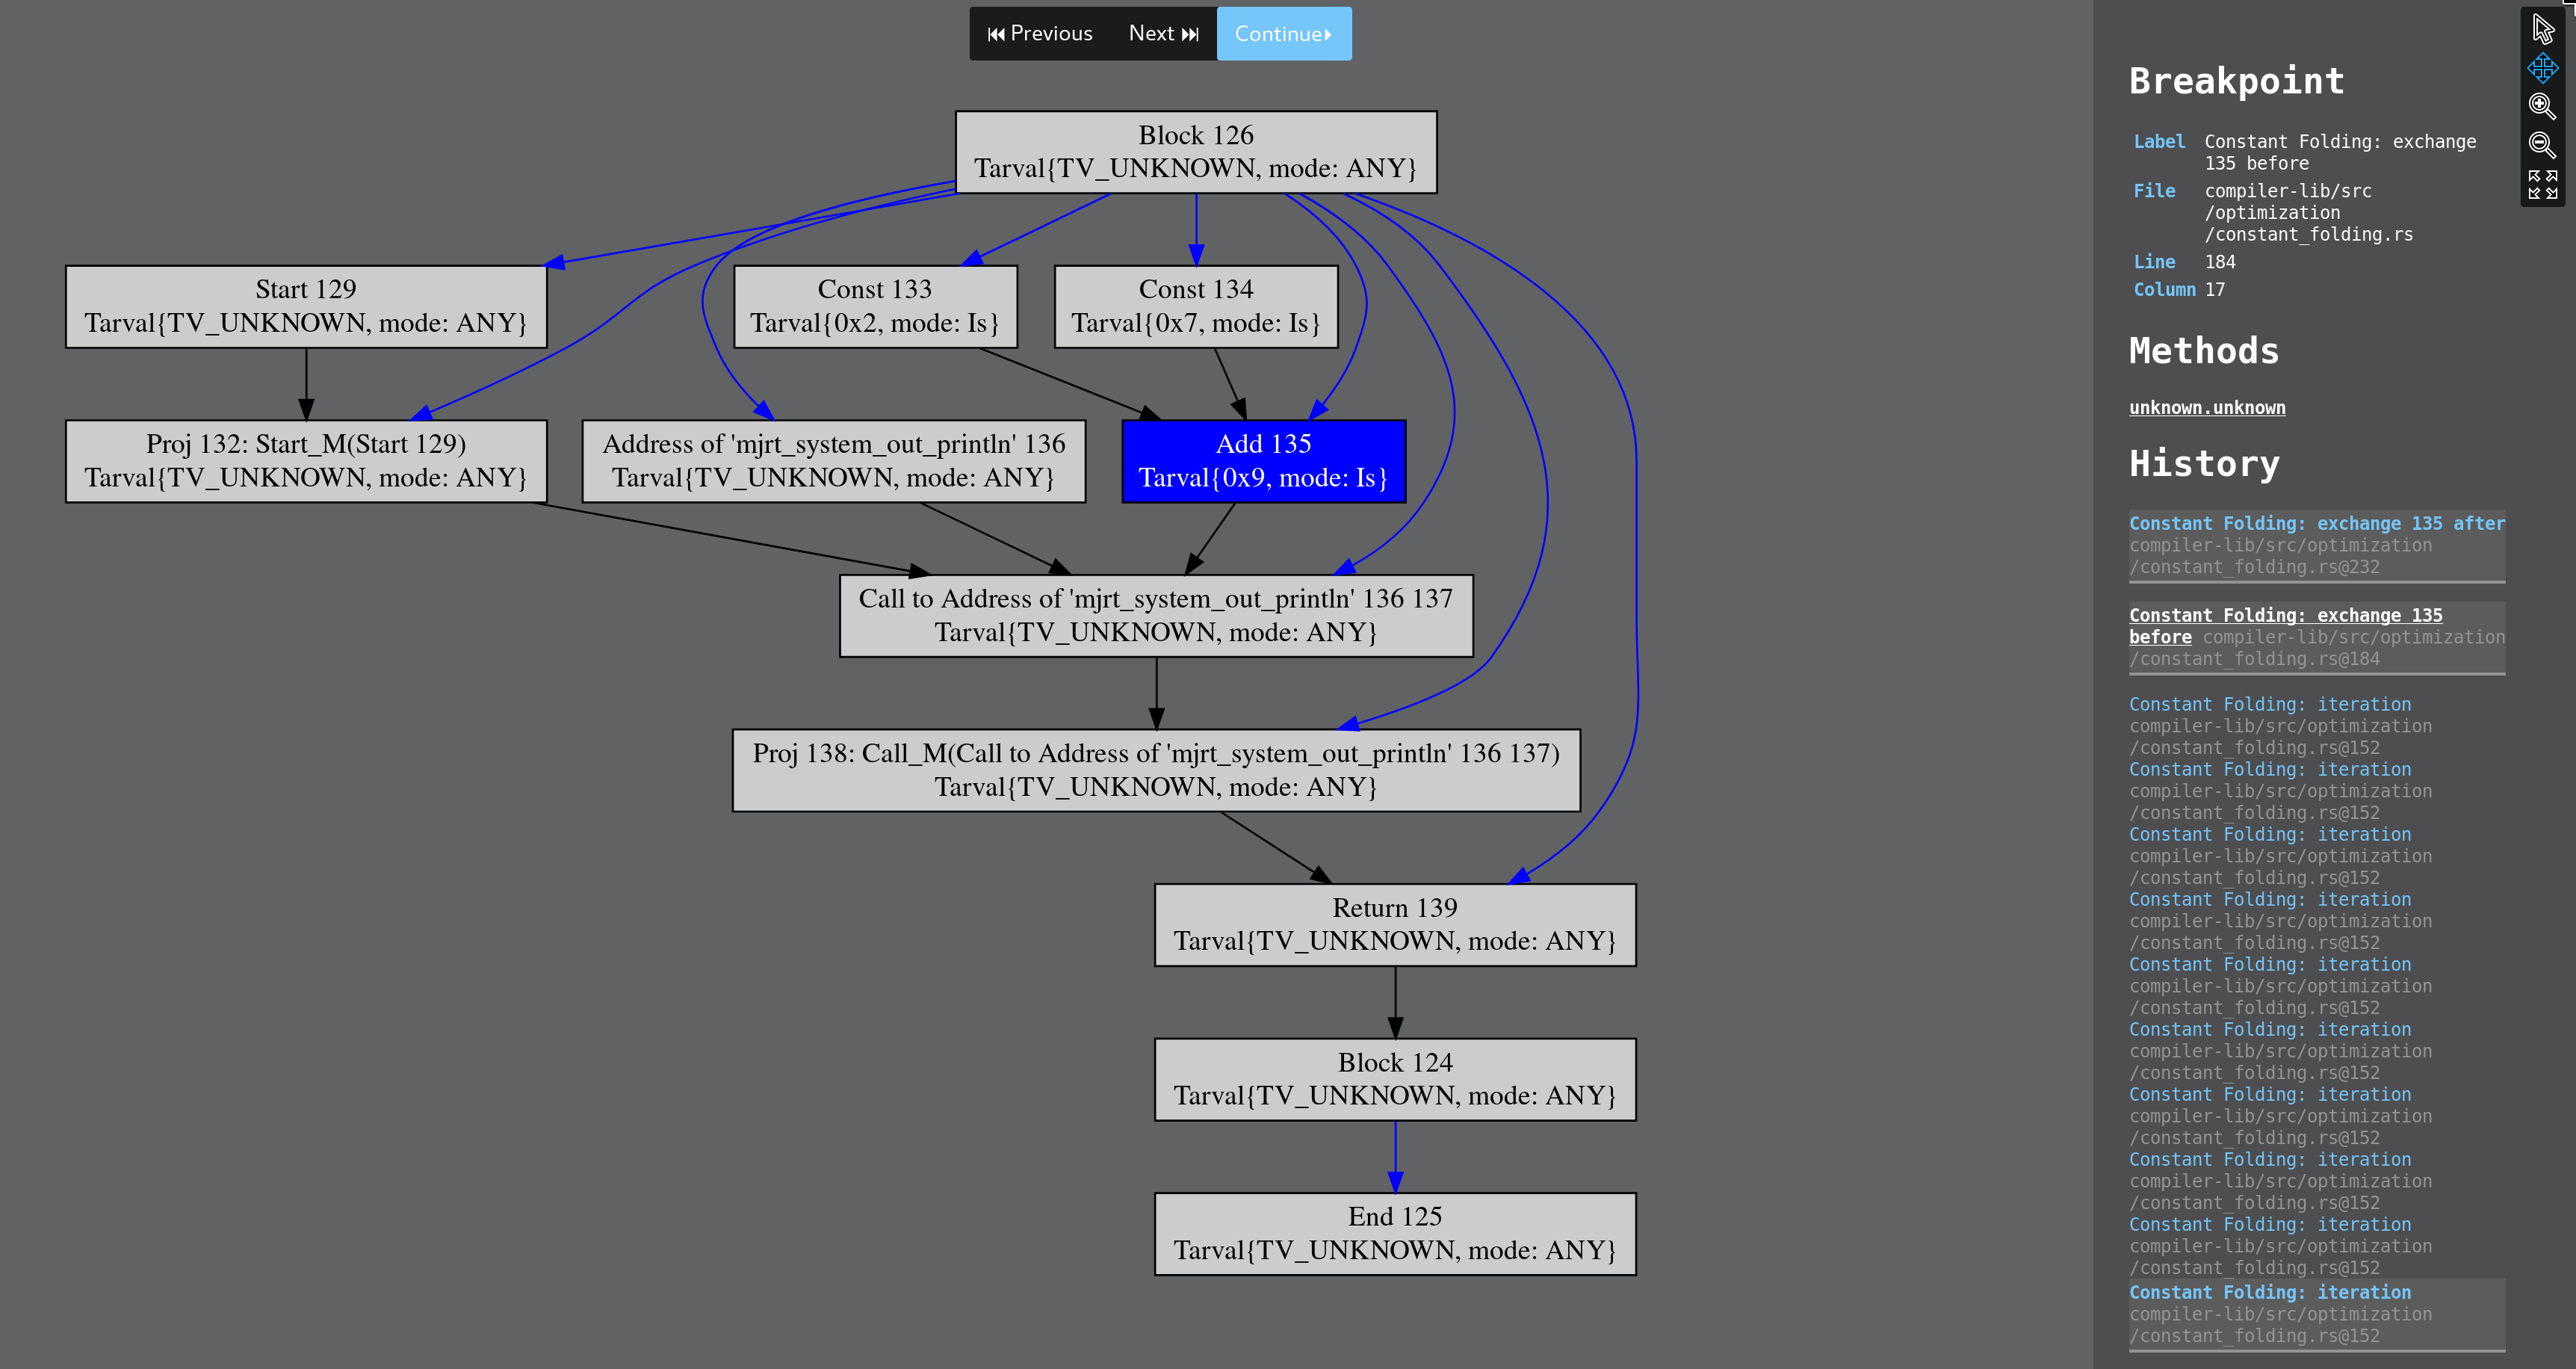
So I still think that this extension might be very useful for compile time languages in some specific cases. Beginners shouldn't use rust to learn algorithms anyway.
Thanks for that demo btw.! Maybe a crate would be awesome!
from vscode-debug-visualizer.
Nugine
commented on April 28, 2024
Cheers!
from vscode-debug-visualizer.
Related Issues (20)
- debug visualizer doesn't get frame id correctly when selecting frame from call stack
- Is Deno not supported as a debugging runtime environment?
- Use with jupyter kernel
- Unable to run debug visualizer HOT 4
- data extractor help HOT 2
- Failed to visualize with Swift Demo,= ~~~
- Can you support idea plugIn
- CPP does not wqork HOT 1
- Missing support for "gdb" debug adapter
- https://github.com/hediet/vscode-debug-visualizer
- Visualization in python
- Publish `Debug Visualizer` to Open VSX
- Overcome python debug adapter's string truncation limit HOT 10
- Please create and example in C
- Is not working for dart language
- No able to run Debug visualizer
- `yarn build` fails on most recent commit HOT 2
- C# debugger has a very low (1024 chars) JSON length limit HOT 12
- Unable to show geometries data HOT 2
- Short choice of visualisers HOT 6
Recommend Projects
-
 React
React
A declarative, efficient, and flexible JavaScript library for building user interfaces.
-
Vue.js
🖖 Vue.js is a progressive, incrementally-adoptable JavaScript framework for building UI on the web.
-
 Typescript
TypeScript is a superset of JavaScript that compiles to clean JavaScript output.
-
TensorFlow
An Open Source Machine Learning Framework for Everyone
-
Django
The Web framework for perfectionists with deadlines.
-
 Laravel
A PHP framework for web artisans
-
D3
Bring data to life with SVG, Canvas and HTML. 📊📈🎉
-
Recommend Topics
-
javascript
JavaScript (JS) is a lightweight interpreted programming language with first-class functions.
-
web
Some thing interesting about web. New door for the world.
-
server
A server is a program made to process requests and deliver data to clients.
-
Machine learning
Machine learning is a way of modeling and interpreting data that allows a piece of software to respond intelligently.
-
Visualization
Some thing interesting about visualization, use data art
-
Game
Some thing interesting about game, make everyone happy.
Recommend Org
-
Facebook
We are working to build community through open source technology. NB: members must have two-factor auth.
-
Microsoft
Open source projects and samples from Microsoft.
-
Google
Google ❤️ Open Source for everyone.
-
Alibaba
Alibaba Open Source for everyone
-
D3
Data-Driven Documents codes.
-
Tencent
China tencent open source team.
from vscode-debug-visualizer.