Comments (11)
 hkzhang95
commented on June 18, 2024
1
hkzhang95
commented on June 18, 2024
1
Hi, I write a simple python script for visualization at #37. Please have a check about whether it is correct.
from image-adaptive-3dlut.
 HuiZeng
commented on June 18, 2024
HuiZeng
commented on June 18, 2024
Hi, sorry for the late reply.
I do have a matlab code to visualize the learned 3D LUTs. However, I am currently taking a quarantine and unavilable to this code.
I will update the code after the quarantine.
from image-adaptive-3dlut.
 tnt-ooo-tnt
commented on June 18, 2024
tnt-ooo-tnt
commented on June 18, 2024
I am so afraid to hear that
I hope you get well soon, cheers 👍
from image-adaptive-3dlut.
HuiZeng
commented on June 18, 2024
Hi, I have uploaded the code for visualization of learned luts.
There are two steps:
- run the python code to write the learned lut into a .txt file.
- run the matlab code to visualize the 3d lut.
You may need to check the paths and file names according to your own enviroments.
from image-adaptive-3dlut.
hkzhang95
commented on June 18, 2024
I am a little confused about the visualization results.
From my understanding, the visualization of 3D LUT should be a point cube in which each point matches a new color. Here is an example from the internet:
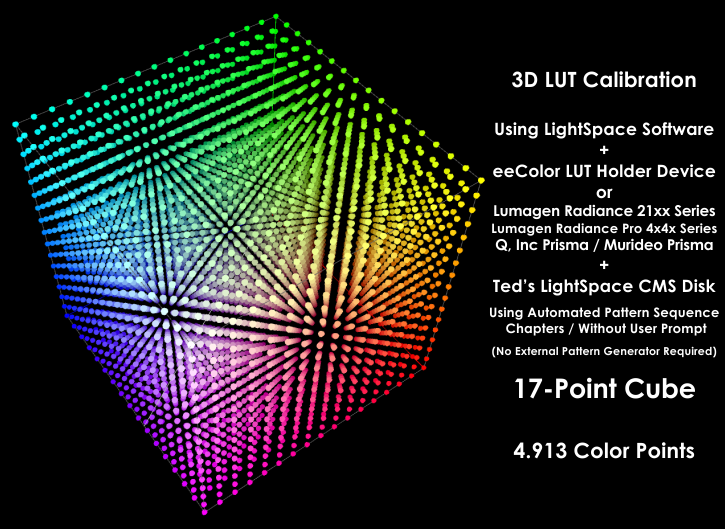
However, the visualization results from Fig.4 in the paper are not exact cubes. So I am wondering about the meanings of the axes in each figure. Maybe for each component (e.g. R), the visualization should be a cube, then each point (R_in, G_in, B_in) matches a new R-value?
from image-adaptive-3dlut.
HuiZeng
commented on June 18, 2024
Hi, the example you provide is indeed more vivid. In this 3D cube, each point contains three values, namely, the {R_out, G_out. B_out}, rather than one single value. It actually contains 4D information. Unfortunately, I do not know how to plot 3D LUT like this. Also it is inconvenient to see the details in such a dense plot.
Instead, I choose to visualize the R, G, B channel independently. Your understanding is right. The three axes represent the R_in, G_in, B_in while the output R (or G, or B) values are plotted as multiple slices rather than one cube. You can also choose to visualize all R values as a cube if you like.
from image-adaptive-3dlut.
tnt-ooo-tnt
commented on June 18, 2024
Thank you for your effort a lot,
I will let this issue be opened for a several days if you don't mind for derived discussion.
Thank you again so much
from image-adaptive-3dlut.
hkzhang95
commented on June 18, 2024
Hi, the example you provide is indeed more vivid. In this 3D cube, each point contains three values, namely, the {R_out, G_out. B_out}, rather than one single value. It actually contains 4D information. Unfortunately, I do not know how to plot 3D LUT like this. Also it is inconvenient to see the details in such a dense plot.
Instead, I choose to visualize the R, G, B channel independently. Your understanding is right. The three axes represent the R_in, G_in, B_in while the output R (or G, or B) values are plotted as multiple slices rather than one cube. You can also choose to visualize all R values as a cube if you like.
Maybe I did not make myself clear enough.
You said that The three axes represent the R_in, G_in, B_in. But from your code, the third axis represents the value of R/G/B. So from my viewpoint, one of the axis information is missing, and this is the reason why the visualization result is not a standard cube.
from image-adaptive-3dlut.
hkzhang95
commented on June 18, 2024
I will provide a python script to visualize the LUT like the example I provided if I am available. : )
from image-adaptive-3dlut.
HuiZeng
commented on June 18, 2024
Hi, the example you provide is indeed more vivid. In this 3D cube, each point contains three values, namely, the {R_out, G_out. B_out}, rather than one single value. It actually contains 4D information. Unfortunately, I do not know how to plot 3D LUT like this. Also it is inconvenient to see the details in such a dense plot.
Instead, I choose to visualize the R, G, B channel independently. Your understanding is right. The three axes represent the R_in, G_in, B_in while the output R (or G, or B) values are plotted as multiple slices rather than one cube. You can also choose to visualize all R values as a cube if you like.Maybe I did not make myself clear enough.
You said that
The three axes represent the R_in, G_in, B_in. But from your code, the third axis represents the value of R/G/B. So from my viewpoint, one of the axis information is missing, and this is the reason why the visualization result is not a standard cube.
Yes, you are right. I just checked the code. It actually plots (R_in, G_in, R_out/G_out/B_out) and there are a total of six dimensions (R_in, G_in, B_in, R_out, G_out, B_out).
That will be great if you can provide a more elegent visualization script.
from image-adaptive-3dlut.
HuiZeng
commented on June 18, 2024
Hi, I write a simple python script for visualization at #37. Please have a check about whether it is correct.
Hi, many thanks for your help. I have merged your python script and also updated the matlab code.
It seems this issue can be closed.
from image-adaptive-3dlut.
Related Issues (20)
- Eval images corrupt when training using unpaired dataset HOT 1
- 你好!当我将3DLUT模型的pth模型转换到onnx模型的时候,出现trilinearInterpolationFunction报错,该怎么解决呢?
- python3 image_adaptive_lut_train_paired.py
- Segmentation fault while training HOT 6
- how to solve 3dlut banding HOT 1
- Fatal Error (Is it a LUT?) HOT 3
- 3DLUT 参数量计算 HOT 2
- LUT 学习方式 HOT 1
- CPU和GPU的运行结果不一致
- AttributeError: module 'trilinear' has no attribute 'forward' HOT 3
- 关于LUT的问题 HOT 1
- About TV_3D loss
- 關於kernel size
- 为什么 classifier 采用复杂网络,性能狂掉?
- 直接跑预训练模型 视频调色比较稳定,但是自己训练的模型无法复现预训练效果?
- 请问LUT1和LUT2是初始化为零的表,无法更新,那让它们乘上权重有什么意义呢?
- Can you tell me how to convert hdrplus dataset to XYZ colorspace
- trilinear_kernel HOT 1
- Cube file
- Segmentation fault
Recommend Projects
-
 React
React
A declarative, efficient, and flexible JavaScript library for building user interfaces.
-
Vue.js
🖖 Vue.js is a progressive, incrementally-adoptable JavaScript framework for building UI on the web.
-
 Typescript
TypeScript is a superset of JavaScript that compiles to clean JavaScript output.
-
TensorFlow
An Open Source Machine Learning Framework for Everyone
-
Django
The Web framework for perfectionists with deadlines.
-
 Laravel
A PHP framework for web artisans
-
D3
Bring data to life with SVG, Canvas and HTML. 📊📈🎉
-
Recommend Topics
-
javascript
JavaScript (JS) is a lightweight interpreted programming language with first-class functions.
-
web
Some thing interesting about web. New door for the world.
-
server
A server is a program made to process requests and deliver data to clients.
-
Machine learning
Machine learning is a way of modeling and interpreting data that allows a piece of software to respond intelligently.
-
Visualization
Some thing interesting about visualization, use data art
-
Game
Some thing interesting about game, make everyone happy.
Recommend Org
-
Facebook
We are working to build community through open source technology. NB: members must have two-factor auth.
-
Microsoft
Open source projects and samples from Microsoft.
-
Google
Google ❤️ Open Source for everyone.
-
Alibaba
Alibaba Open Source for everyone
-
D3
Data-Driven Documents codes.
-
Tencent
China tencent open source team.
from image-adaptive-3dlut.