Comments (14)
 PauBadiaM
commented on June 8, 2024
1
PauBadiaM
commented on June 8, 2024
1
Thanks for the interest! Regarding your questions:
1. documentation
How are the cutoffs defined, e.g. does min_prop mean one group needs to have more expressing cells than this fraction, or all cells (same applies for the other filtering attributes)?
min_prop refers to the proportion of cells that express a gene (non-zero value) in a sample-group pair. If groups_col is None, then its just at the sample level. This is also the case for min_cells and min_counts. min_smpls is done at the group level instead. I will add this to the docs.
How were the default values chosen, and are there recommendations to choose other values for certain use-cases? To me, 0.2 seems a bit conservative for general usage, but maybe you had reasons for this value.
The default values were chosen based on different datasets that I'm working on, but they are arbitrary. As a quality check, I was checking the results of DEA, if logFC exploded that means that I was selecting noisy genes only expressed in few samples and cells of a group. Here is an example of how it looks with min_prop=0.05 and min_smpls=1 for the B-cells in the COVID dataset used in the pseudobulk vignette:

With stricter values, this is how it looks:
For DEA this is a possible approach but it is very hard to come up with good default parameters for each use case.

2. Allow to specify a callback function for mode
Taking a callback in addition to sum/mean/median would allow maximum flexibility.
A usecase that comes to my mind is to compute the fraction of cells expressing a gene. This could be used to make dotplots of pseudobulk (mode = lambda x: np.sum(x >= 1) / len(x))
I like this idea a lot! Although there might be some problems with the checks I do. I added them so that users by default can't do the sum of counts with the scaled .X, something I observed that was quite common, but I could make that if they use a callback function they are disabled so no problem.
An extension of this idea is to allow passing a Dict[str, Callable] to allow different aggregations into different layers, e.g.
Sound good too! I also have a swap_layer()(docs) function that could come in handy if users what to change the one they are using.
3. Allow to group by multiple columns
I commonly need pseudobulk by sample, condition and cell-type. It would be great if groups_col could take multiple keys, e.g.
Easy enough to implement.
4. include stats in .obs: n_cells
It would be nice to generate an additional column in
obsthat stores how many cells were included into the pseudobulk sample. This may be useful as an additional covariate when performing differential expression analysis.
Love this idea! This could be done at the var level too. Then, they could also be used as quality control metrics to check and if needed, change the used cutoffs.
from decoupler-py.
PauBadiaM
commented on June 8, 2024
1
Hi @grst,
After working on it I've made some changes on how we do pseudobulk:
-
By default, now it does not filter features. I've observed that the default values might have been too stringent. Additionally, people are mainly using edgeR's filtering strategy which differs from the one we have. For these reasons, I've decided to perform the filtering of features into two separate functions,
filter_by_expr(edgeR) orfilter_by_prop(decoupler), then people can choose or even perform both. I've also added plotting functions to better decide which thresholds to use as shown in the vignette, or here as an example, edgeR's filtering strategy:
-
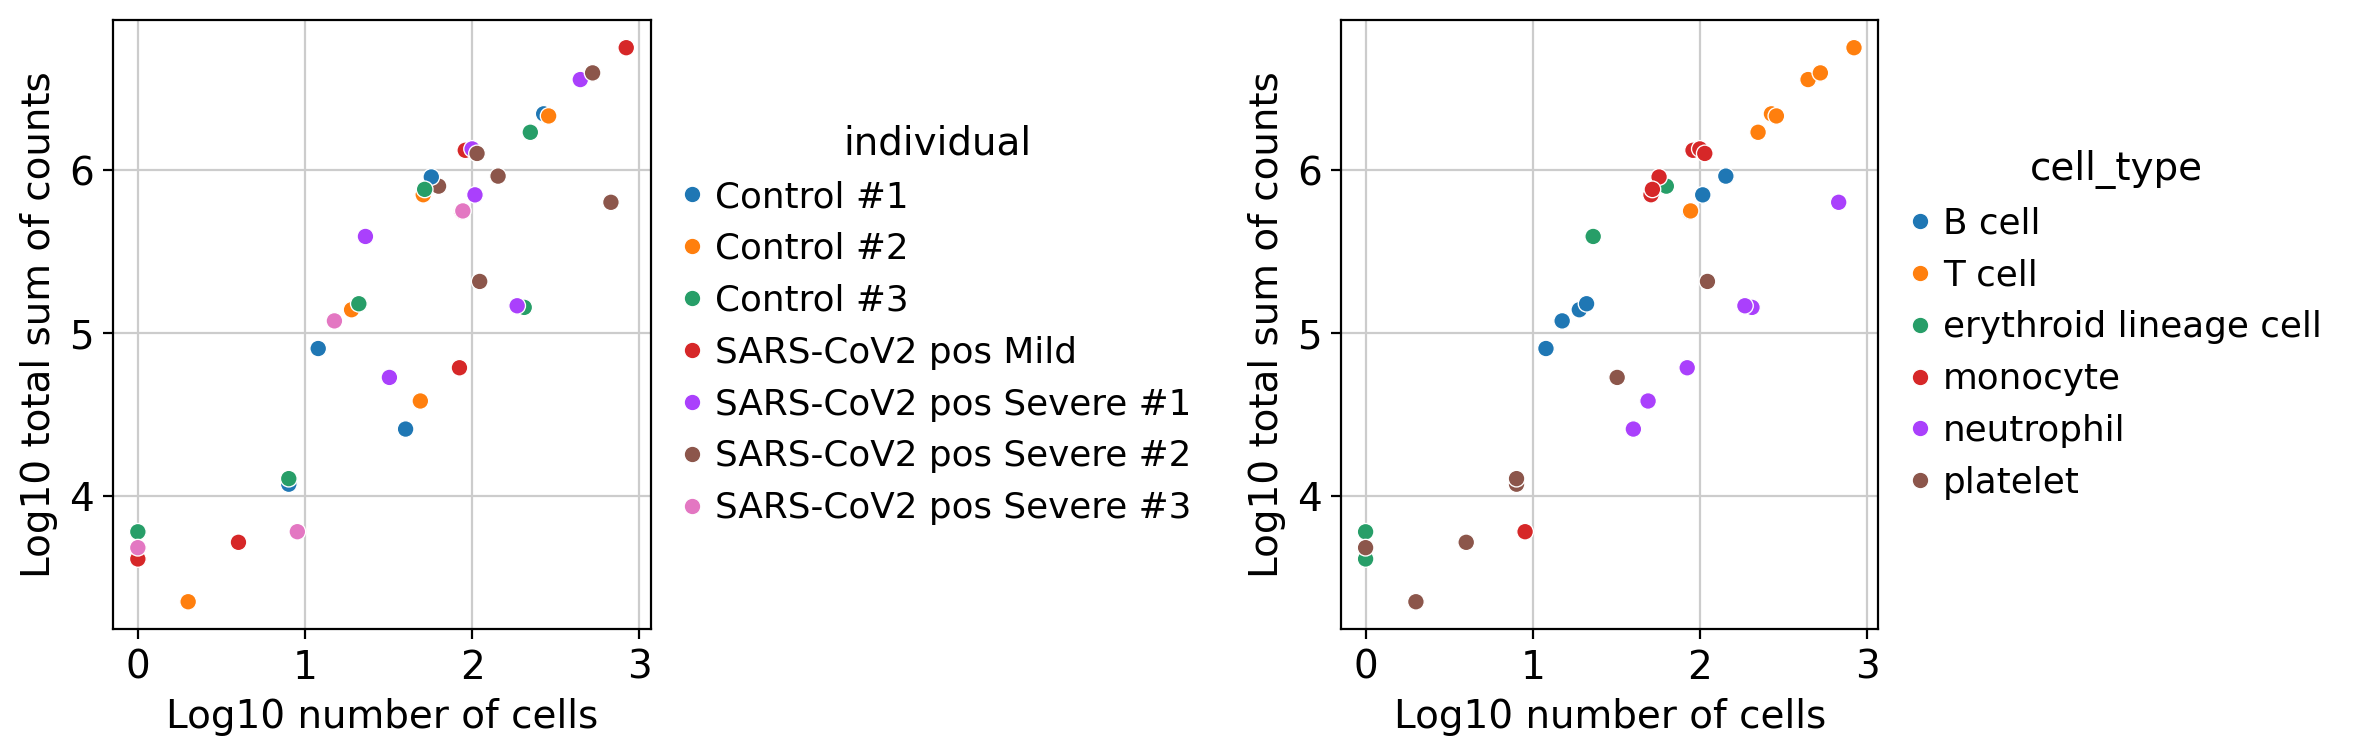
The new object now contains quality control metrics such as the number of cells per sample (
psbulk_n_cells), the number of counts per sample (psbulk_counts) and the proportion of cells that expressed that gene (psbulk_props). I've also added plots to decide which samples to drop:
For example here it might be good to filter out samples that contain less than 10 cells (mainly platelet cells). -
Now
groups_colaccepts take multiple keys as we discussed. -
Now
modeaccepts a dictionary of callable functions. The resulting profiles will be stored in.layers.

I've also updated the vignettes to use PyDESeq2 for DEA and added more plotting functions if you are interested. All changes additions are reported in the release notes.
Regarding your question
I'm not sure if I got this. By "sample-group pair" I believe you are referring to what will be one row in obs of the generated pseudobulk AnnData. Does this mean that if the min_prop threshold is exceeded in at least one of the sample-group pairs, the gene will be included?
Exactly! If the min_prop threshold is exceeded in at least N sample-group pairs of group M.
from decoupler-py.
 Zethson
commented on June 8, 2024
1
Zethson
commented on June 8, 2024
1
CC @alitinet
from decoupler-py.
 grst
commented on June 8, 2024
1
grst
commented on June 8, 2024
1
Nice work!
@BorisMuzellec, you might be interested in the updated vignette now showcasing how to use decoupler+PyDESeq2 for pseudo-bulk single-cell analysis.
from decoupler-py.
grst
commented on June 8, 2024
1
Hi @PauBadiaM,
we've started using the latest dev version and the new pseudobulk functionality and it works great!
Could you put that into a release soon-ish?
Best,
Gregor
from decoupler-py.
 rasmirnov
commented on June 8, 2024
1
rasmirnov
commented on June 8, 2024
1
Hello @PauBadiaM,
I'm getting an error ValueError: Grouper and axis must be same length when I group data by multiply variable. I've tried with one and everything worked fine, but not with a list..
Here is my code:
pdata = dc.get_pseudobulk(adata, sample_col='sample', groups_col= ['cell_type', 'organ'], layer='counts', mode='sum', min_cells=10)
Will be glad for any help!
Roma
P.S: Turned out everything works correctly. My problem was that I installed not the latest dev version, but a regular one. Now I will always install via github)
from decoupler-py.
grst
commented on June 8, 2024
1
One small comment on the tutorial (and/or the respective function docstring):
I would find it useful to have a bit more details of how to interpret the plot_filter_by_expr plot. I as a bit lost in the beginning. In particular, what do the dashed lines represent, and how exactly does this help determining thresholds?

from decoupler-py.
PauBadiaM
commented on June 8, 2024
1
Sure no problem, next Tuesday works.
from decoupler-py.
grst
commented on June 8, 2024
Hi Pau,
thanks for your response!
1. documentation
How are the cutoffs defined, e.g. does min_prop mean one group needs to have more expressing cells than this fraction, or all cells (same applies for the other filtering attributes)?
min_proprefers to the proportion of cells that express a gene (non-zero value) in a sample-group pair. Ifgroups_colisNone, then its just at the sample level. This is also the case formin_cellsandmin_counts.min_smplsis done at the group level instead. I will add this to the docs.
I'm not sure if I got this. By "sample-group pair" I believe you are referring to what will be one row in obs of the generated pseudobulk AnnData. Does this mean that if the min_prop threshold is exceeded in at least one of the sample-group pairs, the gene will be included?
How were the default values chosen, and are there recommendations to choose other values for certain use-cases? To me, 0.2 seems a bit conservative for general usage, but maybe you had reasons for this value.
The default values were chosen based on different datasets that I'm working on, but they are arbitrary. As a quality check, I was checking the results of DEA, if logFC exploded that means that I was selecting noisy genes only expressed in few samples and cells of a group.
Thanks for clarifying! I have observed the same patterns ("winged volcano plot") when working with pseudobulk DE analyses. It does look weird, but I'm not entirely sure, if those genes with exceedingly high fold-change are necessarily false-positives. My suspicion is that they are all-zero in one of the conditions, and non-zero in the other which could still be biologically relevant. However, I didn't yet get around to verify this suspicion.
2. Allow to specify a callback function for mode
Taking a callback in addition to sum/mean/median would allow maximum flexibility.
A usecase that comes to my mind is to compute the fraction of cells expressing a gene. This could be used to make dotplots of pseudobulk (mode = lambda x: np.sum(x >= 1) / len(x))I like this idea a lot! Although there might be some problems with the checks I do. I added them so that users by default can't do the sum of counts with the scaled
.X, something I observed that was quite common, but I could make that if they use a callback function they are disabled so no problem.
Just as an idea, the pandas.merge function has a validate parameter. We could have something similar, e.g. validate: Optional[Literal["counts", "lognorm"]] = "counts" to choose between different validation strategies, or disable it altogether. Disabling it when a callback is specified would be fine, too.
It would be nice to generate an additional column in
obsthat stores how many cells were included into the pseudobulk sample. This may be useful as an additional covariate when performing differential expression analysis.Love this idea! This could be done at the
varlevel too. Then, they could also be used as quality control metrics to check and if needed, change the used cutoffs.
Sounds great!
from decoupler-py.
PauBadiaM
commented on June 8, 2024
Sorry for the late reply. Glad it worked @rasmirnov! @grst I need to finish something else first but I'm working on the release to pypi, I'll also update the docs to make the filtering clearer.
from decoupler-py.
PauBadiaM
commented on June 8, 2024
Finally had time to update the docs and make the release, closing this for now.
from decoupler-py.
grst
commented on June 8, 2024
Hi @PauBadiaM,
would you be up for presenting a walkthrough of pseudobulk-DE analysis in one of the scverse community meetings? It's usually a short presentation ~10min followed by open discussion with the community.
Ping @mikelkou who is organizing them.
from decoupler-py.
PauBadiaM
commented on June 8, 2024
Hi @grst @mikelkou,
Gladly! Just let me know a date ;)
from decoupler-py.
 mikelkou
commented on June 8, 2024
mikelkou
commented on June 8, 2024
Hi @PauBadiaM,
That's great!
It is already next Tuesday (13th of June) at 18.00. Let us know if you can make it. :)
from decoupler-py.
Related Issues (20)
- run_ora_df HOT 2
- Loading resources for mouse is not working HOT 9
- Flag for sorting of gene names HOT 4
- shuffle_nets function produces networks with repeated edges HOT 1
- Module request: UCell signatures HOT 2
- use of the run_gsva method : format of the net argument HOT 1
- Switching to conda forge HOT 7
- Problems running decoupleR with Compressed Sparse Column (csc) count matrix HOT 2
- Error downlaoding progeny model for mouse species HOT 3
- shuffle_net output not random HOT 1
- method run_gsea() error : SystemError: CPUDispatcher(<function nb_gsea at 0x7f7477d3b9c0>) returned a result with an exception set HOT 6
- Pseudobulk for each sample HOT 2
- Method dc.run_gsva error HOT 2
- Get gene markers used to annotate the cell type HOT 2
- dc.get_progeny(organism = 'mouse') fails with ImportError HOT 5
- ValueError: Invalid value `loops` for `InteractionsQuery` in dc.get_collectri() HOT 2
- Functional PB Tutorial fails at dc.plot_associations HOT 5
- dc.get_collectri() does not work HOT 2
- Announcement: some Galaxy modules for some decoupler functionalities HOT 1
- Limiting usage of cores or threads HOT 2
Recommend Projects
-
 React
React
A declarative, efficient, and flexible JavaScript library for building user interfaces.
-
Vue.js
🖖 Vue.js is a progressive, incrementally-adoptable JavaScript framework for building UI on the web.
-
 Typescript
TypeScript is a superset of JavaScript that compiles to clean JavaScript output.
-
TensorFlow
An Open Source Machine Learning Framework for Everyone
-
Django
The Web framework for perfectionists with deadlines.
-
 Laravel
A PHP framework for web artisans
-
D3
Bring data to life with SVG, Canvas and HTML. 📊📈🎉
-
Recommend Topics
-
javascript
JavaScript (JS) is a lightweight interpreted programming language with first-class functions.
-
web
Some thing interesting about web. New door for the world.
-
server
A server is a program made to process requests and deliver data to clients.
-
Machine learning
Machine learning is a way of modeling and interpreting data that allows a piece of software to respond intelligently.
-
Visualization
Some thing interesting about visualization, use data art
-
Game
Some thing interesting about game, make everyone happy.
Recommend Org
-
Facebook
We are working to build community through open source technology. NB: members must have two-factor auth.
-
Microsoft
Open source projects and samples from Microsoft.
-
Google
Google ❤️ Open Source for everyone.
-
Alibaba
Alibaba Open Source for everyone
-
D3
Data-Driven Documents codes.
-
Tencent
China tencent open source team.
from decoupler-py.