Comments (20)
 kwcckw
commented on May 29, 2024
2
kwcckw
commented on May 29, 2024
2
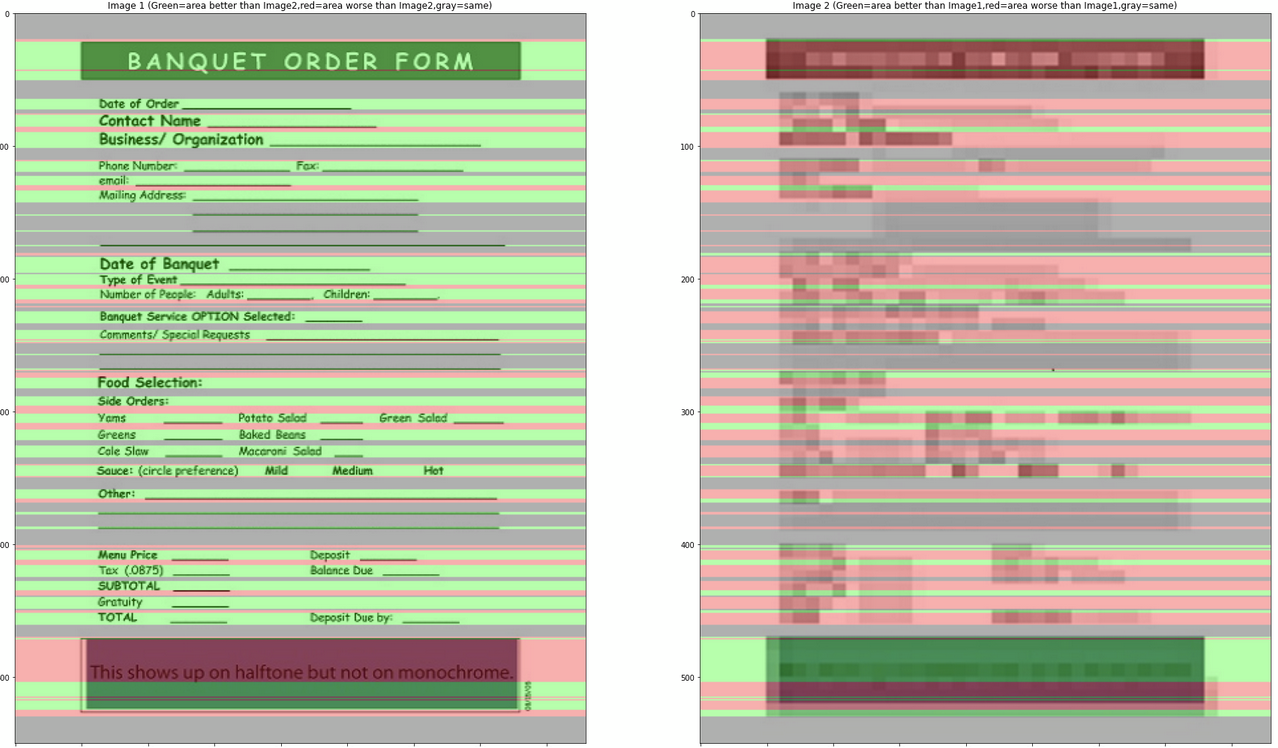
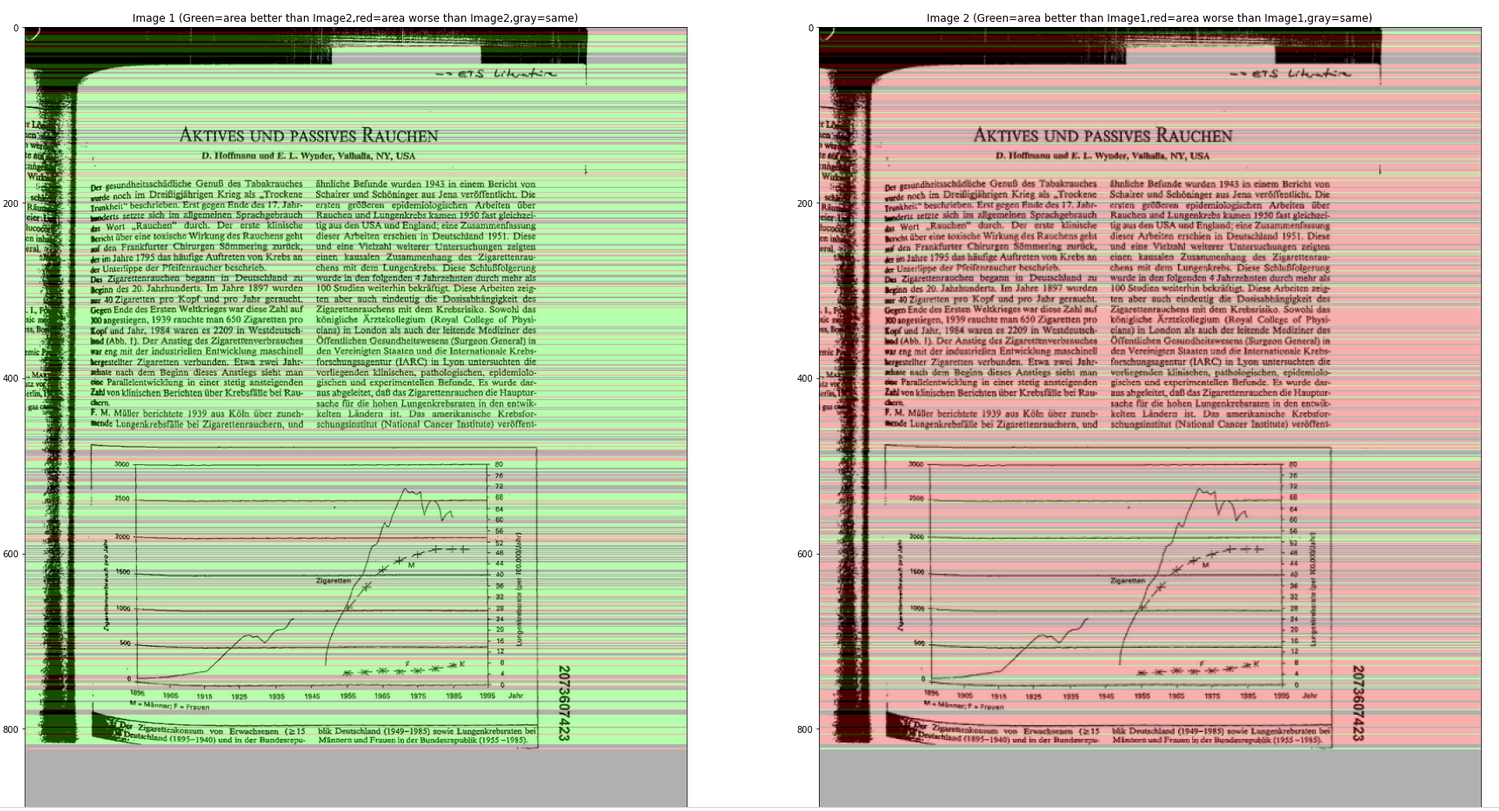
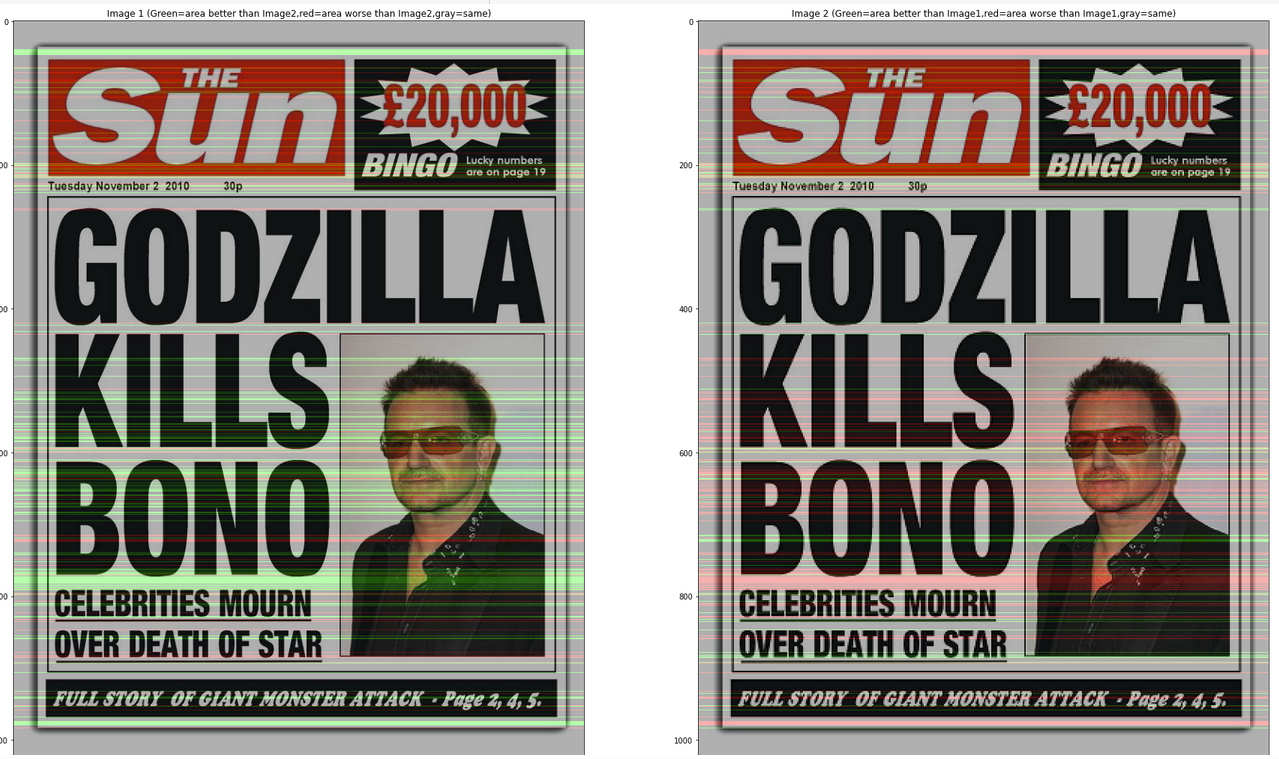
I updated the notebook, now it shows histograms and images to show comparison area, where
green area = area better than the other image
red area = area worse than the other image
gray area = same
from augraphy.
kwcckw
commented on May 29, 2024
1
@kwcckw I saw you're working on #68 - could you also work on this one?
Here's @jboarman's idea for how to start:
- apply Otsu binarization
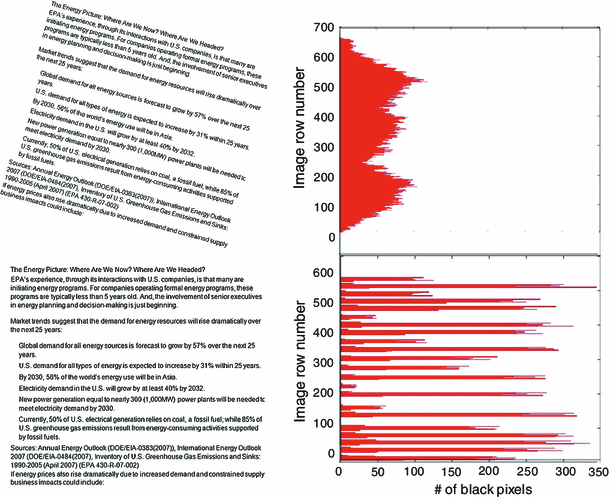
- do a horizontal scan of every line in the image, counting the length of each segment of consecutive black (1s in numpy array); increment counter within a summary array using the index to respectively represent a given length (see this run-length encoding implementation for an easy NumPy solution: https://stackoverflow.com/a/32681075/764307)
- review array counts visually via a histogram -- then, compare histograms across a number of documents of known/suspected resolutions to assess whether a predictable pattern emerges
I tried this but ran into an index out of bounds bug in the
ia[i]call, and I'm really bad at thinking about arrays, so I need your help.
Sure, i will check on the link and try it later.
from augraphy.
 proofconstruction
commented on May 29, 2024
1
proofconstruction
commented on May 29, 2024
1
We now have a way to download images from Figshare.
from augraphy.
proofconstruction
commented on May 29, 2024
1
This should be 300DPI.
from augraphy.
 jboarman
commented on May 29, 2024
1
jboarman
commented on May 29, 2024
1
This stackoverflow post may offer some insight into additional measures that could be used to infer dpi:
Finding strokewidth in the image
https://stackoverflow.com/questions/22425545/stroke-width-transform-opencv-using-python
from augraphy.
jboarman
commented on May 29, 2024
1
Another similar concept to consider whenever we get back to this issue:
https://link.springer.com/article/10.1007/s10032-014-0230-y
from augraphy.
jboarman
commented on May 29, 2024
1
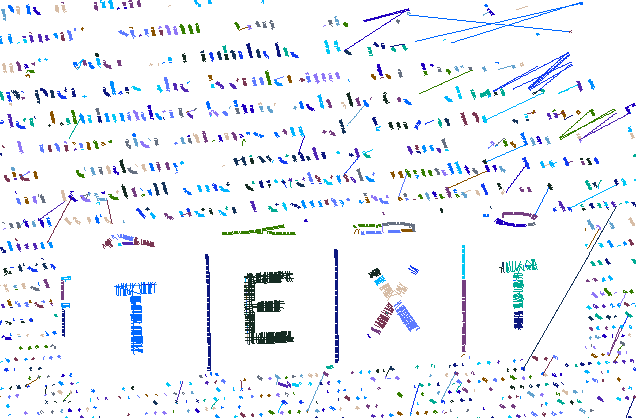
Stroke Width Transform (SWT)
This technique, which seems to have been originally designed to locate text in a scene or document, may have some application here if we can use a small sampling technique to apply this on a few small patches of the document. The number of samples and their size just need to be large enough to be representative.
https://github.com/sunsided/stroke-width-transform
from augraphy.
proofconstruction
commented on May 29, 2024
@kwcckw I saw you're working on #68 - could you also work on this one?
Here's @jboarman's idea for how to start:
- apply Otsu binarization
- do a horizontal scan of every line in the image, counting the length of each segment of consecutive black (1s in numpy array); increment counter within a summary array using the index to respectively represent a given length (see this run-length encoding implementation for an easy NumPy solution: https://stackoverflow.com/a/32681075/764307)
- review array counts visually via a histogram -- then, compare histograms across a number of documents of known/suspected resolutions to assess whether a predictable pattern emerges
I tried this but ran into an index out of bounds bug in the ia[i] call, and I'm really bad at thinking about arrays, so I need your help.
from augraphy.
kwcckw
commented on May 29, 2024
I added an example here:
https://colab.research.google.com/drive/1OQ_AKllfnwd_K6R53lUICqVhKd8SjCpS?usp=sharing
The idea is to compare image1 to image2 using histogram of their black & white sequence length per line, then we generate a score, where:
score<0.5 = image2 is better than image1
score>0.5 = image1 is better than image2
score=0.5 = same
from augraphy.
jboarman
commented on May 29, 2024
Awesome! That’s interesting. Can you add a step to the notebook that shows a histogram created by counting each occurrence of the rle values? This will be important when analyzing a larger sample of documents in the event that the shape or cut off patterns may emerge.
Also, we should try connecting a zip file posted on figshare or even gdown to a shared google drive folder where we can loop through a large set of images and display them along with other metadata about the image (file size, dimension, score, histogram, etc).
from augraphy.
proofconstruction
commented on May 29, 2024
Also, we should try connecting a zip file posted on figshare
Working on this
from augraphy.
kwcckw
commented on May 29, 2024
Awesome! That’s interesting. Can you add a step to the notebook that shows a histogram created by counting each occurrence of the rle values? This will be important when analyzing a larger sample of documents in the event that the shape or cut off patterns may emerge.
Yea, that is feasible, i will include that in the next update. Also i'm still thinking on a better method to compare images with different size, either we resize one of them (making the smaller image larger) or we may need extrapolate those computed values, but for now i think we can resize one of them and test first.
from augraphy.
jboarman
commented on May 29, 2024
I updated the notebook, now it shows histograms and images to show comparison area
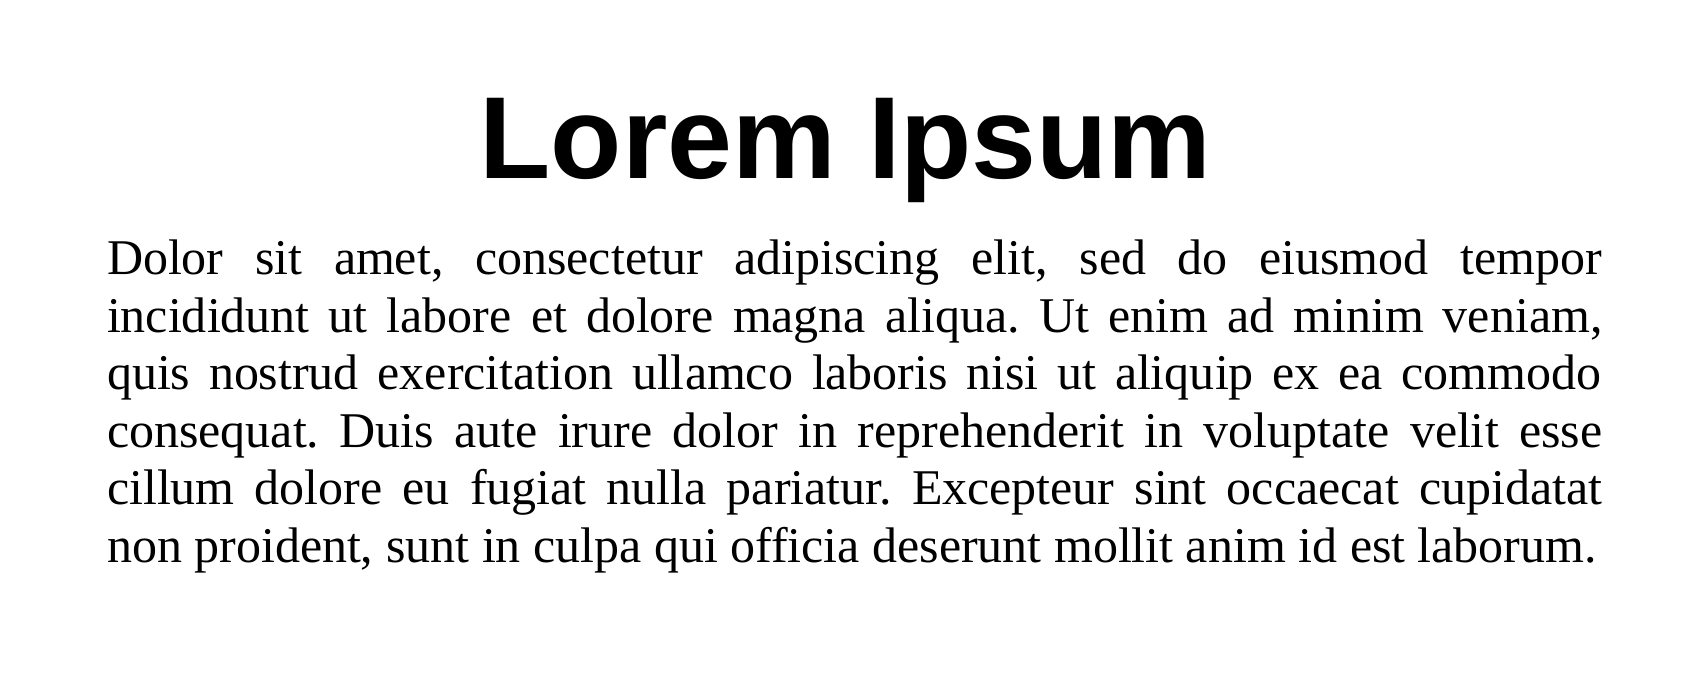
Nice work ... this looks impressive! To compare image resolutions, I think the image on the left should be the original and the image on the right should be a downsampled version of that same image. For example, instead of using the "bad" version that is downloaded, we would just resize the 1st image to 50% of the original so that we are comparing the same image at 100% and 50% sizes.
I'll be very interested to see this displayed across a number of different images from our set of random document images.
from augraphy.
kwcckw
commented on May 29, 2024
I updated the notebook, now it shows histograms and images to show comparison area
Nice work ... this looks impressive! To compare image resolutions, I think the image on the left should be the original and the image on the right should be a downsampled version of that same image. For example, instead of using the "bad" version that is downloaded, we would just resize the 1st image to 50% of the original so that we are comparing the same image at 100% and 50% sizes.
I'll be very interested to see this displayed across a number of different images from our set of random document images.
I changed the example and updated the code a bit, now it's showing result from original image and their scaled down image, so far the result looks good:
(left = original image, right = 75% scaled down), Score=0.8486312399355878
(left = 75% scaled down, right = 50% scaled down), Score=0.836864406779661
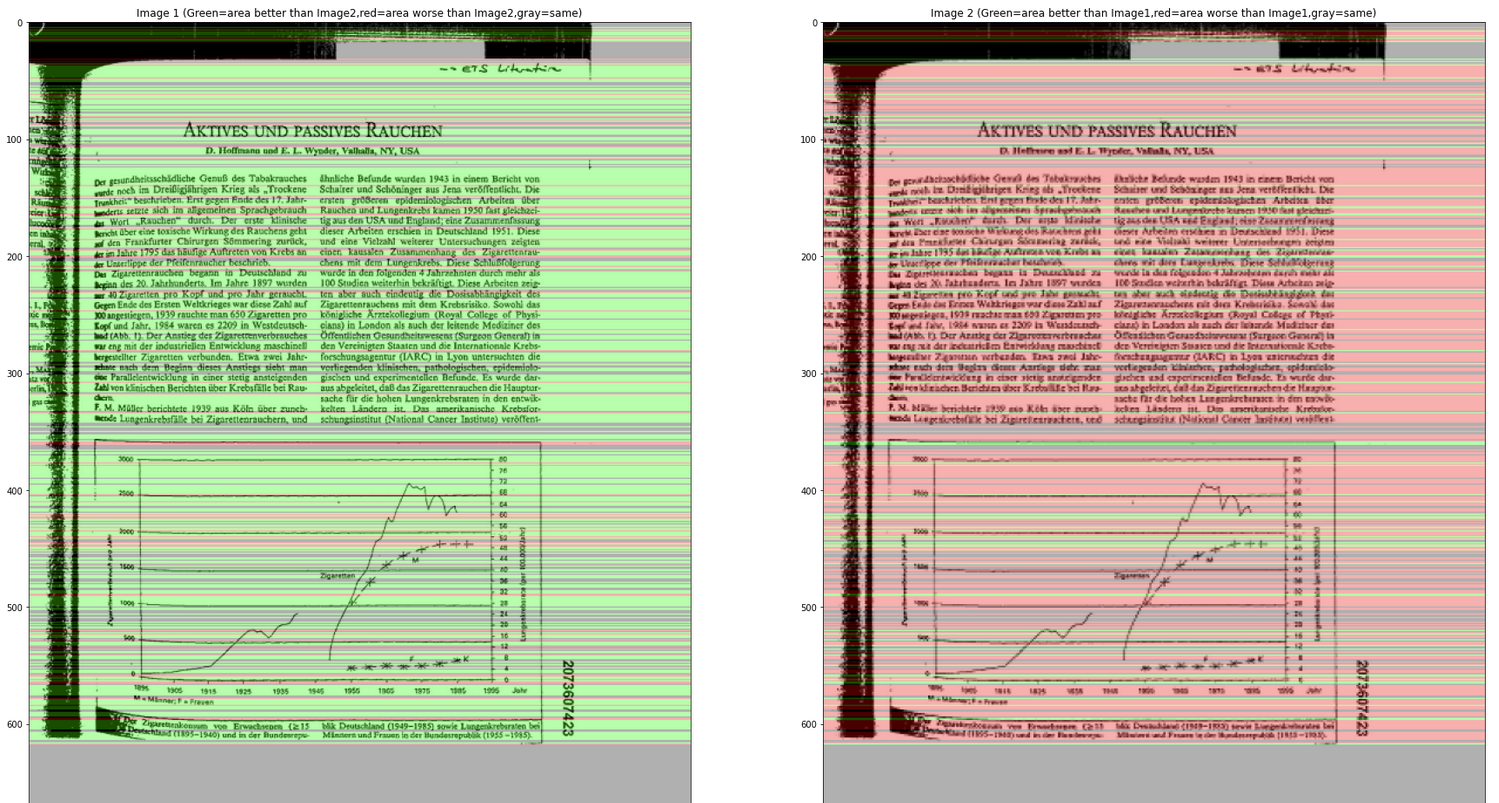
(left = original image, right = 50% scaled down), Score=0.7114427860696517
For the next step, i think we can proceed to try with some benchmark images to compare them and estimate their dpi.
from augraphy.
kwcckw
commented on May 29, 2024
@proofconstruction so i think we can include this in utilities folder?
from augraphy.
proofconstruction
commented on May 29, 2024
Can this predict the DPI of an image?
from augraphy.
kwcckw
commented on May 29, 2024
Can this predict the DPI of an image?
Theoretically yes, but i haven't test until that stage yet. So given an image with known DPI, we can estimate the DPI of input image by using their score. If score= 0.5, DPI = same, while if score = 1, DPI = 2 times the known DPI. At this moment, do you have any sample image from your end with known DPI?
from augraphy.
kwcckw
commented on May 29, 2024
This should be 300DPI.
Thanks, i briefly tried it just now, it seems when the images size are varied too much, the current algorithm doesn't work so well to get a consistent estimated DPI, probably is due to i resized one of the image. At this point, do you have any suggestion on this constraint? (You may view the notebook again to see the DPI score).
Additionally, do you have another image with known DPI? So that i can compare both of them to get an estimated DPI and check with the known DPI value?
from augraphy.
jboarman
commented on May 29, 2024
We will need to get a sample of various clean PDFs that can be printed and scanned at varying resolutions. Once we have that, then we will need to plot the values to see how well they correlate to DPI. It may turn out that a whole predictive model is needed to consider many factors for a reasonable DPI estimation.
Given that this may entail plenty of effort, we may want to defer this until we have completed other exercises needed to launch and promote V4 of Augraphy. Until then, we should probably suggest that input documents be prestandardized to a specific DPI for which augmentations are optimized.
from augraphy.
kwcckw
commented on May 29, 2024
Okay, then i think input image should be at least 300 dpi for now, that's the minimum requirement for medium resolution images.
from augraphy.
Related Issues (20)
- No module named 'sklearn' HOT 2
- issues in training with augmentations HOT 6
- Improve Performance on Letterpress and Other Augmentations Relying on Noise Generation HOT 2
- Bleedthrough cv2 resize issue HOT 2
- rel and dev branches out of sync HOT 3
- Invalid cast in Dithering HOT 1
- OpenCV error in Bleedthrough HOT 6
- Pipeline fails on cached images HOT 4
- Callable pipeline HOT 2
- Develop Augmentations that Simulate Images Taken by Camera Phone HOT 1
- Add Pattern-based Distortion Generator HOT 6
- Add `InkShifter` Augmentation to Shift Ink Pixels Randomly and Follow Background Shadows
- Add Wrinkled, Crumpled Paper Augmentation HOT 1
- Create Utility Function for Exposing Underlying Pixel Colors
- Empty Pipeline lowers image quality HOT 12
- Add Augmentation for Shadows Cast onto Camera-Sourced Document Images HOT 1
- Create Baseline Performance Benchmark; Apply Initial Optimizations Using Numba HOT 2
- Create Example Using Dataloader for PyTorch and TensorFlow HOT 1
- Add Python 3.11 Support, Drop Python 3.7 HOT 2
- Images Broken in PyPI Listing HOT 2
Recommend Projects
-
 React
React
A declarative, efficient, and flexible JavaScript library for building user interfaces.
-
Vue.js
🖖 Vue.js is a progressive, incrementally-adoptable JavaScript framework for building UI on the web.
-
 Typescript
TypeScript is a superset of JavaScript that compiles to clean JavaScript output.
-
TensorFlow
An Open Source Machine Learning Framework for Everyone
-
Django
The Web framework for perfectionists with deadlines.
-
 Laravel
A PHP framework for web artisans
-
D3
Bring data to life with SVG, Canvas and HTML. 📊📈🎉
-
Recommend Topics
-
javascript
JavaScript (JS) is a lightweight interpreted programming language with first-class functions.
-
web
Some thing interesting about web. New door for the world.
-
server
A server is a program made to process requests and deliver data to clients.
-
Machine learning
Machine learning is a way of modeling and interpreting data that allows a piece of software to respond intelligently.
-
Visualization
Some thing interesting about visualization, use data art
-
Game
Some thing interesting about game, make everyone happy.
Recommend Org
-
Facebook
We are working to build community through open source technology. NB: members must have two-factor auth.
-
Microsoft
Open source projects and samples from Microsoft.
-
Google
Google ❤️ Open Source for everyone.
-
Alibaba
Alibaba Open Source for everyone
-
D3
Data-Driven Documents codes.
-
Tencent
China tencent open source team.
from augraphy.