Comments (7)
Okay so after spending a lot of time searching and experimenting with the chart because the Docs and API wasn't helping at all, I discovered a very simple way to change the default color of the line/column chart, without using the getSeriesStyle and getDatumStyle, just simple add the color property on your data.
const data = React.useMemo(
    () => [
      {
        label: 'Series 1',
        data: [
          { primary: 'Oct', secondary: 10 },
        ],
        color: '#1f77b4'
      },
      {
        label: 'Series 2',
        data: [
          { primary: 'Oct', secondary: 5 },
        ],
        color: '#ff7f0e'
      },
      {
        label: 'Series 3',
        data: [
          { primary: 'Oct', secondary: 7 },
        ],
        color: '#ffff4d'
      }
    ],
    []
  )
hope this helps.
from react-charts.
For those trying to do this in v3.0.0 with a bar graph or something you can use defaultColors option with array of colors like so...
<Chart
	options={{
		defaultColors: [ '#00ccff', '#008800', '#ddaacc', /*Array of colors*/ ],
		data,
		primaryAxis,
		secondaryAxes,
	}}
/>
from react-charts.
Here's how I added styled to my chart:
function MyChart({}) {
  const { data } = useChartConfig({
    height: 200,
    grouping: "primary",
    dataType: "ordinal",
  });

  const getSeriesStyle = React.useCallback((series) => {
    // Based off my chart bars
    const colorPalette = {
      series1: "#354657",
      series2: "#5597e2",
      series3: "#28A96C",
      series4: "#d44401",
      series5: "#ffe65b",
      series6: "#ffab1b",
    };

    return {
      fill: colorPalette[series.label],
    };
  }, []);

  return <Chart data={data} getSeriesStyle={getSeriesStyle} />;
}
I found the docs super confusing and over complicated so I hope this helps.
from react-charts.
Never mind i did not read the documentation in https://react-charts.js.org/#/story/custom-styles
from react-charts.
I just noticed that i cant change the default color is there any way to change it? for example in a pie chart with 1 Series and i want to change the default color..
from react-charts.
getSeriesStyle={getSeriesStyle}
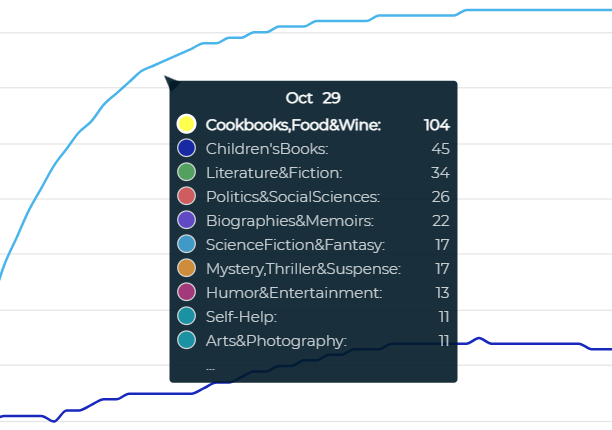
Hello, I tried your code, it did changed the color of the Series (Yellow), but what I want is the line color, any idea?
from react-charts.
For those trying to do this in v3.0.0 with a bar graph or something you can use
defaultColorsoption with array of colors like so...<Chart options={{ defaultColors: [ '#00ccff', '#008800', '#ddaacc', /*Array of colors*/ ], data, primaryAxis, secondaryAxes, }} />
Can I use it with line or area charts? Also can you please tell which index represents which element? I want to set the fill, points, line colors
from react-charts.
Related Issues (20)
- removed typos from docs
- Fix dependency vulnerability d3-color < 3.1.0 HOT 2
- Disable interaction with an UserSerie
- Support tickCount for X axis
- Constant secondary axis doesn't show bars HOT 1
- Data is not correctly displayed when stacked HOT 1
- Tooltip issue HOT 8
- Label for axis HOT 1
- [Important] d3-color Vulnerability issue. d3-scale dependency update required HOT 1
- MultipleAxes Issue HOT 1
- TypeError: Cannot read properties of undefined (reading 'Chart') HOT 1
- Vertical bar not showing in Bar - 3.0.0-beta.55 HOT 2
- Still supported? HOT 3
- Error: require() of ES Module [...] `buildAxis.linear.js` not supported. HOT 6
- `bar` element type doesn't show properly when axis value is a date HOT 1
- candlestick?
- Anyway to set the maxValue for x axis in the Horizontal Bar chart ?
- Unable to change font size, other styles
- How to style primaryCursor and SecondryCursor lines
- Update Copywrite year
Recommend Projects
-
 React
React
A declarative, efficient, and flexible JavaScript library for building user interfaces.
-
Vue.js
🖖 Vue.js is a progressive, incrementally-adoptable JavaScript framework for building UI on the web.
-
 Typescript
TypeScript is a superset of JavaScript that compiles to clean JavaScript output.
-
TensorFlow
An Open Source Machine Learning Framework for Everyone
-
Django
The Web framework for perfectionists with deadlines.
-
Laravel
A PHP framework for web artisans
-
D3
Bring data to life with SVG, Canvas and HTML. 📊📈🎉
-
Recommend Topics
-
javascript
JavaScript (JS) is a lightweight interpreted programming language with first-class functions.
-
web
Some thing interesting about web. New door for the world.
-
server
A server is a program made to process requests and deliver data to clients.
-
Machine learning
Machine learning is a way of modeling and interpreting data that allows a piece of software to respond intelligently.
-
Visualization
Some thing interesting about visualization, use data art
-
Game
Some thing interesting about game, make everyone happy.
Recommend Org
-
Facebook
We are working to build community through open source technology. NB: members must have two-factor auth.
-
Microsoft
Open source projects and samples from Microsoft.
-
Google
Google ❤️ Open Source for everyone.
-
Alibaba
Alibaba Open Source for everyone
-
D3
Data-Driven Documents codes.
-
Tencent
China tencent open source team.


from react-charts.