Comments (18)
 ismayc
commented on August 28, 2024
1
ismayc
commented on August 28, 2024
1
I think it applies to either, but he does use "observed effect delta*" in his diagram. I think that should be a toggle, especially if we want to overlay the t-distribution approximation. I think Allen isn't a huge fan of approximation parametric distributions.
from infer.
 beanumber
commented on August 28, 2024
beanumber
commented on August 28, 2024
Does it work with approximation (i.e. "theory") methods?
from infer.
ismayc
commented on August 28, 2024
Based on the There Is Only One Test diagram by @andrewpbray , I believe the thought was that hypothesis() would feed visualize() directly for theory-based methods.
from infer.
 andrewpbray
commented on August 28, 2024
andrewpbray
commented on August 28, 2024
This is a good discussion point. These would be the two options for doing, say, a one sample proportion test via an approximation (course we need to decide if we're using the binomial exact for the normal approx):
hypothesize(type = "one prop", params = list(p = .5)) %>%
visualize()hypothesize(type = "one prop", params = list(p = .5)) %>%
calculate(stat = "prop") %>%
visualize()I think the narrative behind the first one is that the specification of then null hypothesis is sufficient to parameterize the sampling distribution. The narrative behind the second is similar but says we still need to calculate the observed statistic to be able to plot it against the sampling distribution. If we used that method, calculate() would be described as calculating the statistic for one or many (observed or generated) data sets.
I'm leaning towards the second implementation. It makes the diagram a bit less satisfying, but seems to do a better job at linking the computational and approximation approaches. It also would provide enough info to swap out the visualize() with pvalue() or however we'll be working that in.
What do you guys think?
from infer.
ismayc
commented on August 28, 2024
Hmm, what about calculate(obs_stat = "prop") in the second implementation to reinforce that we will be plotting the transformed value of the observed statistic in relation to the approximate distribution of the test statistic? Then calculate(stat = "prop") produces the calculation of all of the generated statistics and one could place where the observed statistic falls on that distribution by specifying that value: observed = 0.2; calculate(stat = "prop", observed = obs_prop). I'm just not sure if students will understand what is actually being plotted without this extra argument.
from infer.
andrewpbray
commented on August 28, 2024
That's an interesting idea. We could also put that as an argument to the following function, so
hypothesize(type = "one prop", p = .5) %>%
visualize(show_obs = TRUE)
TRUE could be the default there, but at least it would make it clear that the main thrust of this pipeline is the generation of the sampling distribution.
I think the downside to this approach is that no where in there are the students calculating the observed statistic themselves. That's kinda a shame since they will know how to do stuff like
mtcars %>%
summarize( stat = mean(am == 1))
One rogue idea here: what would it look like if we just used summarize() instead of our own calculate()? Will that break some of the tight steps-of-inference ecosystem that we're going for here?
from infer.
ismayc
commented on August 28, 2024
It's my opinion that the observed statistic (especially for randomization-based methods) should be calculated outside of the "Only One Test" process we are proposing to ensure that students continue to get practice with group_by and summarize and truly understand what that value represents (it's a key part of the p-value after all). The tricky part (and one big reason why I think this new framework is needed) comes with also including the repetitions via resampling/simulation using group_by and summarize and that's where the code gets harder for students to use and understand.
from infer.
andrewpbray
commented on August 28, 2024
I like this aside: "[the observed statistic] is a key part of the p-value, after all". It has me thinking of something like this:

Where we have visualize(null_stats, obs_stat) and you could do it similarly for p_value().
Pros
- Makes it very clear where the observed stat is coming from.
- Builds on prior practice computing summary stats.
- Might allow us to use
summarize()instead ofcalculate().
Cons
- Will not be able to get the plot or the p-value in a single pipeline (this might not be bad).
- This code is starting to get long.
A thought: it'd be awesome if the only way that they could calculate a p-value was to basically say the definition. Something like:
probability_of(obs_stat, or = "more extreme", if = null_stats)Hopefully we could find something more elegant than that.
from infer.
ismayc
commented on August 28, 2024
I don't think we are going to be able to use just summarize() but instead group_by() with summarize() since we'll frequently need to compute more than just an overall mean but instead the means across multiple groups, say.
I think that there really are three separate processes here. The original Allen Downey diagram maybe makes this a little more clear/maybe not?
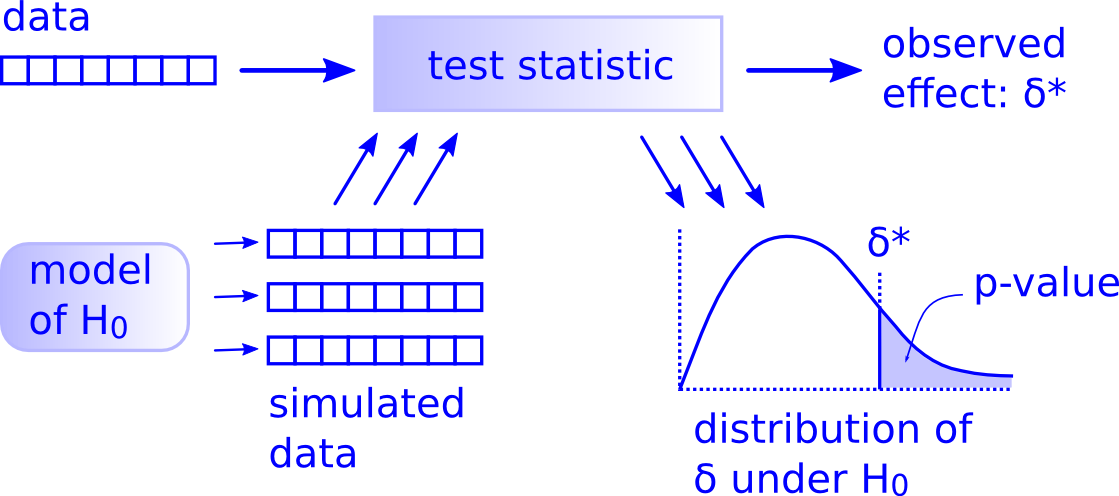
- Determine the observed statistic/effect.
- Simulate the null being true (or assume an approximation)
- Visualize the null distribution/approximation and where the observed stat falls on that distribution (while also noting the direction of "more extreme").
I think 1. is straightforward for students to get. The hard part comes in programming 2 and conceptually for students combining 1-3.
I'd hesitate in having any more than 5 verbs chained together.
I love the idea of having students lay out the definition of the p-value as a call to the function.
from infer.
andrewpbray
commented on August 28, 2024
Good point about those double groupings that were so ugly in the original code. Sounds like calculate() is needed.
Do you know if Allen's deltas are the test statistic or the effect size? I could see arguments in favor of plotting the sampling distribution in the t scale or in the xbar1 - xbar2 scale. My sense from looking at this is that he uses the latter. That could be an option to toggle, I guess, and it seems like it'd best belong to calculate().
from infer.
ismayc
commented on August 28, 2024
Whoofta. I'm gonna have to figure out how to use the new stuff in dplyr since the _ verbs are now deprecated: https://cran.r-project.org/web/packages/dplyr/vignettes/programming.html
In my most recent pull request, I have the code working ONLY for
mtcars %>%
    select(mpg, am) %>%
    hypothesis(null = "equal means") %>%
    generate(reps = 100, type = "permute") %>%
    calculate(stat = "diff in means")

# A tibble: 100 x 2
   replicate    diffmean
       <int>       <dbl>
 1         1 -0.68380567
 2         2 -2.25141700
 3         3  0.24898785
 4         4  4.36882591
 5         5 -2.65303644
 6         6 -2.32914980
 7         7 -0.04898785
 8         8  3.88947368
 9         9  1.84251012
10        10 -0.16558704
# ... with 90 more rows
The null = "equal means" and stat = "diff in means" aren't doing anything yet though.
With the caveat added on the README that discrete/categorical variables were converted to factors in mtcars.
from infer.
ismayc
commented on August 28, 2024
The follow-up pull request has Two Proportions and Two Means implemented as well as a bootstrapped one-sample mean. I'm happy to keep going on this if you all like or I can shift towards working on visualize()?
from infer.
andrewpbray
commented on August 28, 2024
I ran through the two props test - woohoo, it works! The first time, I did it, though, I hadn't done the preliminary bit to shift the mtcars variables to factors. The result was an inability to calculate the proportion by taking the mean of the logical where where calling the levels() function, since the default class doesn't have levels. It just gave me NaNs instead of the proportions.
I'm a little hesitant to make these functions so class-specific, but I can't think of anyway around that right now. We will need to be pretty strict about enforcing that class structure, though, and will probably want to write some informative warning messages if users try to do something like I did.
from infer.
ismayc
commented on August 28, 2024
It wasn't clear to me how else to get this to work without having another argument specifying what the default "success" would be. I agree that it shouldn't be class specific.
I think we should really try to write informative usage messages for all of these functions. I suspect that DataCamp data should further support this when we better understand the mistakes students are making most frequently. The ultimate in assessment power :).
from infer.
 mine-cetinkaya-rundel
commented on August 28, 2024
mine-cetinkaya-rundel
commented on August 28, 2024
My inference function implementation has a success argument. I don't know how else one could do proportion inference, students must be able to specify which is the success.
Then, I think, we can coerce the explanatory variable to factor for proportions, and the function should check that the level specified as success is indeed a valid level of the variable. Feel free to borrow syntax from there.
As for error messages -- the inference function could also be a good place to pick some up from. It's based on a few years of students hitting snags.
from infer.
ismayc
commented on August 28, 2024
Agreed on the success argument. It seems that students will also need to specify which variable is "explanatory" and which is "response" as well, right?
Are you thinking of coercing to factor inside or outside this function?
I am back on the grid now and am happy to look into this further during useR. What is the best way for us to find a time to chat while some of us are in Brussels?
from infer.
 rpruim
commented on August 28, 2024
rpruim
commented on August 28, 2024
You could consider working with logicals rather than factors here.
from infer.
 github-actions
commented on August 28, 2024
github-actions
commented on August 28, 2024
This issue has been automatically locked. If you believe you have found a related problem, please file a new issue (with a reprex: https://reprex.tidyverse.org) and link to this issue.
from infer.
Related Issues (20)
- improve argument checking
- add / polish alt text HOT 1
- infer::observe() conflicts with shiny::observe() HOT 2
- Clarify whether chisq_test is supposed to give same results as base::chisq.test() HOT 2
- Hex logo missing on package homepage HOT 9
- t where it should be p-value in the documentation HOT 2
- How about add a function to run all workflow? HOT 2
- Error in quantile.default(x[[ncol(x)]], probs = (1 + c(-level, level))/2) : missing values and NaN's not allowed if 'na.rm' is FALSE HOT 3
- t-test bootstrapped p-values very different compared to permutation HOT 4
- Null Distribution of SD not Appropriately Calculated HOT 3
- fill = NULL argument not working for shade_ci() HOT 2
- rep_slice_sample on groups with multiple n values HOT 2
- Warnings about aesthetic length and no non-missing argument to min in visualise + shade_p_value functions HOT 5
- snap changes with additional warning context on R-devel HOT 4
- messages on `devtools::document()` HOT 2
- reduce noise in `devtools::test()` HOT 1
- Release infer 1.0.7 HOT 1
- rep_slice_sample unused argument error in vctrs:vec_chop HOT 4
- Change default of permuted p-values according to literature to avoid p-values being 0 HOT 2
- Allow visualize() to give density curve on non theoretical distribution HOT 3
Recommend Projects
-
 React
React
A declarative, efficient, and flexible JavaScript library for building user interfaces.
-
Vue.js
🖖 Vue.js is a progressive, incrementally-adoptable JavaScript framework for building UI on the web.
-
 Typescript
TypeScript is a superset of JavaScript that compiles to clean JavaScript output.
-
TensorFlow
An Open Source Machine Learning Framework for Everyone
-
Django
The Web framework for perfectionists with deadlines.
-
 Laravel
A PHP framework for web artisans
-
D3
Bring data to life with SVG, Canvas and HTML. 📊📈🎉
-
Recommend Topics
-
javascript
JavaScript (JS) is a lightweight interpreted programming language with first-class functions.
-
web
Some thing interesting about web. New door for the world.
-
server
A server is a program made to process requests and deliver data to clients.
-
Machine learning
Machine learning is a way of modeling and interpreting data that allows a piece of software to respond intelligently.
-
Visualization
Some thing interesting about visualization, use data art
-
Game
Some thing interesting about game, make everyone happy.
Recommend Org
-
Facebook
We are working to build community through open source technology. NB: members must have two-factor auth.
-
Microsoft
Open source projects and samples from Microsoft.
-
Google
Google ❤️ Open Source for everyone.
-
Alibaba
Alibaba Open Source for everyone
-
D3
Data-Driven Documents codes.
-
Tencent
China tencent open source team.
from infer.