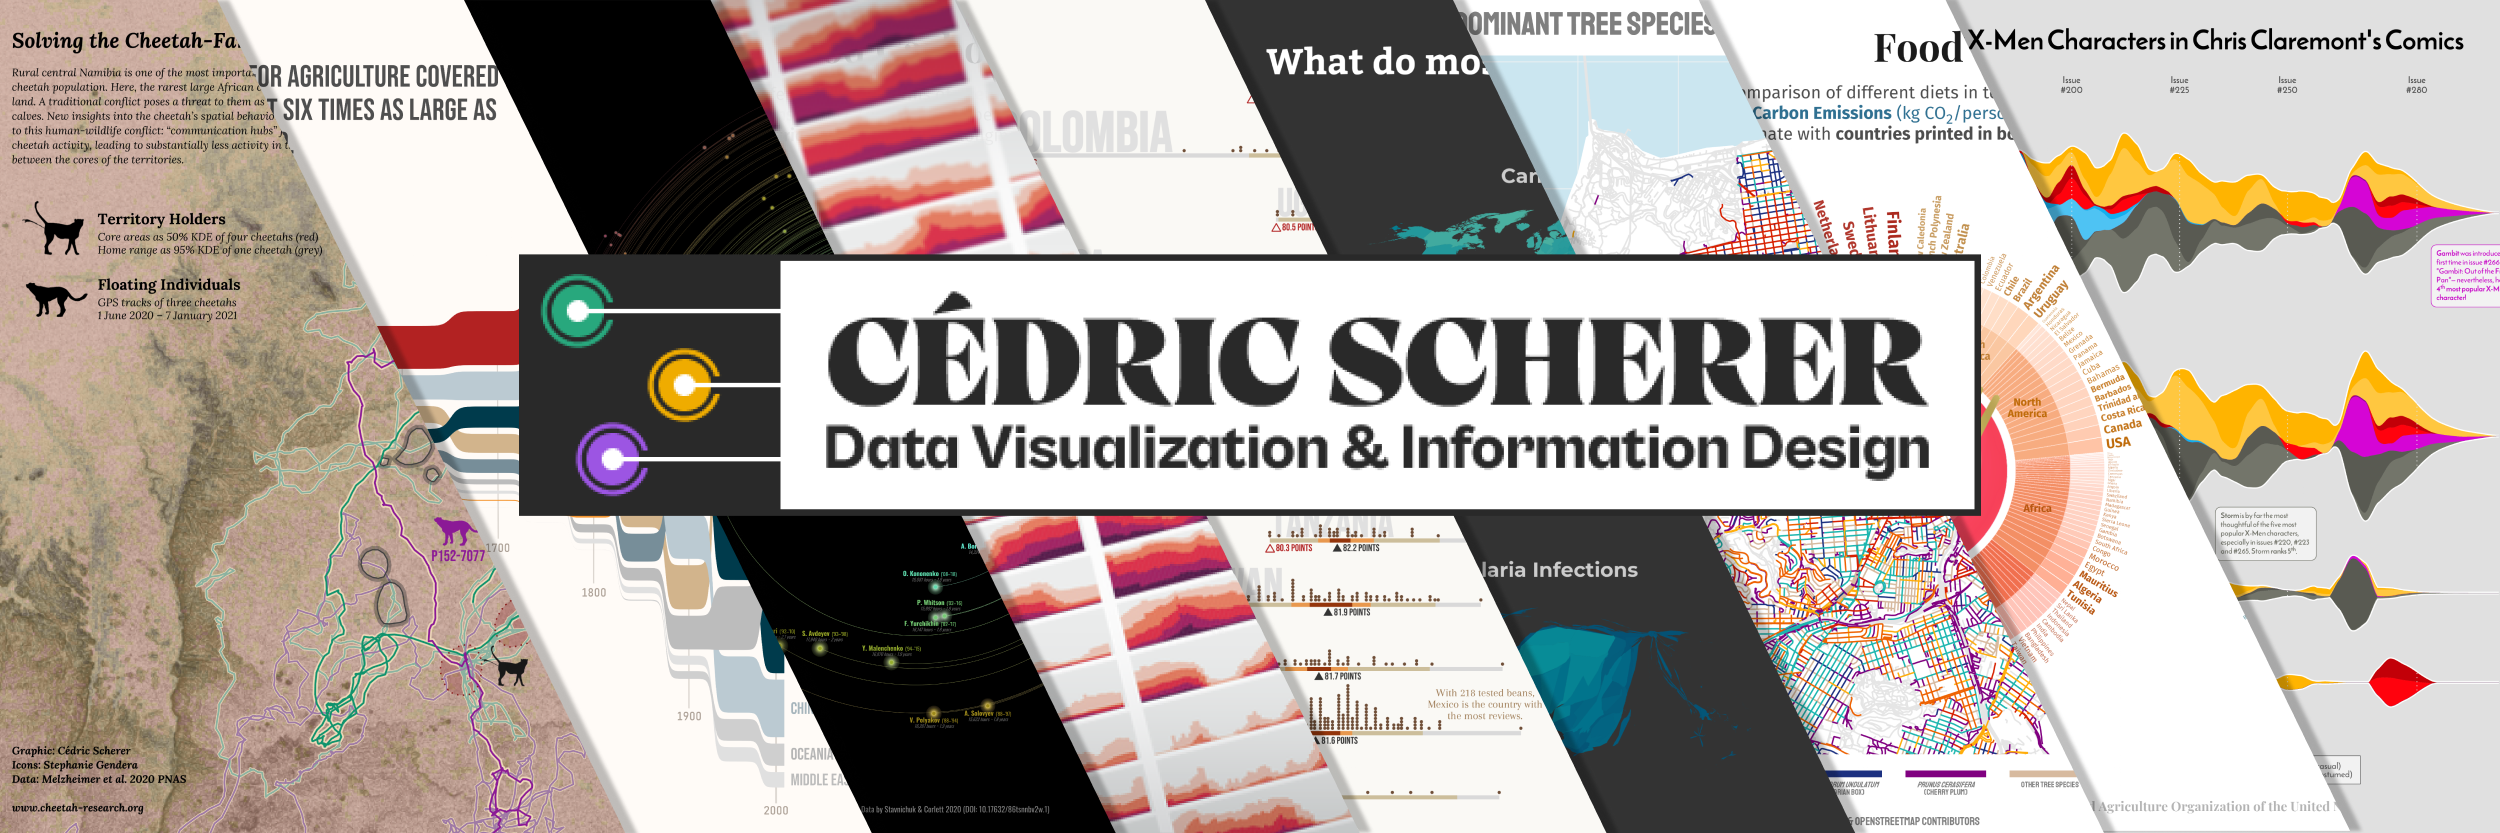


Name: Cédric Scherer
Type: User
Company: Independent Contractor
Bio: Consultant, developer, and instructor for data workflows, analysis, visualization & communication.
Twitter: CedScherer
Location: Berlin
Blog: cedricscherer.com
📊 My contributions to the #30DayChartChallenge 2021
Collection of contributions to and resources for the first #30DayChartChallenge in April 2021
My contributions to the #30DayMapChallenge 2019, a daily challenge focusing on spatial visualizations happening throughout November.
Material for the Pearson × O’Reilly Live Training Session "Hands-On Guide to Advanced Data Visualization with ggplot2: Custom Design"
Making art with R
A curated list of awesome ggplot2 tutorials, packages etc.
A list of awesome interactive journalism projects.
A curated collection of free resources to help deepen your understanding of the R programming language. Updated regularly. Contributions encouraged via pull request (see contributing.md).
"Effective Data Visualization: How to design impactful and aesthetically pleasing charts" by Dr. Cédric Scherer
Slides, recording and hands-on tutorial for the USGS Data Science webinar
Modern, colorful population pyramids for a report published by the "Bundesinstitut für Bevölkerungsforschung" (German Federal Institute for Population Research)
🐆 Solving the Cheetah–Farmer Conflict in Namibia — My Contribution to the BES Movement "MoveMap" Competition 2021
😷 Visualizations showing confirmed daily deaths due to COVID-19 worldwide and per country relative to each's worst day.
Material for the CorrelCon 2020 Advanced Session "Building a modularized Shiny app with the golem 📦 and html widgets"
Contribution to the ESA Little Pictures of Climate Competition 2023
Source for my seminar "(Even More) Exciting Data Visualizations with ggplot2 Extensions"
🦄 tmTheme and rstheme based on the `fairlyfloss` theme
Freedom of Press Index Visualisation
🔎 Keyword Analytics - backlinko.com
Material for the Pearson × O’Reilly Live Training Session "Hands-On Data Visualization with ggplot2: Concepts"
Slides + scripts for the DVS Masterclass
Work-in-progress code and text behind the book "Graphic Design with ggplot2" that is going to be published by CRC Press.
Eine manuell erstellte Kachelkarte der 299 Wahlkreise in Deutschland / A manually designed tile grid map of the 299 constituencies of Germany
Kick-Off Slides for Jon Schwabisch's "R Learning Spring" on Dec 22, 2020
📉 My contributions to the #MakeoverMonday challenge
🗺 Cropped shapefiles for my home district Moabit (Berlin 21)
A declarative, efficient, and flexible JavaScript library for building user interfaces.
🖖 Vue.js is a progressive, incrementally-adoptable JavaScript framework for building UI on the web.
TypeScript is a superset of JavaScript that compiles to clean JavaScript output.
An Open Source Machine Learning Framework for Everyone
The Web framework for perfectionists with deadlines.
A PHP framework for web artisans
Bring data to life with SVG, Canvas and HTML. 📊📈🎉
JavaScript (JS) is a lightweight interpreted programming language with first-class functions.
Some thing interesting about web. New door for the world.
A server is a program made to process requests and deliver data to clients.
Machine learning is a way of modeling and interpreting data that allows a piece of software to respond intelligently.
Some thing interesting about visualization, use data art
Some thing interesting about game, make everyone happy.
We are working to build community through open source technology. NB: members must have two-factor auth.
Open source projects and samples from Microsoft.
Google ❤️ Open Source for everyone.
Alibaba Open Source for everyone
Data-Driven Documents codes.
China tencent open source team.