Giter Site home page Giter Site logo

ant-design-charts's Introduction

Ant Design

An enterprise-class UI design language and React UI library.

CI status codecov NPM version NPM downloads

FOSSA Status

Follow Twitter Renovate status dumi Issues need help

Changelog · Report Bug · Request Feature · English · 中文

✨ Features

  • 🌈 Enterprise-class UI designed for web applications.
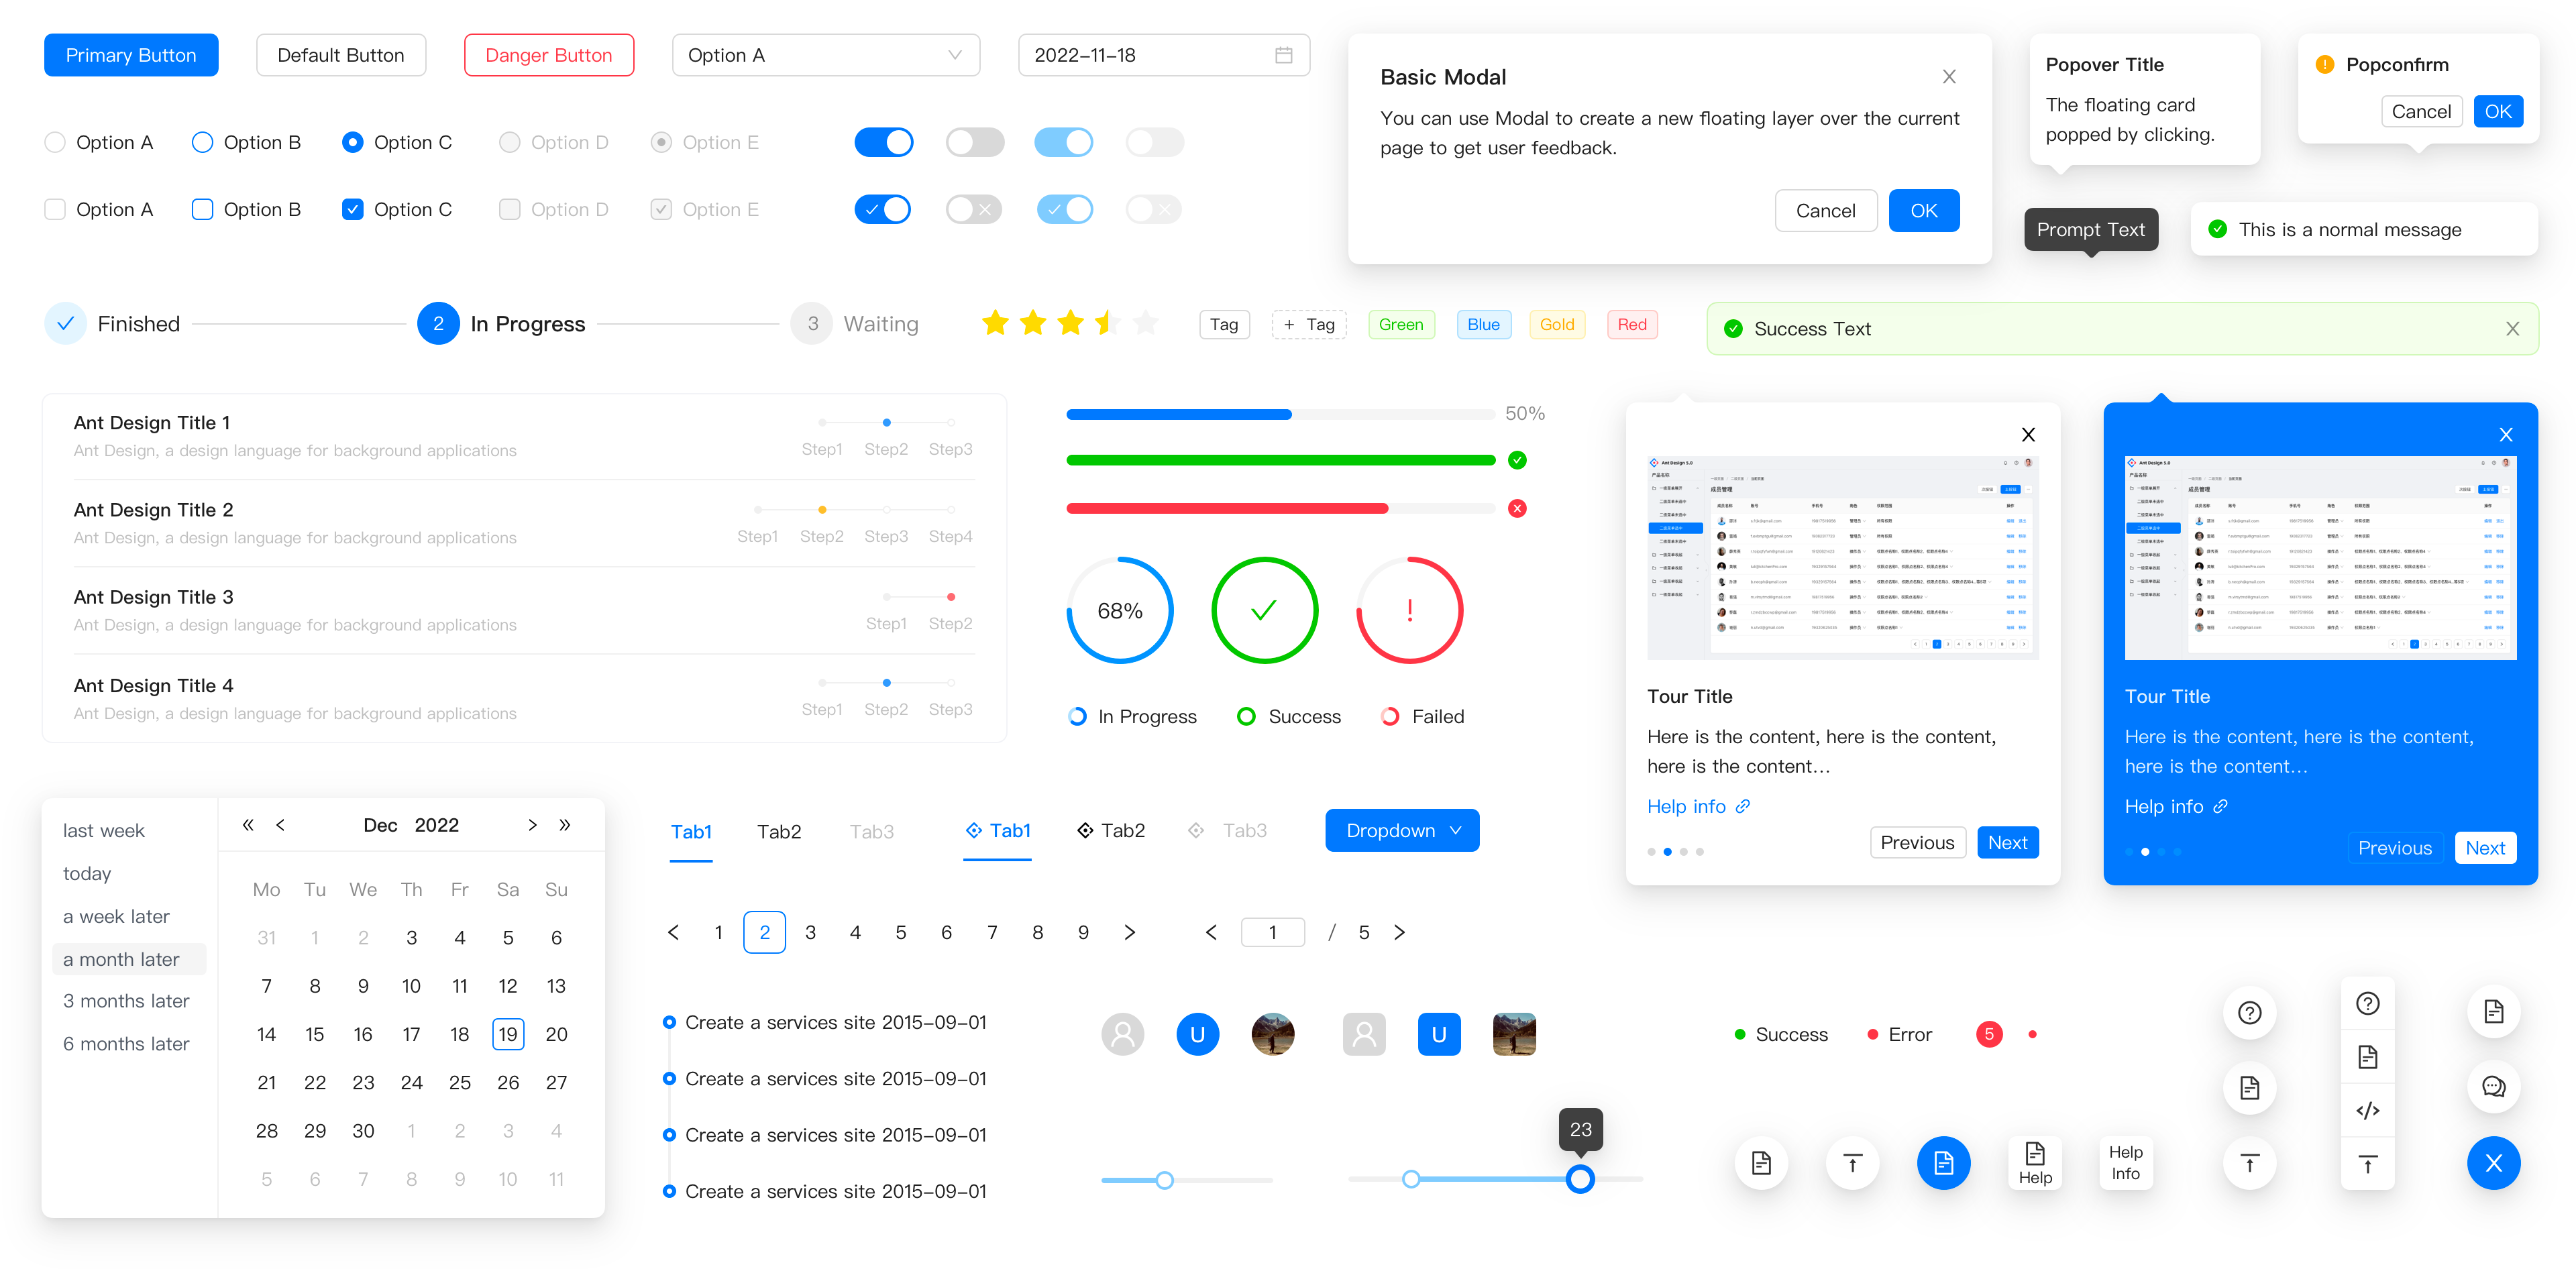
  • 📦 A set of high-quality React components out of the box.
  • 🛡 Written in TypeScript with predictable static types.
  • ⚙️ Whole package of design resources and development tools.
  • 🌍 Internationalization support for dozens of languages.
  • 🎨 Powerful theme customization based on CSS-in-JS.

🖥 Environment Support

  • Modern browsers
  • Server-side Rendering
  • Electron
Edge
Edge
Firefox
Firefox
Chrome
Chrome
Safari
Safari
Electron
Electron
Edge last 2 versions last 2 versions last 2 versions last 2 versions

📦 Install

npm install antd
yarn add antd
pnpm add antd

🔨 Usage

import { Button, DatePicker } from 'antd';

export default () => (
  <>
    <Button type="primary">PRESS ME</Button>
    <DatePicker placeholder="select date" />
  </>
);

🔗 Links

⌨️ Development

Use Gitpod, a free online dev environment for GitHub.

Open in Gitpod

Or use opensumi.run, a free online pure front-end dev environemt.

opensumi.run

Or clone locally:

$ git clone [email protected]:ant-design/ant-design.git
$ cd ant-design
$ npm install
$ npm start

Open your browser and visit http://127.0.0.1:8001 , see more at Development.

🤝 Contributing PRs Welcome

Top Contributors of ant-design/ant-design - Last 28 days Performance Stats of ant-design/ant-design - Last 28 days
New participants of ant-design - past 28 days

Let's build a better antd together.

We warmly invite contributions from everyone. Before you get started, please take a moment to review our Contributing Guide. Feel free to share your ideas through Pull Requests or GitHub Issues. If you're interested in enhancing our codebase, explore the Development Instructions and enjoy your coding journey! :)

For collaborators, adhere to our Pull Request Principle and utilize our Pull Request Template when creating a Pull Request.

Let's fund issues in this repository

❤️ Sponsors and Backers

ant-design-charts's People

Stargazers

 avatar  avatar  avatar  avatar  avatar  avatar  avatar  avatar  avatar  avatar  avatar  avatar  avatar  avatar  avatar  avatar  avatar  avatar  avatar  avatar  avatar  avatar  avatar  avatar  avatar  avatar  avatar  avatar  avatar  avatar  avatar  avatar  avatar  avatar  avatar  avatar  avatar  avatar  avatar  avatar  avatar  avatar  avatar  avatar  avatar  avatar  avatar  avatar  avatar  avatar  avatar  avatar  avatar  avatar  avatar  avatar  avatar  avatar  avatar  avatar  avatar  avatar  avatar  avatar  avatar  avatar  avatar  avatar  avatar  avatar  avatar  avatar  avatar  avatar  avatar  avatar  avatar  avatar  avatar  avatar  avatar  avatar  avatar  avatar  avatar  avatar  avatar  avatar  avatar  avatar  avatar  avatar  avatar  avatar  avatar  avatar  avatar  avatar  avatar  avatar

Watchers

 avatar  avatar  avatar  avatar  avatar  avatar  avatar  avatar  avatar  avatar  avatar  avatar  avatar  avatar  avatar  avatar  avatar  avatar  avatar  avatar  avatar

ant-design-charts's Issues

🐛[BUG] Donut圆环图value为null

🐛 bug 描述

image

📷 复现步骤

仓库:https://github.com/kiwenlau/g2plot-donut-demo
直接运行即可

🏞 期望结果

截屏2020-07-02 上午10 02 50

💻 复现代码

仓库:https://github.com/kiwenlau/g2plot-donut-demo

我用setTimeout模拟了HTTP请求,核心代码如下:

import React, { useEffect, useState } from "react";
import { Donut } from "@ant-design/charts";

const setTimeoutPromise = ms => new Promise(resolve => setTimeout(resolve, ms));

export default function App(props) {
  const [data, setData] = useState([]);
  const { time } = props;

  useEffect(() => {
    const fetchData = async () => {
      const res = await setTimeoutPromise(time).then(() => [
        {
          type: "Google",
          value: 25
        },
        {
          type: "Facebook",
          value: 25
        },
        {
          type: "Alibaba",
          value: 25
        },
        {
          type: "Tencent",
          value: 25
        }
      ]);
      setData(res);
    };
    fetchData();
  }, [time]);

  const config = {
    forceFit: true,
    radius: 0.8,
    data,
    angleField: "value",
    colorField: "type"
  };

  return (
    <div className="App">
      <Donut {...config} />
    </div>
  );
}

© 版本信息

  • ant-design-charts 版本: 0.9.6
  • @antv/g2plot版本:1.1.8
  • 浏览器环境:Chrome
  • 开发环境 macOS

🚑 其他信息

应该是@antv/[email protected]导致的BUG,我通过package-lock.json将@antv/g2plot的版本锁定为1.1.7时就没有问题了

🐛[BUG]tickCount 设成0,页面会崩溃,可以做个参数校验吗

🐛 bug 描述

设置坐标轴无意间设成了0,本来是想20改10的,删了2后触发页面自动刷新,然后整个页面就崩溃了。
后面看了下G2-plot也有这个问题。。。

📷 复现步骤

设置xAxis 的tickCount为0

🏞 期望结果

该tickCount 设置不生效,控制台给出警告信息

© 版本信息

  • ant-design-charts 版本: 0.9.4
  • 浏览器环境Chrome 81.0.4044.138
  • 开发环境 mac OS

🚑 其他信息 [如截图等其他信息可以贴在这里]

打包包错

🧐 问题描述 [详细地描述问题,让大家都能理解]

打包报错信息:
Failed to minify the code from this file:
./node_modules/d3-regression/src/utils/points.js:5

💻 示例代码 [如果有必要,展示代码,线上示例,或仓库]

image

🚑 其他信息 [如截图等其他信息可以贴在这里]

version:0.9.4

Maximum call stack size exceeded

🧐 使用Line时,数据量太大(5w条)导致:Maximum call stack size exceeded

报错如下
scale.js:64 Uncaught RangeError: Maximum call stack size exceeded at trySetScaleMinToZero (scale.js:64) at LineLayer.umi../node_modules/@antv/g2plot/esm/plots/line/layer.js.LineLayer.scale (layer.js:113) at LineLayer.umi../node_modules/@antv/g2plot/esm/base/view-layer.js.ViewLayer.init (view-layer.js:154) at LineLayer.umi../node_modules/@antv/g2plot/esm/base/layer.js.Layer.render (layer.js:61) at LineLayer.umi../node_modules/@antv/g2plot/esm/base/view-layer.js.ViewLayer.render (view-layer.js:210) at plot.js:191 at each (each.js:10) at Line.umi../node_modules/@antv/g2plot/esm/base/plot.js.BasePlot.eachLayer (plot.js:194) at Line.umi../node_modules/@antv/g2plot/esm/base/plot.js.BasePlot.render (plot.js:191) at useChart.js:14 at commitHookEffectList (react-dom.development.js:21997) at commitPassiveHookEffects (react-dom.development.js:22031) at HTMLUnknownElement.callCallback (react-dom.development.js:336) at Object.invokeGuardedCallbackDev (react-dom.development.js:385) at invokeGuardedCallback (react-dom.development.js:440) at flushPassiveEffectsImpl (react-dom.development.js:25350) at unstable_runWithPriority (scheduler.development.js:818) at runWithPriority$2 (react-dom.development.js:12130) at flushPassiveEffects (react-dom.development.js:25319) at react-dom.development.js:25198 at workLoop (scheduler.development.js:762) at flushWork (scheduler.development.js:717) at MessagePort.performWorkUntilDeadline (scheduler.development.js:219)

K线图没有?

🥰 需求描述 [详细地描述需求,让大家都能理解]

🧐 解决方案 [如果你有解决方案,在这里清晰地阐述]

🚑 其他信息 [如截图等其他信息可以贴在这里]

K线图没有?

Heatmap热力图 窗口大小发生变化后,报错🐛[BUG]

🐛 bug 描述 [详细地描述 bug,让大家都能理解]

Heatmap生成热力图之后
image
对浏览器窗口大小进行调整,就会报错
image
固定width和height就不会有这样的报错

📷 复现步骤 [清晰描述复现步骤,让别人也能看到问题]

🏞 期望结果 [描述你原本期望看到的结果]

💻 复现代码 [提供可复现的代码,仓库,或线上示例]

© 版本信息

  • ant-design-charts 版本: [e.g. 0.9.0]
  • 浏览器环境
  • 开发环境 [e.g. mac OS]

🚑 其他信息 [如截图等其他信息可以贴在这里]

想给Bar图添加 一个loading

各位老师,我想给<Bar {...config} />;加一个loading,就是在点击查询按钮后,
bar有个loading的效果,

还请各位老师指点下。谢谢!

🧐[问题]如何以CDN的方式引入?

🧐 问题描述 [详细地描述问题,让大家都能理解]

如何以CDN的方式引入?目前npm包里的lib 与 es 好像都不是我想要的

💻 示例代码 [如果有必要,展示代码,线上示例,或仓库]

🚑 其他信息 [如截图等其他信息可以贴在这里]

使用Heatmap 当xField被解析为时间类型是会崩溃🐛[BUG]

🐛 bug 描述 [详细地描述 bug,让大家都能理解]

类似
data的源是
[{
name: "2020-06-24",
type: "type",
value: 27,
}]
时会报 Uncaught TypeError: Cannot read property 'x' of undefined 的错误

📷 复现步骤 [清晰描述复现步骤,让别人也能看到问题]

🏞 期望结果 [描述你原本期望看到的结果]

💻 复现代码 [提供可复现的代码,仓库,或线上示例]

© 版本信息

  • ant-design-charts 版本: [e.g. 0.9.0]
  • 浏览器环境
  • 开发环境 [e.g. mac OS]

🚑 其他信息 [如截图等其他信息可以贴在这里]

🐛[BUG]yAxis里面的设置参数没有生效

🐛 bug 描述 [详细地描述 bug,让大家都能理解]

yAxis: {
min: 0,
max: 100,
tickCount: 5,
tickInterval: 20
}
想设置纵轴的刻度单位,但是没有生效
且不论设不设置yAxis,折线图的点趋势展示都不正确

📷 复现步骤 [清晰描述复现步骤,让别人也能看到问题]

import React, { useMemo } from 'react';
import { Line } from '@ant-design/charts';

export type MonthlyTrendProps = {
lineProps?: any;
};

const MonthlyTrend: React.FC = props => {

const data = [
{month: 'Jan', score: '20'},
{month: 'Feb', score: '50'},
{month: 'Mar', score: '80'},
{month: 'Apr', score: '70'},
{month: 'May', score: '60'},
{month: 'Jun', score: '40'},
{month: 'Jul', score: '20'},
{month: 'Aug', score: '30'},
{month: 'Sep', score: '40'},
{month: 'Oct', score: '60'},
{month: 'Nov', score: '80'},
{month: 'Dec', score: '90'}
]

const config = useMemo(() => {
return {
data: data,
title: {
visible: true,
text: 'test'
},
xField: 'month',
yField: 'score',
point: {
visible: true,
},
color: '#FA8C16',
yAxis: {
min: 0,
max: 100,
tickCount: 5,
tickInterval: 20
}
}
}, [data])

return <Line {...config} />;
};

export default MonthlyTrend;

🏞 期望结果 [描述你原本期望看到的结果]

Y轴的刻度从0-100,间隔为20展示,整个折线趋势正常展示,而不是后面的数值少的展示的比前面数值多的高

💻 复现代码 [提供可复现的代码,仓库,或线上示例]

© 版本信息

  • ant-design-charts 版本: [0.9.4]
  • 浏览器环境[Chrome]
  • 开发环境 [win10]

🚑 其他信息 [如截图等其他信息可以贴在这里]

👑 [需求] 组件用法讨论

🥰 需求描述 [详细地描述需求,让大家都能理解]

现在 G2Plot 和 antd/charts 的用法是常规的config的形式。

  const config = {
    title: {
      visible: true,
      text: '百分比堆叠面积图',
    },
    data,
    meta: {
      year: {
        range: [0, 1],
      },
    },
    xField: 'year',
    yField: 'value',
    stackField: 'country',
  };
  return <PercentStackedArea {...config} />;

我自己比较不喜欢这种用法,理由有三:
1、config 太长,层级关系阅读起来很凌乱
2、config 与图表脱离,基本上使用的时候全靠复制。
3、同一个 config 里面没有重点,很难直观的体现

🧐 解决方案 [如果你有解决方案,在这里清晰地阐述]

我自己期望的用法是

 return (
    <PercentStackedArea data={data}>
      <Title text="百分比堆叠面积图" />
      <Description text="这是一段图表的描述" />
      <Legend position='botto-left' /> 
    <PercentStackedArea>
)

于是我搞了一个库 alitajs/g2charts#8
文档:https://g2charts.alitajs.com/
有几个我自己比较喜欢的点。
1、增加配置就增加组件,自我感觉比较清晰
2、配置和组件绑定,书写的时候可以联想,还能设置图表的默认值
3、默写有特定作用的配置,比如单行折线图变成多行折线图,配置的时候多了一个拆分字段,这个从阅读文档api的时候,很难体现。
4、组件的使用方式,后续如果需要增加辅助工具或调试工具,只要新建一个组件就能扩展。
5、增加图表标注或者是覆盖物的时候,可以自定义组件。(感觉与第4点重复了)

🚑 其他信息 [如截图等其他信息可以贴在这里]

不知道你们觉得这种设计方式和使用方式如何?

🐛[BUG]

(English hope I am putting the right info at the right place)

🐛 bug 描述 [详细地描述 bug,让大家都能理解]

After installing npm i @ant-design/charts, and creating a Line Chart like this :

import React, {useState, useEffect} from 'react';
import moment from 'moment';

import {Line} from '@ant-design/charts';
import Stat from "../../../utils/models/Stat";
import {StateFromAllReducers} from "../../../redux/store";
import {useSelector} from "react-redux";
import {IntlMessage} from "../../Utils/IntlMessage";

export const NbOfMessages = () => {
    const dataStats: Stat[] = useSelector( (state:StateFromAllReducers) => state.statsManagement.data);
    const [data, setData] = useState<{time: number|string, value:number}[]>([{time: 0, value:0}]);

    const config = {
        data,
        point: {
            visible: true,
        },
        label: {
            visible: true,
            type:'point'
        },
        forceFit: true,
        padding: 'auto',
        xField: 'time',
        xAxis: {
            visible: true,
            line: {
                visible:true
            },

            label: {
                autoHide: true,
                formatter: (v:number) => moment.unix(parseInt(v)).format(format)
            },
        },
        yField: 'value',
        yAxis: {
            visible: true,
            min: 0
        },
        tooltip: {
            domStyles: {'g2-tooltip-title':{display:'none'}},
            formatter: (x:number,y:anumber) => {return {name: moment.unix(parseInt(x)).format(format), value: y } }
        }};

    useEffect( ()=> {
        let tmpData: {time:string|number, value:number}[] =[]; //TODO: check if right initialization
        if (dataStats.length === 0) {
            tmpData = [{time: 0, value:0}]
        }
        dataStats.length > 0 && dataStats.map( (oneStat: Stat) => {
            tmpData= [...tmpData, {time: oneStat.date, value: oneStat.total.messages }]
        });
        setData(tmpData);
    }, [dataStats]);

    return (
        <div>
            <Line {...config} />
        </div>
    )
};

When running code, al lot of those kind of errors appears.

./node_modules/@antv/component/esm/axis/overlap/auto-ellipsis.js
Module Warning (from ./node_modules/source-map-loader/index.js):(Emitted value instead of an instance of Error) 
Cannot find source file '../../../src/axis/overlap/auto-ellipsis.ts': 
Error: Can't resolve '../../../src/axis/overlap/auto-ellipsis.ts' in '<...>\@antv\component\esm\axis\overlap'

./node_modules/@antv/component/esm/axis/overlap/auto-hide.js
Module Warning (from ./node_modules/source-map-loader/index.js):(Emitted value instead of an instance of Error) 
Cannot find source file '../../../src/axis/overlap/auto-hide.ts': 
Error: Can't resolve '../../../src/axis/overlap/auto-hide.ts' in '<...>\@antv\component\esm\axis\overlap'

./node_modules/@antv/component/esm/axis/overlap/auto-rotate.js
Module Warning (from ./node_modules/source-map-loader/index.js):(Emitted value instead of an instance of Error) 
Cannot find source file '../../../src/axis/overlap/auto-rotate.ts': 
Error: Can't resolve '../../../src/axis/overlap/auto-rotate.ts' in '<...>\@antv\component\esm\axis\overlap'

./node_modules/@antv/component/esm/axis/overlap/index.js
Module Warning (from ./node_modules/source-map-loader/index.js):(Emitted value instead of an instance of Error) 
Cannot find source file '../../../src/axis/overlap/index.ts': 
Error: Can't resolve '../../../src/axis/overlap/index.ts' in '<...>\@antv\component\esm\axis\overlap'

./node_modules/@antv/g-svg/esm/shape/marker/index.js
Module Warning (from ./node_modules/source-map-loader/index.js):(Emitted value instead of an instance of Error)
Cannot find source file '../../../src/shape/marker/index.ts':
Error: Can't resolve '../../../src/shape/marker/index.ts' in '<...>\@antv\g-svg\esm\shape\marker'

./node_modules/@antv/g-svg/esm/shape/marker/symbols.js
Module Warning (from ./node_modules/source-map-loader/index.js):(Emitted value instead of an instance of Error)
Cannot find source file '../../../src/shape/marker/symbols.ts':
Error: Can't resolve '../../../src/shape/marker/symbols.ts' in '<...>\@antv\g-svg\esm\shape\marker'

./node_modules/@antv/g-canvas/esm/util/in-path/point-in-path.js
Module Warning (from ./node_modules/source-map-loader/index.js):(Emitted value instead of an instance of Error)
Cannot find source file '../../../src/util/in-path/point-in-path.ts':
Error: Can't resolve '../../../src/util/in-path/point-in-path.ts' in '<...>\@antv\g-canvas\esm\util\in-path'

and many more appears in console. Webpack has noted more than 399 warnings.

📷 复现步骤 [清晰描述复现步骤,让别人也能看到问题]

  1. Have installed the ant-design/charts
  2. Create a Chart (here Line)
  3. launch program

🏞 期望结果 [描述你原本期望看到的结果]

No warnings

💻 复现代码 [提供可复现的代码,仓库,或线上示例]

Hard to give as I just created a simple file using a freshly installed lib

© 版本信息

  • ant-design-charts 版本: [e.g. 0.9.0] 0.9.4
  • 浏览器环境 Chrome
  • 开发环境 [e.g. mac OS] Window

🚑 其他信息 [如截图等其他信息可以贴在这里]

I have posted this error on G2Plot
antvis/G2Plot#1129
It might help you with this, though I didn't understand their answer !

文档细节优化

- G2plot
+ G2Plot
  • 中英文之间请加空格。
  • 描述部分去掉句号。

image

🧐[问题]柱状图的事件都不响应

https://antv-g2plot.gitee.io/zh/docs/manual/plots/column#%E5%9B%BE%E5%BD%A2%E6%A0%87%E7%AD%BE%E4%BA%8B%E4%BB%B6

onColumnClick 应该在哪声明,如何声明,我在config里面声明,没有效果

const config = {
title: {
visible: true,
text: '业务分母'
},
forceFit: true,
data: this.state.data,
padding: 'auto',
xField: 'model',
yField: 'count',
xAxis: {
title: {
visible: false
}
},
yAxis: {
title: {
text: "分母数量"
}
},
label: {
visible: true
},
onColumnClick: () => {console.log("eee")},
};

🧐[问题] chartRef和ref使用ts该如何定义?

🧐 问题描述 [详细地描述问题,让大家都能理解]

组件的chartRef和ref的定义好像没有导出,该如何定义?

💻 示例代码 [如果有必要,展示代码,线上示例,或仓库]

🚑 其他信息 [如截图等其他信息可以贴在这里]

Plot both line and scatter on same plot

I am using scatter plot to plot my data. But I need line plot on it as well.

I have been going through g2plots documentation , I have not found a single example where I can plot Scatter and line on same plot.

Please help me out , How can I do that(better if explained with example) ? and also How can I detect click event on points in scatter plot?
scatter plot here

🧐[问题] 仪表盘的statistic.text有问题,数据更新时会闪一下,

🧐 问题描述 [详细地描述问题,让大家都能理解]

仪表盘的statistic.text有问题,数据更新时会闪一下,相应的占用CPU非常高;而我修改title.text就不会闪烁,占用cpu也正常,只是title如何靠仪表盘下方居中?api中只说了3个参数,左中右,而没有靠下?

💻 示例代码 [如果有必要,展示代码,线上示例,或仓库]

🚑 其他信息 [如截图等其他信息可以贴在这里]

🐛[BUG] xAxis:

🐛 bug 描述 [详细地描述 bug,让大家都能理解]

📷 复现步骤 [清晰描述复现步骤,让别人也能看到问题]

🏞 期望结果 [描述你原本期望看到的结果]

💻 复现代码 [提供可复现的代码,仓库,或线上示例]

© 版本信息

  • ant-design-charts 版本: [e.g. 0.9.0]
  • 浏览器环境
  • 开发环境 [e.g. mac OS]

🚑 其他信息 [如截图等其他信息可以贴在这里]

有事件的使用例子吗?🧐[问题]

🧐 问题描述 例如图表的onPlotClick事件.

我在config里添加了onPlotClick: () => {console.log('test')}
但是好像并不生效

💻 示例代码 [如果有必要,展示代码,线上示例,或仓库]

🚑 其他信息 [如截图等其他信息可以贴在这里]

🐛[可优化]默认情况下x轴的标题与坐标轴的单位重合显示

🐛 bug 描述

默认x轴标题会与坐标轴刻度显示重合,可以优化就优化下吧

📷 复现步骤

给x轴设置标题

🏞 期望结果

默认情况下x轴标题与刻度是分开的,不需要手动设置offset。

💻 复现代码

https://codesandbox.io/s/kq0m6?module=/demo.tsx&file=/demo.tsx

© 版本信息

  • ant-design-charts 版本: 0.9.4
  • 浏览器环境 chrome 81.0
  • 开发环境 mac os

🚑 其他信息 [如截图等其他信息可以贴在这里]

image

🧐[问题]

🧐 问题描述 [详细地描述问题,让大家都能理解]

图表中的点击事件,例如柱状图点击事件

onColumnClick:() => console.log('====='),是无法有打印结果的。应该如何使用图表时间

💻 示例代码 [如果有必要,展示代码,线上示例,或仓库]

🚑 其他信息 [如截图等其他信息可以贴在这里]

🧐[问题]基础柱状图-缩略图能否获得slider的取值

🧐 问题描述 [详细地描述问题,让大家都能理解]

基础柱状图-缩略图能否获得slider的取值呢?

💻 示例代码 [如果有必要,展示代码,线上示例,或仓库]

🚑 其他信息 [如截图等其他信息可以贴在这里]

给当前的chart加了ref,但是也没有找到相应的slider值,请大佬指教

tooltip的formatter配置的出参格式

疑问:
关于tooltip的formatter配置的出参格式可选值,文档里不够全。
目前只知道{ name: '', value: '' , title: ''}

补充疑问:
image
tooltips是否支持加配,将后面的百分比另起一行展示( 占比: 50%)
或则是在customContent里自定义?

我想加个点击事件,

image
我想在生成的char上面加个点击事件,官网上没找到什么事件的DEMO,
也不知道住哪里加.

还请各位老师指点下

🧐[问题] 数据data更新的时候会rerender整个图表现为“闪烁”,是否可以只刷新增量数据

🧐 问题描述 [详细地描述问题,让大家都能理解]

在使用Chart的过程中有数据更新的需求, 把数据放在component的state或者是从外部props传入更新, 每次更新所有的值都在rerender。 包括slider插件也会reset。 但是自己封装G2 和 G2Plot 用instence.changeData() 的时候就没有这种问题。

💻 示例代码 [如果有必要,展示代码,线上示例,或仓库]

import React, { Component } from 'react';
import {Button} from 'antd';
import { Line } from '@ant-design/charts';
class Page extends Component {
    constructor(props){
        super(props);
        this.state={
            year:1999,
            value: 15, 
            data: [],
        }
    }
  render() {
    const config = {
      data:this.state.data,
      title: {
        visible: true,
        text: '折线图',
      },
      xField: 'year',
      yField: 'value',
      theme: 'dark'
    };
    return (<div>
        <Line {...config} />
        <Button onClick={()=>{
            let year = this.state.year;
            let value = this.state.value;
            let data = this.state.data;
            year +=1;
            value +=1;
            data.push({year: year, value:value});
            this.setState({
                year: year,
                value: value,
                data: data
            })
        }}>
            ADD POINT
        </Button>
        </div>);
  }
}
export default Page;

请教一下为什么会有这样的问题, 以及如何避免, 谢谢!

官网一些实例跳转错误啊🐛[BUG]

🐛 bug 描述

图表联动
https://charts.ant.design/demos/global#%E5%9B%BE%E8%A1%A8%E8%81%94%E5%8A%A8

📷 复现步骤 [清晰描述复现步骤,让别人也能看到问题]

🏞 期望结果 [描述你原本期望看到的结果]

💻 复现代码 [提供可复现的代码,仓库,或线上示例]

© 版本信息

  • ant-design-charts 版本: [e.g. 0.9.0]
  • 浏览器环境
  • 开发环境 [e.g. mac OS]

🚑 其他信息 [如截图等其他信息可以贴在这里]

🧐[问题]:是否有计划添加**地图呢?

🧐 问题描述 [详细地描述问题,让大家都能理解]

如题,是否有计划添加**地图的图表呢

💻 示例代码 [如果有必要,展示代码,线上示例,或仓库]

🚑 其他信息 [如截图等其他信息可以贴在这里]

如果有计划,别忘了南海诸岛

能否按需加载???

🧐 使用 @ant-design/charts 中的 Line 组件 为什么打出来的包那么大????

💻

import { Line } from '@ant-design/charts';

🚑

这是引入后组件打包之后的大小

image

这是引入之前组件的大小
image

使用折线图时在配置里添加guideLine配置辅助线, 传入一个空数组会直接报错🐛[BUG]

使用折线图时在配置里添加guideLine配置辅助线, 传入一个空数组会直接报错

📷 复现步骤 [清晰描述复现步骤,让别人也能看到问题]

🏞 期望结果 做下效验.

💻 复现代码 https://codesandbox.io/s/reverent-raman-fmw6t?fontsize=14&hidenavigation=1&theme=dark

© 版本信息

  • ant-design-charts 版本: 0.9.4
  • 浏览器环境: edge
  • 开发环境 mac os

🚑 其他信息 [如截图等其他信息可以贴在这里]

Sankey diagram

Hey guys, is there plans to add sankey diagram? I've been struggling to find a way to implement it

Recommend Projects

  • React photo React

    A declarative, efficient, and flexible JavaScript library for building user interfaces.

  • Vue.js photo Vue.js

    🖖 Vue.js is a progressive, incrementally-adoptable JavaScript framework for building UI on the web.

  • Typescript photo Typescript

    TypeScript is a superset of JavaScript that compiles to clean JavaScript output.

  • TensorFlow photo TensorFlow

    An Open Source Machine Learning Framework for Everyone

  • Django photo Django

    The Web framework for perfectionists with deadlines.

  • D3 photo D3

    Bring data to life with SVG, Canvas and HTML. 📊📈🎉

Recommend Topics

  • javascript

    JavaScript (JS) is a lightweight interpreted programming language with first-class functions.

  • web

    Some thing interesting about web. New door for the world.

  • server

    A server is a program made to process requests and deliver data to clients.

  • Machine learning

    Machine learning is a way of modeling and interpreting data that allows a piece of software to respond intelligently.

  • Game

    Some thing interesting about game, make everyone happy.

Recommend Org

  • Facebook photo Facebook

    We are working to build community through open source technology. NB: members must have two-factor auth.

  • Microsoft photo Microsoft

    Open source projects and samples from Microsoft.

  • Google photo Google

    Google ❤️ Open Source for everyone.

  • D3 photo D3

    Data-Driven Documents codes.