Giter Site home page Giter Site logo

microsoft / vscode-edge-devtools Goto Github PK

View Code? Open in Web Editor NEW
733.0 39.0 244.0 41.31 MB

A VSCode extension that allows you to use browser devtools from within the editor. The devtools will connect to an instance of Microsoft Edge giving you the ability to alter CSS styling, perform diagnostics, and debugging. Get it now at http://aka.ms/devtools-for-code

Home Page: https://docs.microsoft.com/microsoft-edge/visual-studio-code/microsoft-edge-devtools-extension

License: MIT License

TypeScript 96.11% CSS 1.07% JavaScript 2.06% HTML 0.76%
visual-studio microsoft-edge-browser developertools

vscode-edge-devtools's Introduction

Microsoft Edge Developer Tools for Visual Studio Code

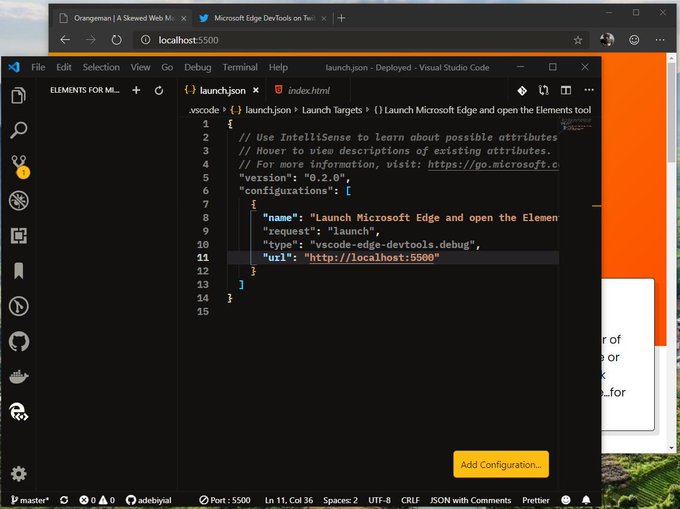
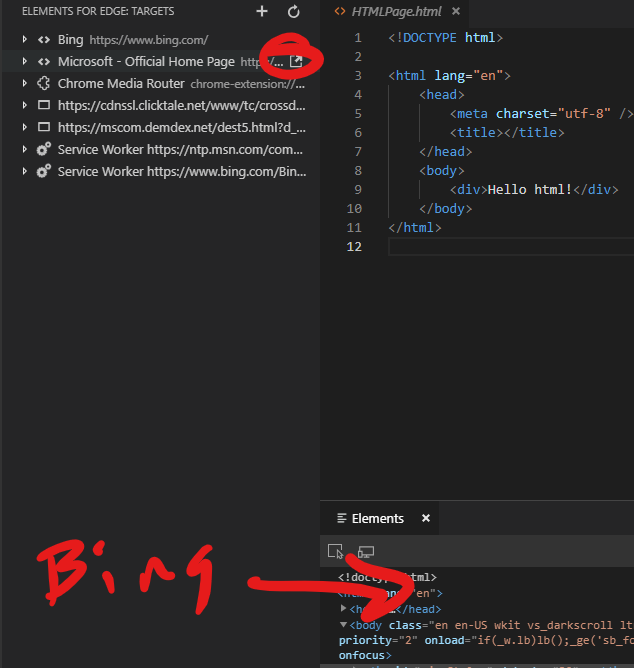
This extension allows you to use the Developer Tools of Microsoft Edge inside Visual Studio Code.

Walkthrough of the extension

Features:

  • Live analysis of issues in your source code - find out about problems while you develop
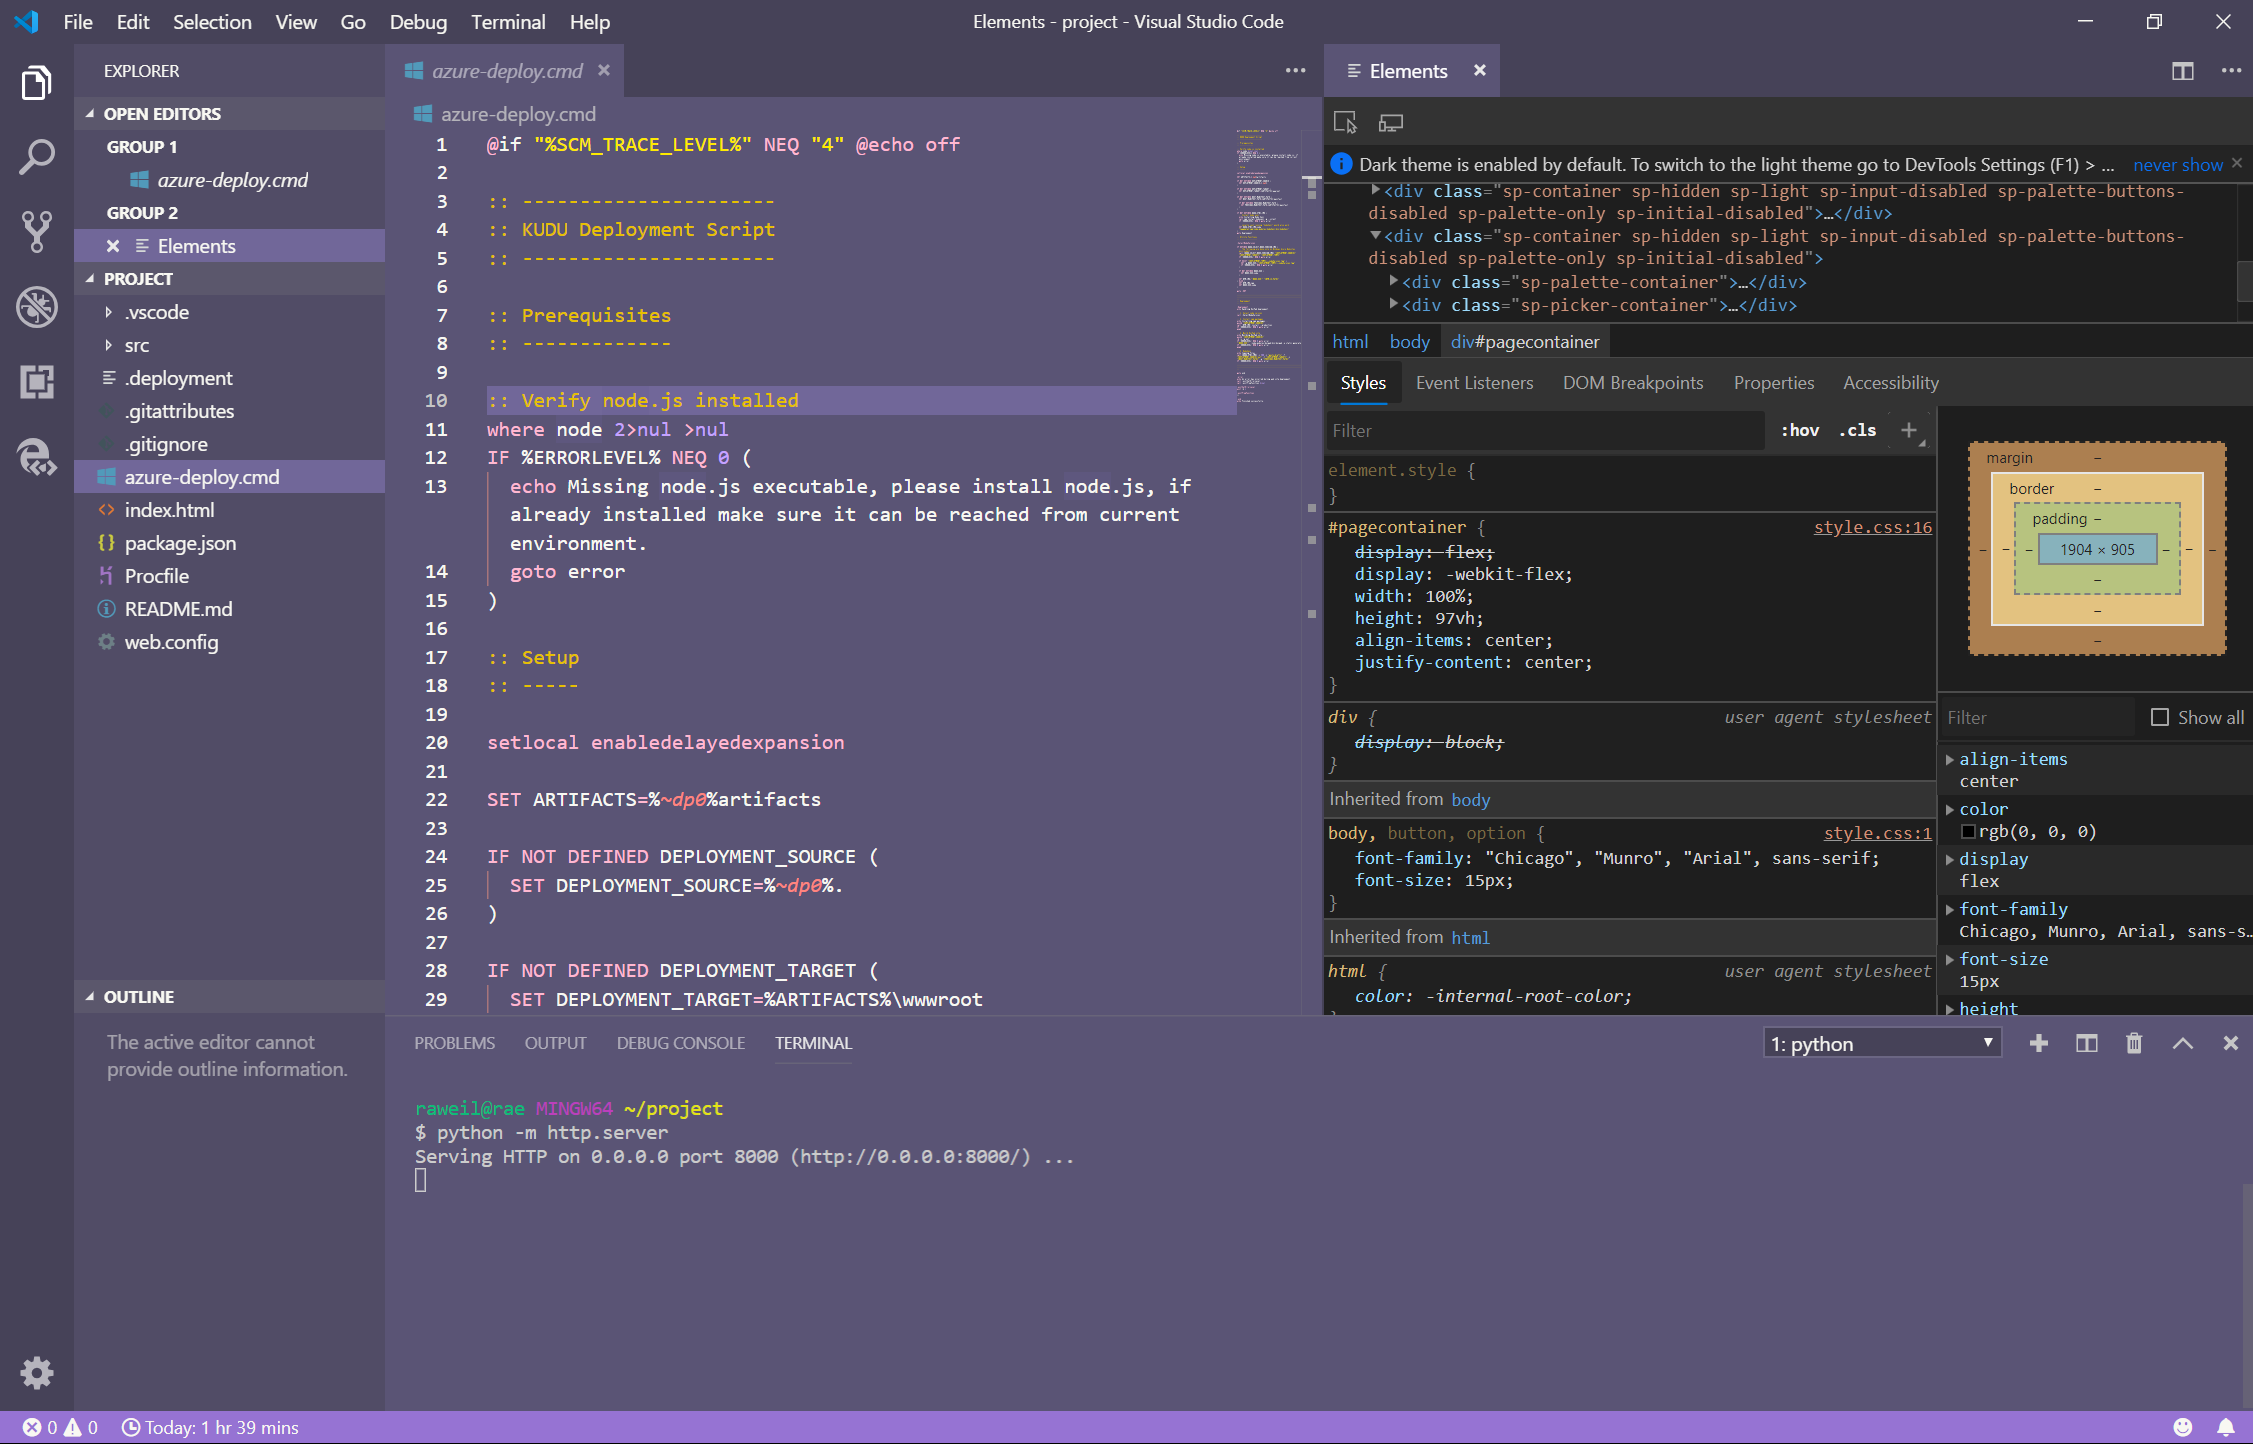
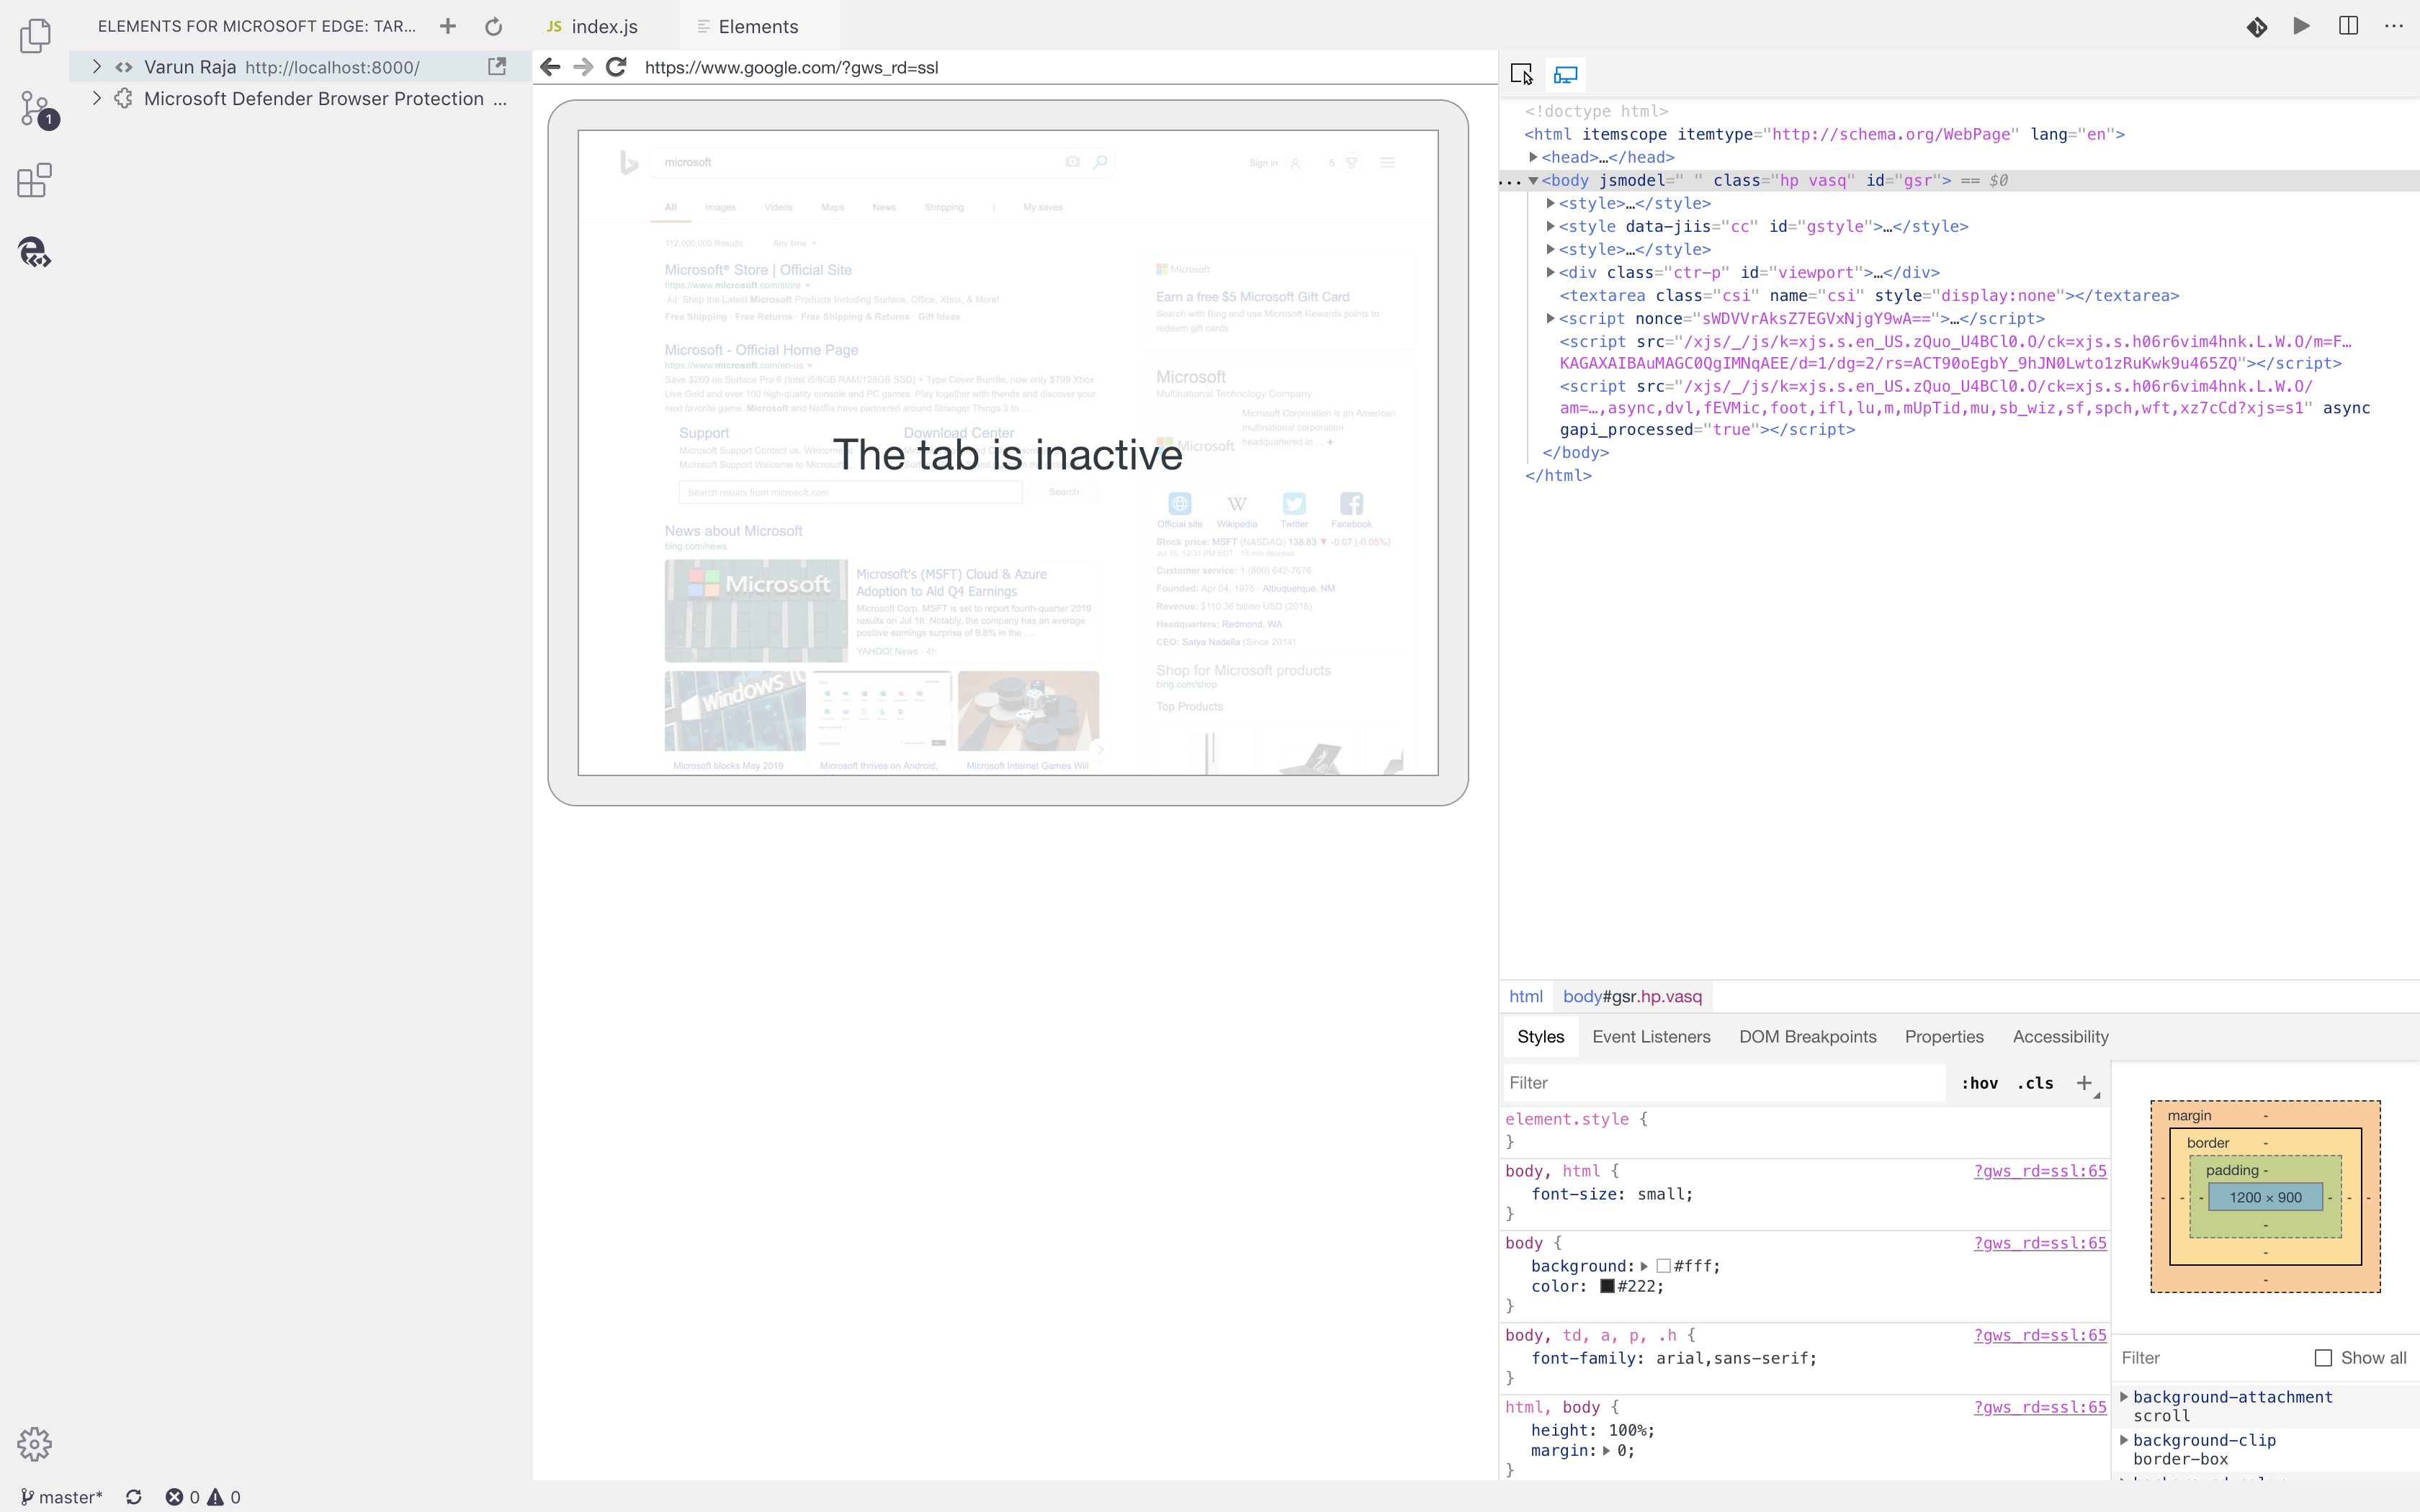
  • Browser preview with built in toolbar for device and mode emulation
  • Changes in the Styles tool sync live with your source code - including abstractions like Sass and React using Sourcemaps
  • Console and Application tool
  • Breakpoint support

Note: This extension needs Microsoft Edge to be on your computer. Windows machines already come with it, for Mac and Linux, please download and install a version of Edge.

Documentation

For more details on how to use and customize the extension, refer to the documentation.

Contributing

This project welcomes contributions and suggestions. Most contributions require you to agree to a Contributor License Agreement (CLA) declaring that you have the right to, and actually do, grant us the rights to use your contribution. For details, visit https://cla.microsoft.com.

See CONTRIBUTING.md for more information.

Other information

Data and Telemetry

The extension gets data and telemetry from Visual Studio code we use to improve the product. If you don't want to allow this, you can find the instructions how to turn off telemetry in the Visual Studio Code documentation

Data Collection. The software may collect information about you and your use of the software and send it to Microsoft. Microsoft may use this information to provide services and improve our products and services. You may turn off the telemetry as described in the repository. There are also some features in the software that may enable you and Microsoft to collect data from users of your applications. If you use these features, you must comply with applicable law, including providing appropriate notices to users of your applications together with a copy of Microsoft’s privacy statement. Our privacy statement is located at https://go.microsoft.com/fwlink/?LinkID=824704. You can learn more about data collection and use in the help documentation and our privacy statement. Your use of the software operates as your consent to these practices.

Reporting Security Issues

Security issues and bugs should be reported privately, via email, to the Microsoft Security Response Center (MSRC) at [email protected]. You should receive a response within 24 hours. If for some reason you do not, please follow up via email to ensure we received your original message. Further information, including the MSRC PGP key, can be found in the Security TechCenter.

vscode-edge-devtools's People

Contributors

38elements avatar 50wliu avatar aaronpowell avatar antross avatar bgoddar avatar bwalderman avatar captainbrosset avatar codepo8 avatar dependabot[bot] avatar elormcoch avatar fabiorocha avatar flynnolivia avatar gp5251 avatar hkal avatar hxlnt avatar jackjlynch avatar jalissia avatar jasonstephen15 avatar lucasoe avatar maxgubler avatar micahgodbolt avatar microsoft-github-policy-service[bot] avatar microsoftopensource avatar mikehoffms avatar msftgits avatar natashalee avatar stagas avatar tony-xia avatar vidorteg avatar

Stargazers

 avatar  avatar  avatar  avatar  avatar  avatar  avatar  avatar  avatar  avatar  avatar  avatar  avatar  avatar  avatar  avatar  avatar  avatar  avatar  avatar  avatar  avatar  avatar  avatar  avatar  avatar  avatar  avatar  avatar  avatar  avatar  avatar  avatar  avatar  avatar  avatar  avatar  avatar  avatar  avatar  avatar  avatar  avatar  avatar  avatar  avatar  avatar  avatar  avatar  avatar  avatar  avatar  avatar  avatar  avatar  avatar  avatar  avatar  avatar  avatar  avatar  avatar  avatar  avatar  avatar  avatar  avatar  avatar  avatar  avatar  avatar  avatar  avatar  avatar  avatar  avatar  avatar  avatar  avatar  avatar  avatar  avatar  avatar  avatar  avatar  avatar  avatar  avatar  avatar  avatar  avatar  avatar  avatar  avatar  avatar  avatar  avatar  avatar  avatar  avatar

Watchers

 avatar  avatar  avatar  avatar  avatar  avatar  avatar  avatar  avatar  avatar  avatar  avatar  avatar  avatar  avatar  avatar  avatar  avatar  avatar  avatar  avatar  avatar  avatar  avatar  avatar  avatar  avatar  avatar  avatar  avatar  avatar  avatar  avatar  avatar  avatar  avatar  avatar  avatar  avatar

vscode-edge-devtools's Issues

Cannot set port in launch config

You should be able to specify the port (and other settings) via the debug configurations rather than in the extension settings. This would match the behavior of other debug type extensions.

E.g.:

{
  "type": "vscode-edge-devtools.debug",
  "request": "launch",
  "name": "Launch Edge and open the Elements tool",
  "url": "http://localhost:3000",
  "port": 9333,
  "hostname": "localhost"
}

Stylesheet links path is almost correct.

On #100 it is reported that:
"the path on hover is almost correct, the only problem is that it starts with "localhost:4200/", everything after that is the correct path, so it seems like it wouldn't be tough to get the path itself"

Some comments from @jalissia :
This should be possible. The fact that is isn't working suggests that you need to update the pathMapping property (either in the launch.json, or the VS Code settings for the Elements extension - depending on how you are attaching).

If the path in the tooltip after "localhost:4200/" is the full path to the file, it probably means you need something like this:

"pathMapping": {
"/": ""
}
Which means it will replace everything before the first slash (localhost:4200 in your case) with an empty string. So something like localhost:4200/c/path/to/my/file.sass will become c/path/to/my/file.sass which VS Code should be able to open.

If the path after localhost:4200 is more of a relative path to the file you can use something like:

"pathMapping": {
"/": "${workspaceFolder}"
}
so that it will prepend your workspace path before the relative part of the sass file path in the tooltip.

Unfortunately we don't have any good logging yet to help you figure out path mapping issues like these, but it is definitely something I want to add.

`Elements for Microsoft Edge: Attach to a target` command does nothing

I've been trying to figure out how to attach Elements to my running browser instance launched by Debugger for Edge.

The existing docs aren't helping and the "Elements for Microsoft Edge: Attach to a target" command does nothing except put up an unproductive edit field. I expect that, according to the docs, it will put up a dropdown allowing me to select the browser instance to which to attach.

Contributing.md contains out of date instructions

There are references to the old DevTools directory e.g.
mkdir c:\edgeoss\src\third_party\blink\renderer\devtools\front_end

These should be cleaned up and we should point to the new directory instead.

Webview does not set a content security policy

Hi, I'm the developer of VS Code's webview API. I noticed that your extension seems to create a webview that does not set a content security policy. All webviews (even very simple ones) should set a content security policy. This helps limit the potential impact of content injections and is generally a good measure for defense in depth.

We've documented how to add a content security policy to VS Code webviews here. Please add the most restrictive content security policy possible to your webview. I am not aware of any immediate security issues with your extension but having a restrictive content security policy is important to help protect users of your extension.


Also note that in development mode, in VS Code 1.38 you should also see a warning if you create a webview that does not set a content security policy: microsoft/vscode#79248

Please support none-IDE mode

alter layout, and fix styling issues. All without leaving VS Code.

That made me cry a little. Many users of VS Code like it to be an editor, not an IDE. I personally don't see a reason why VS Code should replicate the contents of a website in a tiny embedded widget and from my experience I am not the only user that thinks like this.

So, please consider a none-IDE integration along the full IDE mode. In my ideal world it would work like this:

  • Show browser-things in the browser, e.g the elements tab, the performance tools etc
  • Show source code in VS Code, e.g when I select styles.scss inside dev tools, then open that file in VS Code. If picking a color updates a file, do that with VS Code (there is API for all of that)

I hope all of that makes sense, feel free to get in touch with me, and in case a none-IDE integration already exists please ignore this. Anyways please don't forget those VS Code users that like pressing Alt/Cmd-Tab and that like OS window managers, they do exist.

Add inspect element and related shortcuts to vscode

From #22
"I assume the devtools shortcuts don't work when they aren't focused, so you couldn't hit ctrl+shift+c while you're in the editor to inspect an element. Should we expose that and whatever other actions are relevant to Elements here so that vs code can define/handle shortcuts for them?"

We could add the ability to use the devtools shortcuts from the rest of vscode.

Side Panel does not auto refresh

When I close a tab in the Edge Browser and I've closed the Elements Tool, the closed tab stays in the Target list. I have to manually press the refresh button to get an updated list of tabs that I can target. It would be great to have this auto-refresh as tabs are added and removed.
image

Accessibility pane is empty

Repro step:

  1. Visit bing.com in Edge browser.
  2. Click Accessibility pane

Expected: Accessiblity Tree, ARIA Attributes, Computed Properties to be displayed as in Edge DevTool.
Actual: Accessibility pane is empty

No UI to get the in-tool Elements settings

In order to toggle in-tool Element settings you need to press F1. There's no UI to bring them up.
image

Possibly we could migrate the settings to the VS Code extension settings instead.

Add infrastructure to test Edge DevTools code integration

Right now all the tests only run against the extension half of the project.

Ideally the test infrastructure would also be able to download/build the opensource version of the Edge DevTools and run integration tests against there, to check things like the post build step patching, etc.

See comments in: #72

Error: Couldn't attach to about:blank

Tried extension with a React app and an Angular app running in VScode Version 1.36.0-insider (1.36.0-insider) via npm script explorer. Edge Version 77.0.204.0 (Official build) Canary (64-bit) alrady running, displaying the app.

Click sidebar icon for Edge Elements, click the plus icon.

A new tab opens in Edge, but all I get is this:

Screen Shot 2019-06-28 at 12 23 26 PM

Allow modifiying cursor style

When using "Elements" tab the cursor transforms to a dot which is not very precise.
Moreover, when debugging desktop versions you may want to check the cursor styles when hovering buttons or any other action that changes cursor style.

It should be an option to use default cursor instead of this dot cursor.

Screencast for Electron app in WSL is not working properly

Scenario: debugging an Electron application running in WSL, with an X server running in Windows.

Debugging the main Electron process works just fine - however, trying to attach the Elements extension to the renderer process yields flaky results - the visible rendered page is black, until the dev tools pane is closed.
The behaviour is consistent even when the Electron app is started without the developer tools pane opened.

Hnet-image

clipboard functionality isn't working

As of right now, it is seemingly impossible to use the clipboard to copy for exemple styles from elements into code, which is a bummer as it stands :/

webRoot attribute in launch.json configuration

So when I use the Debugger for Edge VS Code extension, my launch config looks like:

      {
            "type": "edge",
            "request": "launch",
            "version": "canary",
            "name": "Launch Edge",
            "url": "http://localhost:8080",
            "webRoot": "${workspaceFolder}"
        }

We use the webRoot attribute to point to the directory that files are served from. It can be either an absolute path or a path using ${workspaceFolder} (the folder open in Code). webRoot is used to resolve urls (like "http://localhost/app.js") to a file on disk (like /Users/me/project/app.js).

Please add the webRoot property so that I don't have to think about different launch.json configs for my 2 Edge extensions.

Please adopt the new extensionKind attribute

As of VS Code 1.40 the extensionKind attribute in the package.json of the extension can be an array, pls see the documentation.

We will be deprecating the string type for extensionKind property in favour of string array type.

The extensionKind attribute should be set to ["ui"]. Indicating that the extension must run as a 'ui' extension, since it requires access to the local browser.

You can only have one instance of the Elements Tool open at a time

When I have two tabs open with --remote-debugging enabled, I can only connect the Elements Tool to one tab at a time. I have to close the Elements tool in VS Code, selected the next tab and then it opens against that tab.
image

I can't have two instances of the Elements tool attached to two different tabs at one time.

Unable to connect in remote scenarios

Environment:

  • VS Code stable @ latest
  • Remote - SSH extension @ latest
  • Remote - WSL extension @ latest
  • Edge Chromium on Dev channel @ latest
  • Windows 10 Insiders (18922) with WSL 2 Ubuntu (unlikely but may be related to why this isn't working)

The extension is installed as a UI extension and I'm using the default launch config:

{
  "version": "0.2.0",
  "configurations": [
    {
      "name": "Launch Microsoft Edge and open the Elements tool",
      "request": "launch",
      "type": "vscode-edge-devtools.debug",
      "url": "http://localhost:8080"
    }
  ]
}

Working on a vue.js app.

WSL

  1. Open the integrated terminal and run $ npm run serve to start the app
  2. Launch into the debugger

Result:

The browser launches and loads the page. In VS Code, an empty quick pick shows up along with the following error:

Couldn't attach to http://localhost:8080.
onDidNotificationChange @ workbench.main.js:2379

SSH

I'm using an Azure VM with Ubunt 16.04.

  1. Connect to VM and forward ports 8080 and 9222 to localhost (see below)
  2. Open the integrated terminal and run $ npm run serve to start the app
  3. Launch into the debugger

image

Results in the same behavior as WSL:

The browser launches and loads the page. In VS Code, an empty quick pick shows up along with the following error:

Couldn't attach to http://localhost:8080.
onDidNotificationChange @ workbench.main.js:2379

Feel free to ping me on teams with any questions, I'm happy to help however I can!

Elements extension doesn't work with VS Code update 1.40

It looks like the move to electron 6 (chromium 76) has changed some of the security concepts for the VS Code webview that we are using.

The extension fails to render any content in the webview due to cross domain issues that were not present in the previous version of electron's chromium.

Option to change elements to dark mode

Hi,
I couldn't find an option to make the elements window appear in dark mode. It appeared in the dark mode for me when I started the extension for the first time, then something happened and I have it in light mode now and I rather have it in the dark mode. So I would suggest there be an option or setting to specify the theme. I have tried setting my default theme in my computer as dark, and the theme is dark even in my Edge Dev browser.

Links from Elements tool don't open up my CSS file

I'm working on this project: https://github.com/googlecodelabs/your-first-pwapp and I have a CSS file at Public/styles/inline.css. I use this launch.json config:

        {
            "type": "vscode-edge-devtools.debug",
            "request": "launch",
            "name": "Launch Microsoft Edge and open the Elements tool",
            "url": "http://localhost:8080",
        }

In the Styles pane, I see the correct file and line number. But when I click on it, nothing happens.

image

Please make it so that when I click on a link in the Elements tool, it opens the file and navigates to the line number in VS Code, like it does in the browser Elements tool.

Elements default "attach" behavior with Debuggers

Say you have a debugger like Debugger for Edge extension installed AND the Elements for Edge extension installed. You launch a debugging session, what would you expect the default behavior of the Elements for Edge extension to be?

  1. Would you expect it to auto "attach" using the same settings from the Debugger launch config?
  2. Would you expect that you would have to manually connect the two extensions together some how?
  3. Would you expect that you just use the side panel, find the url that you are actively debugging, and attach the Elements extension that way?

We're curious if folks would be using these types of extensions together most of the time or not and provide the most helpful default experience when they are both installed.

Feedback welcome...
@solankisamir @fiveisprime @hxlnt

New Edge Icon

Is there an Update to change the Icon from Microsoft Edge based on Chromium?

image

image

Recommend Projects

  • React photo React

    A declarative, efficient, and flexible JavaScript library for building user interfaces.

  • Vue.js photo Vue.js

    🖖 Vue.js is a progressive, incrementally-adoptable JavaScript framework for building UI on the web.

  • Typescript photo Typescript

    TypeScript is a superset of JavaScript that compiles to clean JavaScript output.

  • TensorFlow photo TensorFlow

    An Open Source Machine Learning Framework for Everyone

  • Django photo Django

    The Web framework for perfectionists with deadlines.

  • D3 photo D3

    Bring data to life with SVG, Canvas and HTML. 📊📈🎉

Recommend Topics

  • javascript

    JavaScript (JS) is a lightweight interpreted programming language with first-class functions.

  • web

    Some thing interesting about web. New door for the world.

  • server

    A server is a program made to process requests and deliver data to clients.

  • Machine learning

    Machine learning is a way of modeling and interpreting data that allows a piece of software to respond intelligently.

  • Game

    Some thing interesting about game, make everyone happy.

Recommend Org

  • Facebook photo Facebook

    We are working to build community through open source technology. NB: members must have two-factor auth.

  • Microsoft photo Microsoft

    Open source projects and samples from Microsoft.

  • Google photo Google

    Google ❤️ Open Source for everyone.

  • D3 photo D3

    Data-Driven Documents codes.