Giter Site home page Giter Site logo

memplot's Introduction

memplot

A small utility written in golang to quickly plot memory usage of processes. memplot constantly samples memory usage of a process, for a given amount of time and then outputs an image file. Painless and straightforward. Supported image extensions are: .eps, .jpg, .jpeg, .pdf, .png, .svg, .tex, .tif and .tiff

Installation

Binaries for Linux and MacOS are available in the releases page

go get -u -v github.com/0x0f0f0f/memplot/cmd/memplot

Usage

Usage of memplot:
Arguments following options will be interpreted as the command to spawn and sample
  -dur duration
    	total profiling time. a value of 0 means that the program
    	will be sampled until it is no longer running
  -height string
    	plot image height (can be cm or in) (default "12cm")
  -o string
    	output image file name. supported extensions are:
    	.eps, .jpg, .jpeg, .pdf, .png, .svg, .tex, .tif and .tiff
    	(default "output-plot.png")
  -pid int
    	pid of the process to analyze (default -1)
  -sd duration
    	sample size in time (default 5ms)
  -vsz
    	plot virtual size
  -width string
    	plot image width (can be cm or in) (default "16cm")

Example Plot

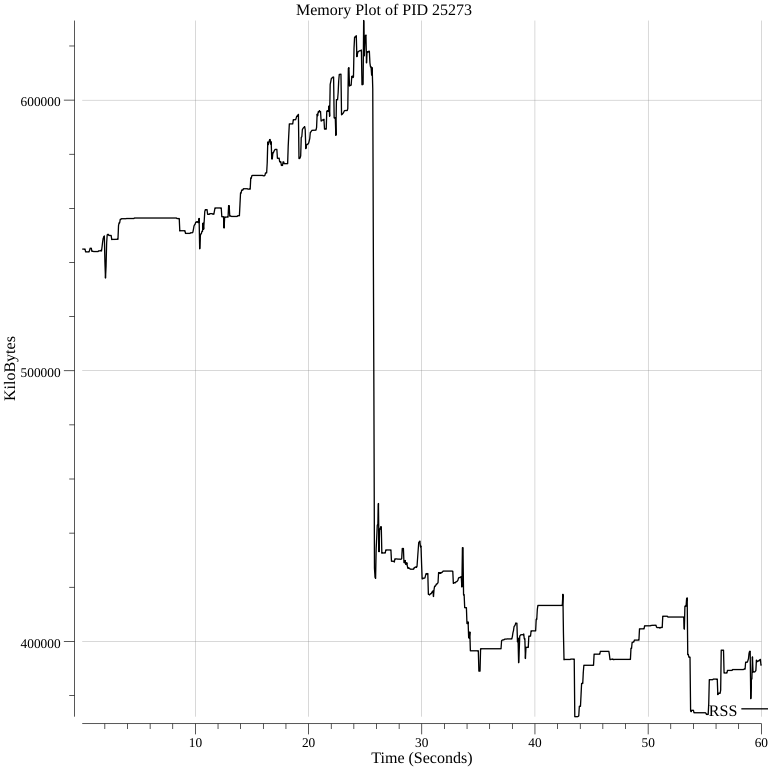
memplot -pid 25273 -width 8in -height 8in -dur 60s -sd 50ms -o plot.png

or

memplot -width 8in -height 8in -dur 60s -sd 50ms -o plot.png firefox

Roadmap

  • Plot other useful values
  • Colors
  • Option to change the font
  • Memory autoscaling
  • Spawn child processes to sample

memplot's People

Contributors

0x0f0f0f avatar

Stargazers

 avatar  avatar  avatar  avatar  avatar  avatar  avatar  avatar  avatar  avatar  avatar  avatar  avatar  avatar  avatar  avatar  avatar  avatar  avatar  avatar  avatar  avatar  avatar  avatar  avatar  avatar  avatar  avatar  avatar  avatar  avatar  avatar  avatar  avatar  avatar  avatar  avatar  avatar  avatar  avatar  avatar  avatar  avatar  avatar  avatar  avatar  avatar  avatar  avatar  avatar  avatar  avatar  avatar  avatar  avatar  avatar  avatar  avatar  avatar  avatar  avatar  avatar  avatar  avatar  avatar  avatar  avatar  avatar  avatar  avatar  avatar  avatar  avatar  avatar  avatar  avatar  avatar  avatar  avatar  avatar  avatar  avatar  avatar  avatar  avatar  avatar  avatar  avatar  avatar  avatar  avatar  avatar  avatar  avatar  avatar  avatar  avatar  avatar  avatar  avatar

Watchers

 avatar  avatar  avatar

memplot's Issues

panic if the spawned command exits with a non-zero exit code

Hey, loving the improvements! The auto-spawning a command makes it much easier to use, and the SVG output option lets you zoom in a let a closer look.

I found a panic though. If the spawned command exits with a non-zero exit code, memplot panics:

panic: exit status 64

goroutine 18 [running]:
main.check(...)
	/home/runner/work/memplot/memplot/cmd/memplot.go:16
main.main.func2(0xc000012090, 0x3, 0x3, 0xc00018e000)
	/home/runner/work/memplot/memplot/cmd/memplot.go:86 +0xfe
created by main.main
	/home/runner/work/memplot/memplot/cmd/memplot.go:80 +0x4e8

Monitoring ends after a random amount of time

This is a second issue I noticed after a few tests of memplot. I initially specified the length of time I expected Python to take to generate an image at my target resolution (~1000s). Memplot ran for about six seconds and then stopped. I thought maybe I had specified too long of a time, so I tried it again with -dur 0. This time it ran for about 220 seconds and then stopped again. Python was still running with the same PID, so I just restarted memplot. I had to run it manually four more times, when it stopped at ~550, 27, and 64 seconds (the last run ended as expected when I terminated python).

MacBook Pro M2 Max 64GB
MacOS 13.4b2

Not detecting full process memory?

I found this project when trying to find an automated solution for reporting the maximum memory of a process. I got it running, but the values memplot reports don't match Activity Monitor. I am trying to monitor python running Stable Diffusion, which uses a lot of memory at high resolutions. When Activity Monitor reported ~35-38 GB used, memplot only ~2.8 GB. The variation in memory use over time also did not match the values reported by Activity Monitor. Is it possible this has something to do with the unified memory structure if Activity Monitor reports full memory use but memplot might ignore the portion used by the GPU?

Thanks!

MacBook Pro M2 Max 64GB
MacOS 13.4b2

[Edit] By the way, I think it might be a good addition for memplot to be able to report, numerically, the max, avg, and min memory usage (and maybe the timestamps of the max and min). Maybe also find a way of filtering the data so that the min memory reporting ignores the shutdown sequence of the process if it terminates during monitoring.

Also, I think the MacOS binary for Apple Silicon should be suffixed "arm64", not "amd64". [/Edit]

Installation installs memplot as "cmd"

Installation instructions are:

go get -u -v github.com/0x0f0f0f/memplot/cmd

...this installs a binary called "cmd", much like if you cd to that dir. and "go build". Usual layout I use is:

github.com/<user>/<repo>/cmd/memplot/memplot.go

...then:

go get -u -v github.com/0x0f0f0f/memplot/cmd/memplot

..will give you a memplot binary. There might be a more efficient way to do this but, I keep using the same thing because it works :).

Recommend Projects

  • React photo React

    A declarative, efficient, and flexible JavaScript library for building user interfaces.

  • Vue.js photo Vue.js

    ๐Ÿ–– Vue.js is a progressive, incrementally-adoptable JavaScript framework for building UI on the web.

  • Typescript photo Typescript

    TypeScript is a superset of JavaScript that compiles to clean JavaScript output.

  • TensorFlow photo TensorFlow

    An Open Source Machine Learning Framework for Everyone

  • Django photo Django

    The Web framework for perfectionists with deadlines.

  • D3 photo D3

    Bring data to life with SVG, Canvas and HTML. ๐Ÿ“Š๐Ÿ“ˆ๐ŸŽ‰

Recommend Topics

  • javascript

    JavaScript (JS) is a lightweight interpreted programming language with first-class functions.

  • web

    Some thing interesting about web. New door for the world.

  • server

    A server is a program made to process requests and deliver data to clients.

  • Machine learning

    Machine learning is a way of modeling and interpreting data that allows a piece of software to respond intelligently.

  • Game

    Some thing interesting about game, make everyone happy.

Recommend Org

  • Facebook photo Facebook

    We are working to build community through open source technology. NB: members must have two-factor auth.

  • Microsoft photo Microsoft

    Open source projects and samples from Microsoft.

  • Google photo Google

    Google โค๏ธ Open Source for everyone.

  • D3 photo D3

    Data-Driven Documents codes.