Real-world data rarely comes clean. Using Python and its libraries, I will gather data from a variety of sources and in a variety of formats, assess its quality and tidiness, then clean it. This is called data wrangling. I will document my wrangling efforts in a Jupyter Notebook, plus showcase them through analyses and visualizations using Python (and its libraries) and/or SQL.
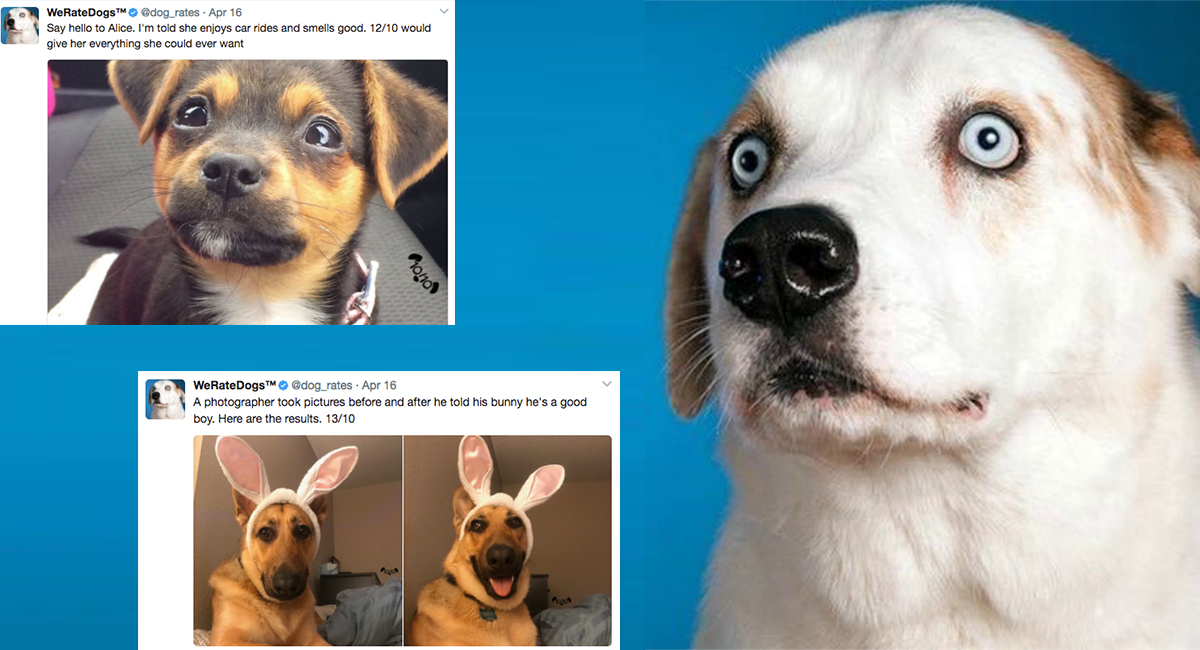
The dataset that I will be wrangling (and analyzing and visualizing) is the tweet archive of Twitter user @dog_rates, also known as WeRateDogs. WeRateDogs is a Twitter account that rates people's dogs with a humorous comment about the dog. These ratings almost always have a denominator of 10. The numerators, though? Almost always greater than 10. 11/10, 12/10, 13/10, etc. Why? Because "they're good dogs Brent." WeRateDogs has over 4 million followers and has received international media coverage.
WeRateDogs downloaded their Twitter archive and sent it to Udacity via email exclusively for me to use in this project. This archive contains basic tweet data (tweet ID, timestamp, text, etc.) for all 5000+ of their tweets as they stood on August 1, 2017. More on this soon.
The following software requirements apply:
- Jupyter Notebook
- Libraries:
- pandas
- NumPy
- requests
- tweepy
- json
My goal: wrangle WeRateDogs Twitter data to create interesting and trustworthy analyses and visualizations. The Twitter archive is great, but it only contains very basic tweet information. Additional gathering, then assessing and cleaning is required for "Wow!"-worthy analyses and visualizations.
The WeRateDogs Twitter archive contains basic tweet data for all 5000+ of their tweets, but not everything. One column the archive does contain though: each tweet's text, which Udacity used to extract rating, dog name, and dog "stage" (i.e. doggo, floofer, pupper, and puppo) to make this Twitter archive "enhanced." Of the 5000+ tweets, Udacity filtered for tweets with ratings only (there are 2356).

Udacity extracted this data programmatically, but didn't do a very good job. The ratings probably aren't all correct. Same goes for the dog names and probably dog stages (see below for more information on these) too. I'll need to assess and clean these columns if I want to use them for analysis and visualization.

Back to the basic-ness of Twitter archives: retweet count and favorite count are two of the notable column omissions. Fortunately, this additional data can be gathered by anyone from Twitter's API. Well, "anyone" who has access to data for the 3000 most recent tweets, at least. But because I have the WeRateDogs Twitter archive and specifically the tweet IDs within it, can gather this data for all 5000+. And guess what? I'm going to query Twitter's API to gather this valuable data.
One more cool thing: Udacity ran every image in the WeRateDogs Twitter archive through a neural network that can classify breeds of dogs*. The results: a table full of image predictions (the top three only) alongside each tweet ID, image URL, and the image number that corresponded to the most confident prediction (numbered 1 to 4 since tweets can have up to four images).

So for the last row in that table:
- tweet_id is the last part of the tweet URL after "status/" → https://twitter.com/dog_rates/status/889531135344209921
- p1 is the algorithm's #1 prediction for the image in the tweet → golden retriever
- p1_conf is how confident the algorithm is in its #1 prediction → 95%
- p1_dog is whether or not the #1 prediction is a breed of dog → TRUE
- p2 is the algorithm's second most likely prediction → Labrador retriever
- p2_conf is how confident the algorithm is in its #2 prediction → 1%
- p2_dog is whether or not the #2 prediction is a breed of dog → TRUE
And the #1 prediction for the image in that tweet was spot on:

So that's all fun and good. But all of this additional data will need to be gathered, assessed, and cleaned. This is where I come in.
Key points to keep in mind when data wrangling for this project:
- I only want original ratings (no retweets) that have images. Though there are 5000+ tweets in the dataset, not all are dog ratings and some are retweets.
- Assessing and cleaning the entire dataset completely would require a lot of time, and is not necessary to practice and demonstrate my skills in data wrangling. Therefore, the requirements of this project are only to assess and clean at least 8 quality issues and at least 2 tidiness issues in this dataset.
- Cleaning includes merging individual pieces of data according to the rules of tidy data.
- The fact that the rating numerators are greater than the denominators does not need to be cleaned. This unique rating system is a big part of the popularity of WeRateDogs.
- I do not need to gather the tweets beyond August 1st, 2017. I can, but note that I won't be able to gather the image predictions for these tweets since I don't have access to the algorithm used.
My tasks in this project are as follows:
- Data wrangling, which consists of:
- Gathering data (downloadable file in the Resources tab in the left most panel of my classroom and linked in step 1 below).
- Assessing data
- Cleaning data
- Storing, analyzing, and visualizing my wrangled data
- Reporting on 1) my data wrangling efforts and 2) my data analyses and visualizations
Gather each of the three pieces of data as described below in a Jupyter Notebook titled wrangle_act.ipynb:
- The WeRateDogs Twitter archive. Udacity is giving this file to me, so imagine it as a file on hand. Download this file manually by clicking the following link: https://d17h27t6h515a5.cloudfront.net/topher/2017/August/59a4e958_twitter-archive-enhanced/twitter-archive-enhanced.csv
- The tweet image predictions, i.e., what breed of dog (or other object, animal, etc.) is present in each tweet according to a neural network. This file
image_predictions.tsvis hosted on Udacity's servers and should be downloaded programmatically using the Requests library and the following URL: https://d17h27t6h515a5.cloudfront.net/topher/2017/August/599fd2ad_image-predictions/image-predictions.tsv - Each tweet's retweet count and favorite ("like") count at minimum, and any additional data I find interesting. Using the tweet IDs in the WeRateDogs Twitter archive, query the Twitter API for each tweet's JSON data using Python's Tweepy library and store each tweet's entire set of JSON data in a file called
tweet_json.txtfile. Each tweet's JSON data should be written to its own line. Then read this .txt file line by line into a pandas DataFrame with (at minimum) tweet ID, retweet count, and favorite count. Note: I will not include my Twitter API keys, secrets, and tokens in my project submission.
After gathering each of the above pieces of data, assess them visually and programmatically for quality and tidiness issues. Detect and document at least eight (8) quality issues and two (2) tidiness issues in my wrangle_act.ipynb Jupyter Notebook. To meet specifications, the issues that satisfy the Project Motivation (see the Key Points header on the previous page) must be assessed.
Clean each of the issues I documented while assessing. Perform this cleaning in wrangle_act.ipynb as well. The result should be a high quality and tidy master pandas DataFrame (or DataFrames, if appropriate). Again, the issues that satisfy the Project Motivation must be cleaned.
Store the clean DataFrame(s) in a CSV file with the main one named twitter_archive_master.csv. If additional files exist because multiple tables are required for tidiness, name these files appropriately. Additionally, I may store the cleaned data in a SQLite database (which is to be submitted as well if I do).
Analyze and visualize my wrangled data in my wrangle_act.ipynb Jupyter Notebook. At least three (3) insights and one (1) visualization must be produced.
Create a 300-600 word written report called wrangle_report.pdf or wrangle_report.html that briefly describes my wrangling efforts. This is to be framed as an internal document.
Create a 250-word-minimum written report called act_report.pdf or act_report.html that communicates the insights and displays the visualization(s) produced from my wrangled data. This is to be framed as an external document, like a blog post or magazine article, for example.
Both of these documents can be created in separate Jupyter Notebooks using the Markdown functionality of Jupyter Notebooks, then downloading those notebooks as PDF files or HTML files (see image below). I might prefer to use a word processor like Google Docs or Microsoft Word, however.

