


Bradley Dice (@bdice), Shannon Moran (@shannon-moran), Dan McCusker (@dm1181), University of Michigan.
In this project, we studied air traffic patterns from 1993 to 2018 using higher-order network representations [1]. Many airline passengers travel in round-trips and have layovers in airports that act as hubs for their carrier of choice. Because of patterns like these, the place a passenger flies next strongly depends on the previous airports they've visited. Network analyses that assume first-order Markov processes (random walks) on the network of US airports cannot capture important dynamics and patterns in flight data, and higher-order networks are one solution to this problem.
Our analysis processes nearly one billion ticket coupons covering 25 years of data obtained from the Bureau of Transportation Statistics [2]. We build higher-order networks on the itineraries and detect communities with InfoMap [3] in the resulting graph structure. All data and workflows were managed with the signac framework [4]. This project was completed for the course Advanced Data Mining with Danai Koutra (EECS 598, Winter 2019) at the University of Michigan [5]. Read the poster or the report.
The primary results of our project are documented in this report. Some of our major findings are below.
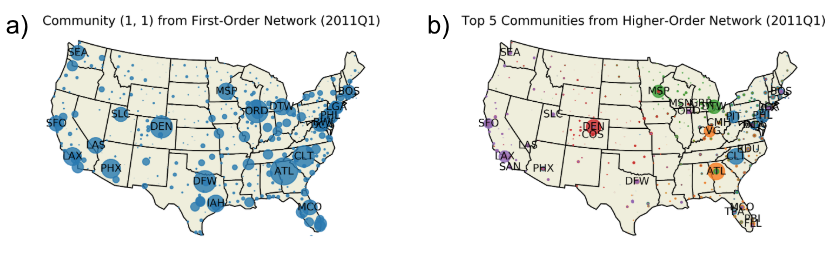
Shown are the communities identified using InfoMap for (a) a first order network and (b) a higher-order network. Only one community (the largest) is shown for the first order network, while the 5 largest communities are shown for the HON. Data is a snapshot from 2011 Q1. Node colors indicate communities, and sizes correspond to flow volume, defined in the text. Labels indicate three letter IATA airport codes.
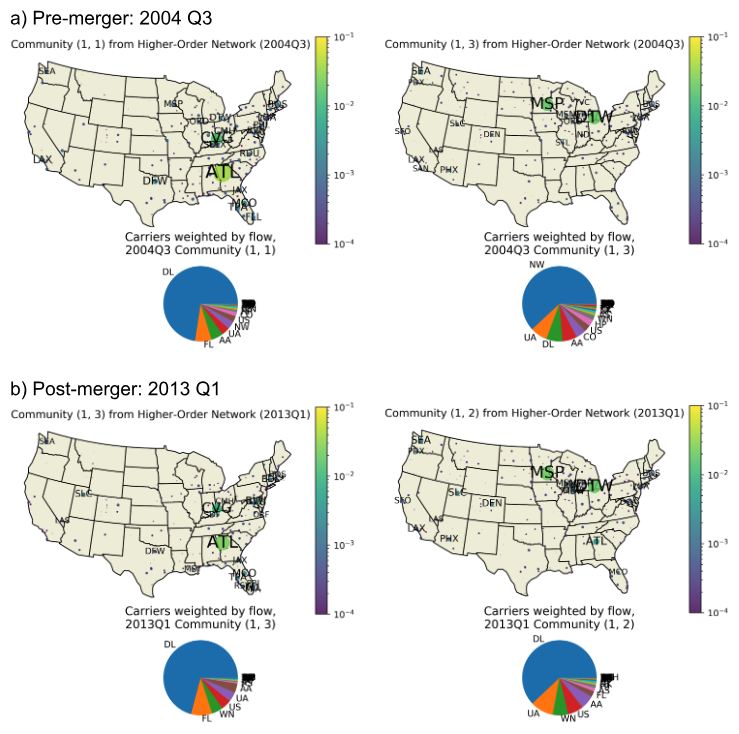
Shown are data for (a) 2004 Q3 and (b) 2013 Q1. Delta (DL) and Northwest (NW) officially merged in 2010 Q1. Interestingly, we observe that this merger did not lead to major structural changes in the networks. Community numbers in the headers correspond to the order in which they were found by the InfoMap algorithm, and are not otherwise meaningful. For each community, the associated pie chart indicates the carriers represented, weighted by flow through the community. In the maps, node color and size indicates flow in the community (see colorbar). Labels indicate three letter IATA airport codes.
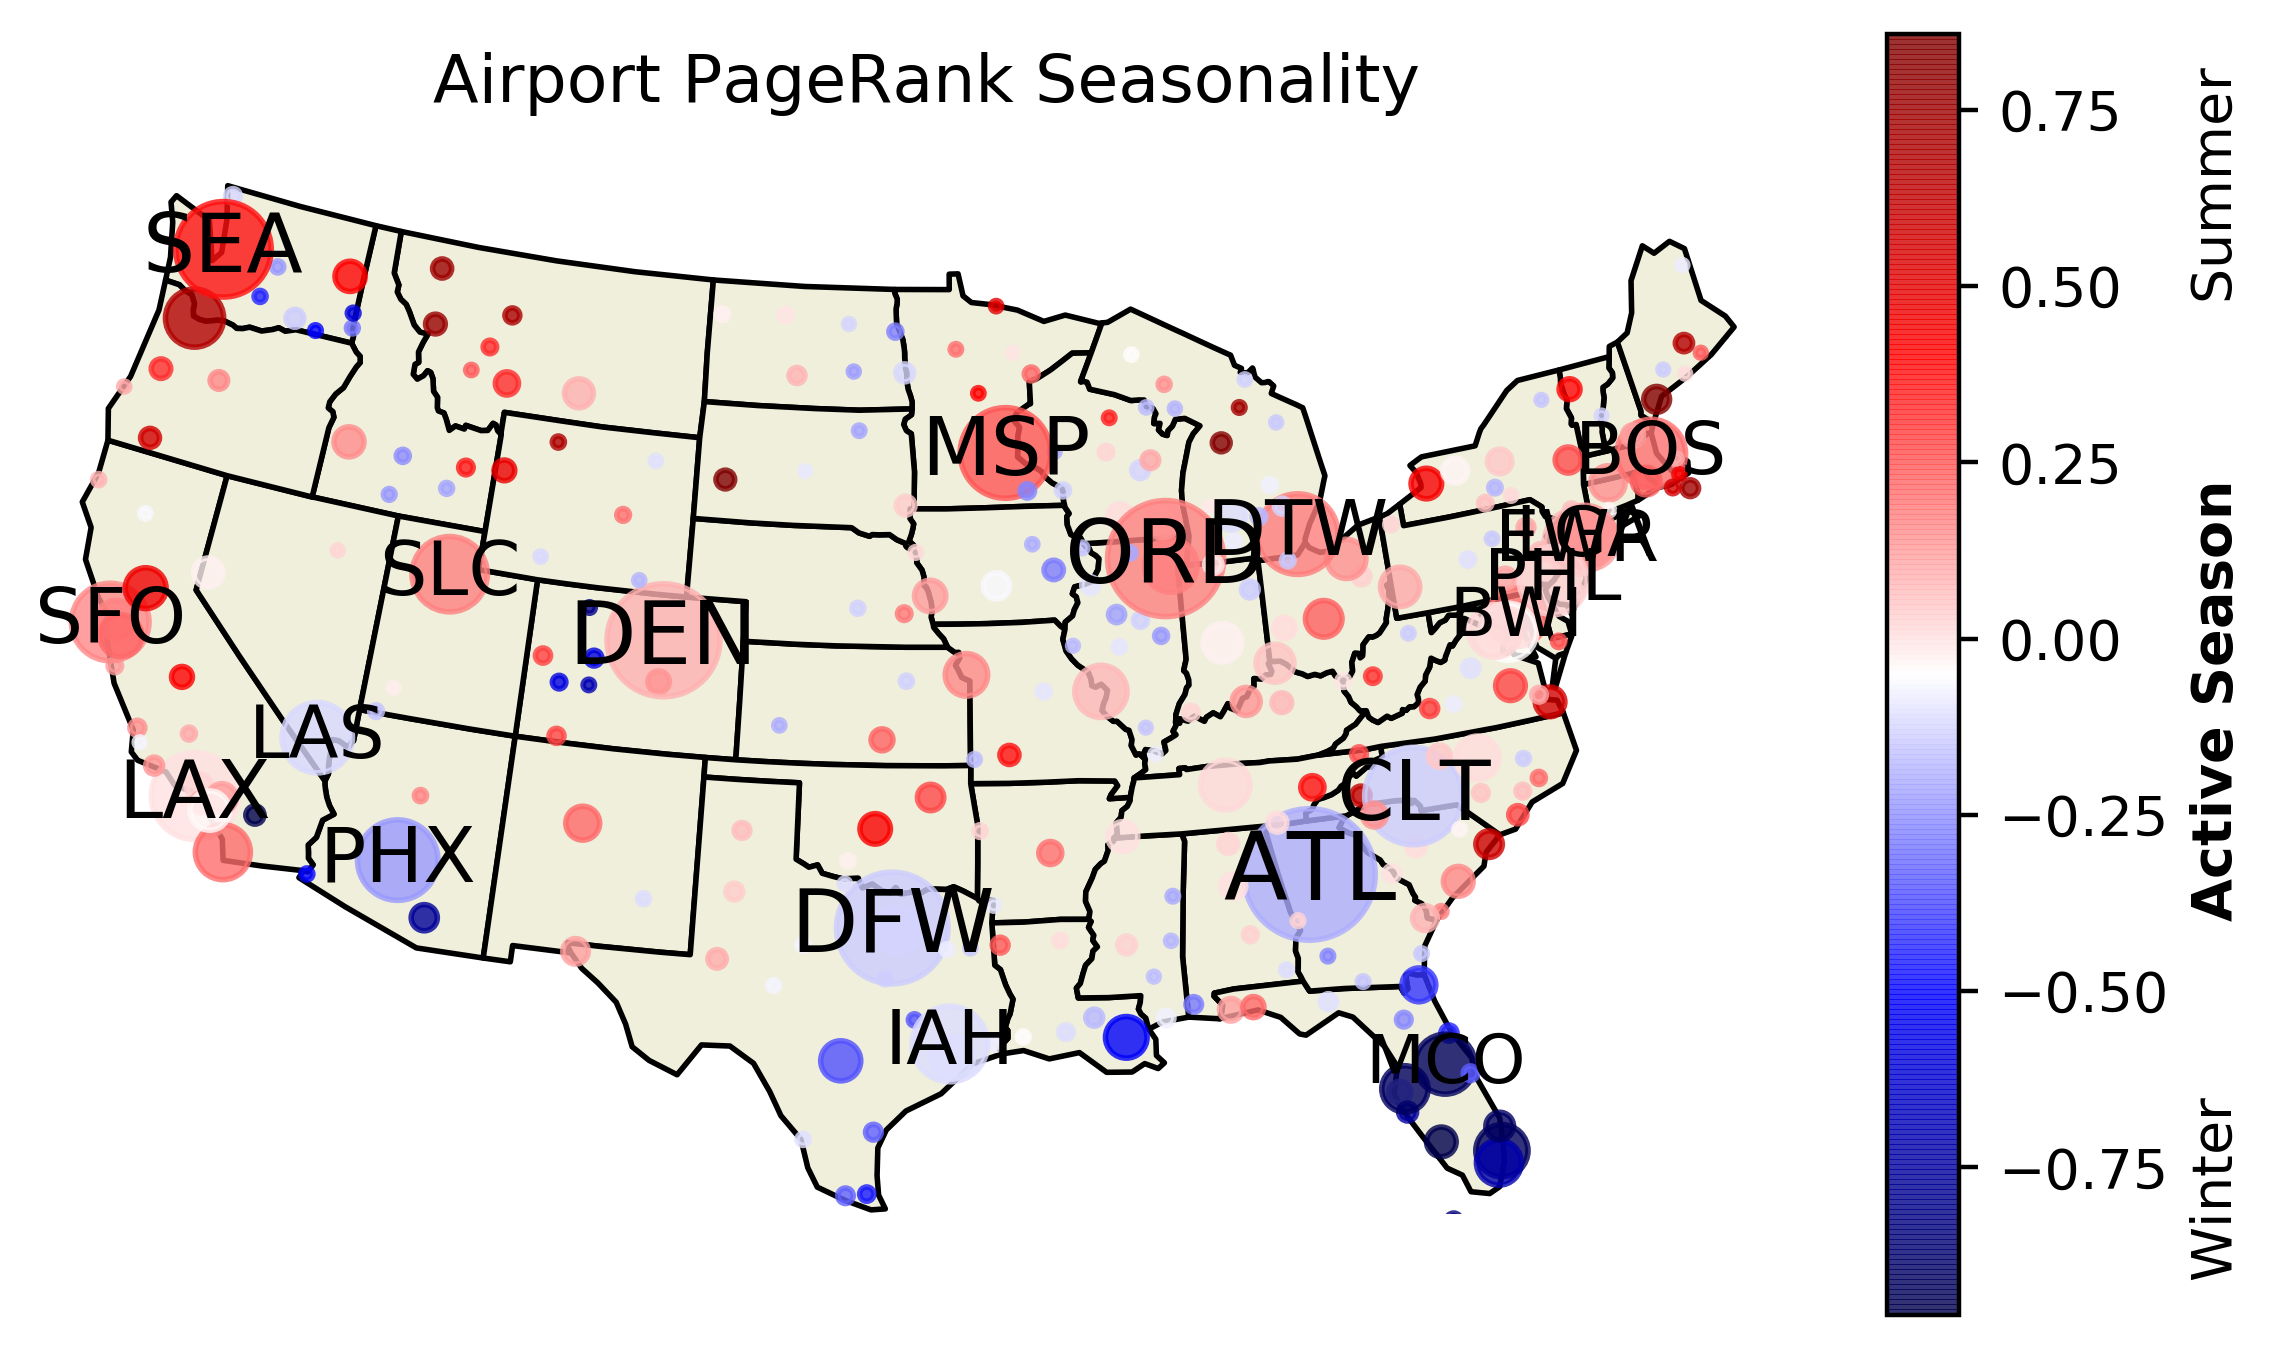
Shown above is seasonality of U.S. airports, as measured by PageRank in the first order network. Node colors correspond to the PageRank seasonality correlation coefficient described in the text and indicated on the colorbar. Node sizes correspond to PageRank in 2018 Q3, and labels indicate three letter IATA airport codes.
The primary source code of this project is in the subdirectory airline_data. This contains code which fetches ticket information from the Airline Origin and Destination Survey (DB1B) and analyzes it using PySpark, HON, and InfoMap [1, 2, 3].
Exploratory data analysis was performed in Jupyter notebooks. These notebooks, included in airline_data/exploration/, were used to prototype code, collect intermediate results, and visualize the data.
The workflow was written as a series of operations in a signac-flow project, described below. These operations include data cleaning, processing, analysis, and visualization tasks.
In addition to Jupyter notebooks, the data space was visualized using signac-dashboard, which enabled rapid inspection of data plots generated by the signac-flow project.
Use the requirements file (pip install -U -r requirements.txt) to acquire project dependencies.
Some notes:
- It was necessary to use Python 2 for compatibility with Spark 2.2 on the flux-hadoop cluster.
- The dependency
cartopyis much easier to install viacondathanpip. It is only needed for generating map visualizations.
Run python init.py to create the signac data space.
Run python project.py run --progress --show-traceback to execute the workflow. The operations below are performed independently for each signac job, corresponding to one quarter of data. All file paths are relative to the job workspace directory.
fetch_data: Fetches data withurllib.request.remove_readmes: Removesreadme.htmlfrom all zip files (having an extra file in the zip breakspandas).determine_size: Reads dataset sizes (rows, columns) from each zip file withpandasand saves that metadata to the job document.unzip_data: Unzips the CSV file.label_data: Renames the CSV file (for consistency across all jobs).get_IATA: Locate unique airport codes in this quarter of data, for cross-reference with the IATA database.extract_edges: Use PySpark to count the number of occurrences for each directed edge(origin, destination), output toedges.tsv/part-*.combine_edgefile: Combine the (distributed) outputs fromedges.tsv/part-*into one file,all_edges.tsv.extract_itineraries: Use PySpark to combine all trajectories from the same itinerary, output tohon_itineraries.txt/part-*.combine_itineraries: Combine the (distributed) outputs fromhon_itineraries.txt/part-*into one file,all_hon_itineraries.txt.plot_first_order_pagerank: Computes, saves, and plots PageRank data from the first-order network. Createsfirst_order_pagerank.txtandpr_1st_order.png.generate_hon: Uses pyHON (modified from original source code for ease of use) to generate the higher-order network. Produceshon_rules.txtandhon_network.txt.hon_pagerank: Runs pyHON PageRank algorithm on higher-order network and saves PageRank data tohon_pagerank.txt.plot_hon_pagerank: Plots PageRanks from nodes in the higher-order network, saved topr_hon.png.hon_prepare_infomap: Translates the format of the higher-order network to the states format for processing with InfoMap. Produceshon_infomap.txt.hon_infomap: Executes InfoMap algorithm, producing hierarchical cluster outputs inhon_infomap.cluandhon_infomap.tree.plot_hon_communities: Plots each community with more than 0.5% of the network's flow, saved inhon_community_plots/hon_community_*.png.first_order_prepare_infomap: Translates the format of the first-order network to the Pajek format for processing with InfoMap. Producesfirst_order_infomap.txt.plot_first_order_communities: Plots each community with more than 0.5% of the network's flow, saved infirst_order_community_plots/first_order_community_*.png.plot_hon_top_communities: Creates a plot similar to the previous HON community plots, overlaying the top 5 communities and coloring them by their respective clusters inhon_top_communities.png.plot_hon_community_carriers: For each community with more than 0.5% of the network's flow, plot a pie chart of different airlines' presence within that community, weighted by the sum of origin and destination carrier flows. Produceshon_community_plots/hon_community_carriers_*.pngandhon_community_carriers.json.
Users may specify which operation should be run with the -o operation_name flag, like python project.py run -o fetch_data --progress --show-traceback.
For the data generation in this project, operations 1-5 were run on a local directory.
Then, the data was copied into HDFS and operations 6-21 were run on HDFS (accessed via hadoop-fuse).
The command python project.py status -d shows the status of the workflow, including which operations will run next.
The all_edges.tsv file follows this tab-separated format:
origin_id destination_id count
where origin_id and destination_id come from the DB1B data's identifiers and count is the number of coupons found for that edge.
The all_hon_itineraries.txt file follows the space-separated line input format required by the pyHON code [1]:
unique_id node1 node2 node3 node4 ... nodeN
where unique_id is an identifier for the whole trajectory and node1 through nodeN are stops along that trajectory.
InfoMap uses the states format and Pajek format described above.
The directory airline_data/sample_data_2011Q1/ contains most of the files generated by this workflow for the data from 2011 Q1. See the sample data README for example images and additional information.
- Xu, J., Wickramarathne, T. L., & Chawla, N. V. (2016). Representing higher-order dependencies in networks. Science Advances, 2(5), e1600028. Publication, GitHub repository.
- Bureau of Transportation Statistics, Office of Airline Information. Airline Origin and Destination Survey (DB1B). Data Source.
- Rosvall, M., Esquivel, A. V, Lancichinetti, A., West, J. D., & Lambiotte, R. (2014). Memory in network flows and its effects on spreading dynamics and community detection. Nature Communications, 5, 4630. Publication, Website, GitHub repository.
- Adorf, C. S., Dodd, P. M., Ramasubramani, V., & Glotzer, S. C. (2018). Simple data and workflow management with the signac framework. Comput. Mater. Sci., 146(C):220-229, 2018. Publication, Website, GitHub repository.
- Koutra, D. EECS 598 W19 course webpage.


