The PiHat is a smart hat that goes on your head and warns you of the unseen dangers of your surroundings. It also looks cool with LEDs on the top.
Being on the top of a hat, the UV light sensor is the primary sensor of this project. The GY-8511 is a breakout board for the ML8511. It outputs an analogue signal that corresponds with the amount of UV light detected. The sensor detects 290-380 nm light, which is categorized as part of the UVB (burning rays) spectrum and most of the UVA (tanning rays) spectrum. Since it outputs an analogue signal, an ADC like the MCP3008 is required.
- This is a sample wiring for a RPi to a ML8511 with a MCP3008.
- This is a hookup guide for the ML8511 that has sample code for arduino. It also talks a bit about how to deal with the data and finding levels and duration of UV that might cause damage to skin.
- This is the datasheet to the ML8511.
#### Option One: CCS811
The CCS811 detects TVOC and CO2 natively on the breakout board.
Option Two: TGS2602
The TGS2602 detects VOCs, alcohol, and ammonia compunds, which are all generally associated with bad air quality.
Since the sensors are going to be on a hat, the temperature sensor is probably going to be under direct sunlight for pretty long. Even if I put it on the inside of the hat where your head goes, the temperature and the hat-wearer's humidity is still probably going to be inaccurate.
Who doesn't want a big shiny light on their head? Nothing shows off the PiHat like a nice RGB LED strip or array. The LEDs should change color according to the current danger levels of the surroundings. If an array is used, it may even be able to display detected data or custom messages. -This is a nice tutorial that has explainations for both a normal RGB LED strip and a WS28XX strip. -A nice controller for a RGB LED strip in python.
Since the LED is going to be all pretty on top of the hat, the hat-bearer is probably not gonna see it at all, hence the need for a notification Piezo buzzer to notify the hat-bearer of status changes.
The data collected can be represented numerically or graphically on a simple website that is accessible to the hat-bearer. Interpretations of the data can be there as well.
Initially, I tried to connect the sensors directly to the RPi via the MCP3008 (following tutorials from here,here, and here). However, after connecting the pins of the GYML8511 there was still no reading via SPI (as taught by this tutorial using a similar UV sensing board), and I couldn't find anything about hooking up the TGS2602 to a RPi. So I decided to go out and get a arduino uno compatitble board to make my life easier. The tutorials online were easy to follow (ML8511, TGS2602) and Arduino wasn't too difficult to learn at all.
One can hook up the Arduino Uno board to the Raspberry Pi via the Pi's USB ports. Hooking it up doesn't seem to draw too much power as the red LED on the RPi is still fine and not blinking. The arduino's IDE can be installed and be functional on Raspbian (as taught here). The data can then be transmitted via Serial(/dev/ttyUSB0) and be read by python code (as seen here, here, or here). However, there's currently an issue where each line of the reading start with "b'" and end with "\r\n". I couldn't find anything on what's causing the "b'" but "\r\n" seems to be an "end of line symbol" that's a combination of Carriage Return and Line Feed (Explained here in Chinese).
Once the python code reads the data, I forced the values into variables UV and AQ by their string length. Since the UV is always one digit, a decimal followed by two digits, it is one digit longer than the AQ value. (bad idea, controlling by lines is much steadier) it is assigned to variables UV and aq by line count that can be set by the arduino code. The arduino board sends over data in three lines, two of which are UV sensor and air quality sensor values, and the other is empty.
Now that it is assigned, we can deal with it.
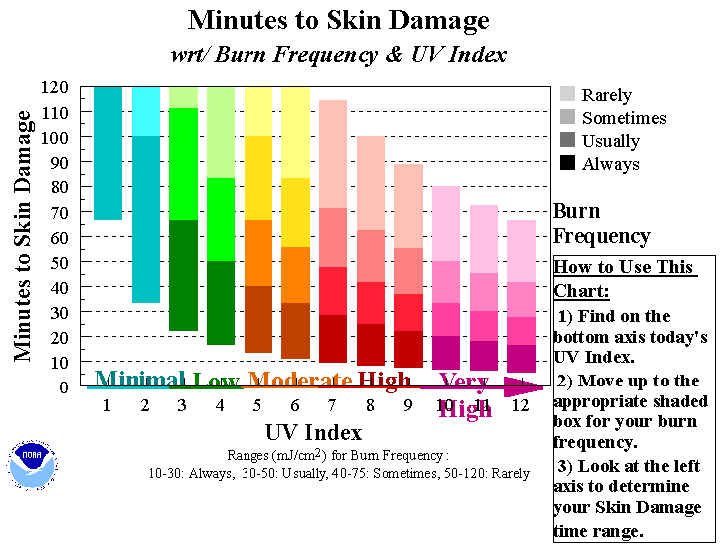
According to this chart from the NOAA we can learn that when the UV index is at five or six it is probably a good idea to start worrying about skin damage since theres only less than twenty minutes from burn damage. So we can set our inital warning here. The next level, High, is at UV index of seven, eight and nine. At this point the user should really be worrying about sunburn, so our second warning sounds here. Anything over ten and our user should probably be worrying about buying aloe vera for their sunburns so we can issue the third and final UV index warning.
As for air quality, I couldn't find a actual chart or reference table, but from the tutorial I could see that after the inital startup the values gradually drop to "normal". From my own experience the numbers tend to stay around the 200-300 range (testing this in an air-conditioned dorm room). The author mentioned in the comments that using hand sanditizer around it skyrockets the detected value to 700 to 900, so I tried the same with some 75% rubbing alcohol that I had. Using it next to the sensor (definitely not at the sensor), the values did indeed go up as the tutorial said. Estimating from this, I set the initial warning level at 700, where probably an abornormality occurs in the air around you, but like spraying rubbing alcohol, doesn't put your life in danger at all. The following warning levels are set at 1500 and 3000, with severity estimated like on the UV index. Of course, this is a rough estimate that's not verified.
I included four LEDs and a piezo buzzer to display data. As mentioned above, the warning levels are divided into low, medium, and high. The red LEDs light up accordingly to its respective level. The yellow LED is to show whether the warning lights are about UV levels or air quality. Currently, the lighting of the yellow LED indicates that the program is in the phase of checking UV levels, and if any red LEDs light up they will be about UV levels. The piezo buzzer is set to beep anytime warning levels reach medium or higher, regardless of which indicator it is talking about.
With a service like PushBullet, the Pi can send push notifications to your browser or phone. There is a discussion on /r/raspberry_pi that talks about using a python script to push notfications with a simple function. With a API code from PushBullet, sending notifications is a piece of cake. I set the code to send a notification to the service every 10 readings using the counter used for reading lines. There are also warning notifications for medium and high-severity warnings for both UV levels and air quality.
- Calibration! I have no idea how the sensors are calibrated and if numbers are affected by temperature or humidity. (They most likely are) The UV sensor is also not calibrated.
- Sensor warm-up: Both sensors' datasheet and tutorials mention the neccessity of warming up the sensors.
- Since the Arduino serial output is constant, if I add too many sleep functions in the python code, the code will break since we take in the data by lines. I added a check for irregular values to reset the counter so the program remains functional. This only works since the values from our sensors are in entirely different units.
You can find some pictures of the project here.
- The last two images are examples of PushBullet notifications. You'll be notified wherever you have the PushBullet services ready.
- Totally ignore the MCP3008 chips that are just there and contribute nothing but are there because I'll probably lose them if I didn't stick it on there.
