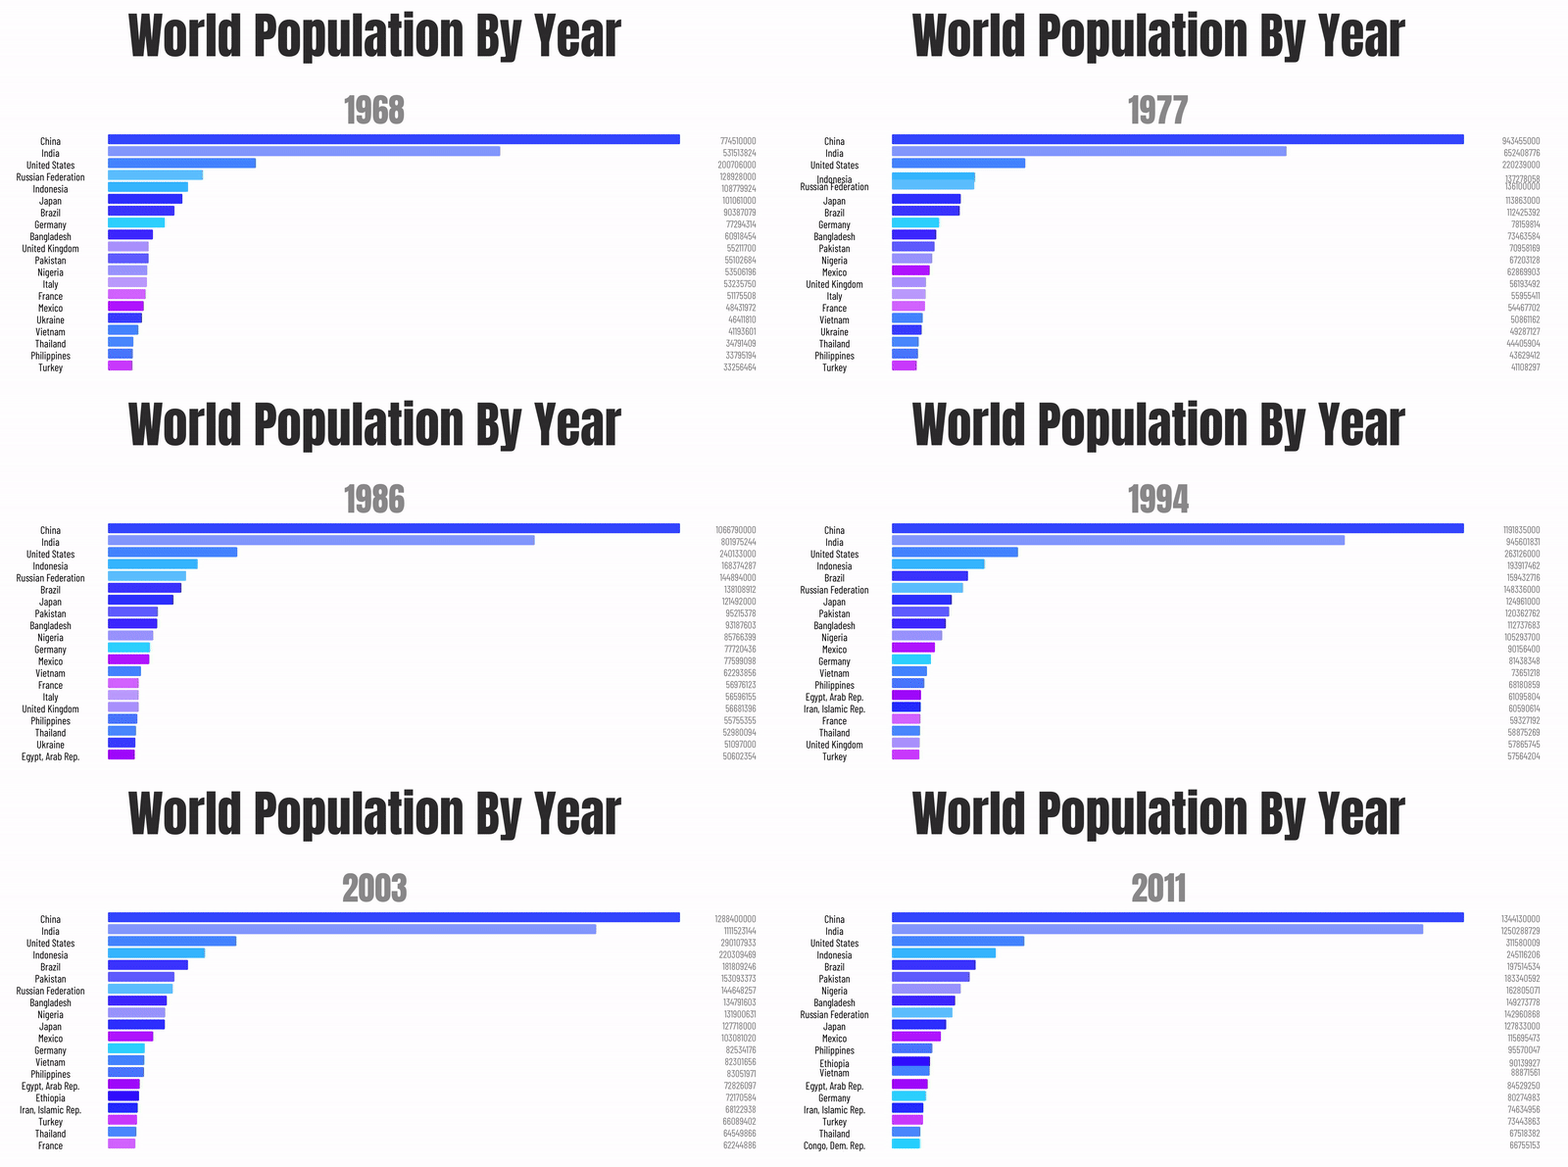
Seamless & fully customizable bar chart for React.The result of bar chart is already sorted in descending order so you don't need to write extra code for that purpose.
npm install --save react-race-chart
import BarChart from 'react-race-chart';You should wrap BarChart inside a container div that acts as a sandbox. The width of the BarChart fits the container width.
<div style={{width: "500px"}}>
    <BarChart />
</div>Passing props.
You will need to pass your own props to the BarChart component. Refer to examples for more information.
| Prop | Type | Explanation |
|---|---|---|
| start | Boolean | Defines whether the bar chart race has started. Default is true and the chart race will start as the component mounts. |
| data | Object | An object with keys being the data field name and value being Array data. data[key].length should be equal to len. |
| timeline | Array | An array defining the time indices. Length should be equal to len. |
| labels | Object | An object with keys being the data field name and value being a HTML element that acts as the data field's label. |
| colors | Object | An object with keys being the data field name and value being the color the data bar. |
| timeout | Integer | Transition time between adjacent time indices (in ms). |
| delay | Integer | Waiting time between adjacent time indices (in ms). |
| timelineStyle | Object | CSS style objects for time indices. |
| textBoxStyle | Object | CSS style objects for data text. |
| barStyle | Object | CSS style object defining the style of all the bars. It is advised to use height to define the thickness and marginTop to define the distance between adjacent bars. |
| width | Array | Defines the width allocation for label, bar, and text box. Values in width should add up to 100. |
| maxItems | Integer | Defines the maximum number of items to show in the chart. Should be less or equal to Object.keys(data).length. |
Easibly define custom data, text styles, colors, duration, and layout.
Add images to data labels.

