This is a preview version of the Android for VS Code Extension. The extension allows developers to install, launch and debug Android Apps from within the VS Code environment.
- Java Intellisense for Android is now in beta.
- Line by line code stepping
- Breakpoints
- Variable inspection and modification
- Logcat viewing [ Command Palette -> Android: View Logcat ]
- Break on exceptions
- Step through Android sources
You must have Android SDK Platform Tools installed. This extension communicates with your device via the ADB (Android Debug Bridge) interface.
You are not required to have Android Studio installed - if you have Android Studio installed, make sure there are no active instances of it when using this extension or you may run into problems with ADB.
- This is a preview version so expect the unexpected. Please log any issues you find on GitHub.
- This extension will not build your app.
If you use gradle (or Android Studio), you can build your app from the command-line using./gradlew assembleDebugor configure a VSCode Build Task to run the command (see below).
You must use gradle or some other build procedure to create your APK. Once built, the extension can deploy and launch your app, allowing you to debug it in the normal way. See the section below on how to configure a VSCode Task to automatically build your app before launching a debug session.
- Some debugger options are yet to be implemented. You cannot set conditional breakpoints and watch expressions must be simple variables.
- If you require a must-have feature that isn't there yet, let us know on GitHub.
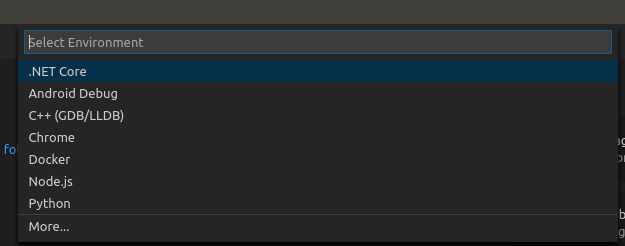
This extension allows you to debug your App by creating a new Android configuration in launch.json.
The following settings are used to configure the debugger:
    {
        "version": "0.2.0",
        "configurations": [
            {
                // configuration type, request  and name. "launch" is used to deploy the app
                // to your device and start a debugging session.
                "type": "android",
                "request": "launch",
                "name": "Launch App",

                // Location of the App source files. This value must point to the root of
                // your App source tree (containing AndroidManifest.xml).
                "appSrcRoot": "${workspaceRoot}/app/src/main",

                // Fully qualified path to the built APK (Android Application Package).
                "apkFile": "${workspaceRoot}/app/build/outputs/apk/app-debug.apk",

                // `host:port` configuration for connecting to the ADB (Android Debug Bridge) server instance.
                // Default: localhost:5037
                "adbSocket": "localhost:5037",

                // Automatically launch 'adb start-server' if not already started.
                // Default: true
                "autoStartADB": true,

                // Launch behaviour if source files have been saved after the APK was built.
                // One of: [ ignore warn stop ]. Default: warn
                "staleBuild": "warn",

                // Target Device ID (as indicated by 'adb devices').
                // Use this to specify which device is used for deployment
                // when multiple devices are connected.
                "targetDevice": "",

                // Fully qualified path to the AndroidManifest.xml file compiled into the APK.
                // Default: "${appSrcRoot}/AndroidManifest.xml"
                "manifestFile": "${workspaceRoot}/app/src/main/AndroidManifest.xml",

                // Custom arguments passed to the Android package manager to install the app.
                // Run 'adb shell pm' to show valid arguments. Default: ["-r"]
                "pmInstallArgs": ["-r"],

                // Custom arguments passed to the Android application manager to start the app.
                // Run `adb shell am` to show valid arguments.
                // Note that `-D` is required to enable debugging.
                "amStartArgs": [
                    "-D",
                    "--activity-brought-to-front",
                    "-a android.intent.action.MAIN",
                    "-c android.intent.category.LAUNCHER",
                    "-n package.name/launch.activity"
                ],

                // Manually specify the activity to run when the app is started. This option is
                // mutually exclusive with "amStartArgs".
                "launchActivity": ".MainActivity",

                // Time in milliseconds to wait after launching an app before attempting to attach
                // the debugger. Default: 1000ms
                "postLaunchPause": 1000,

                // Set to true to output debugging logs for diagnostics.
                "trace": false
            }
        ]
}This extension will not build your App. If you would like to run a build each time a debug session is started, you can add a preLaunchTask option to your launch.json configuration which invokes a build task.
Add a preLaunchTask item to the launch configuration:
{
    "version": "0.2.0",
    "configurations": [
        {
            "type": "android",
            "request": "launch",
            "name": "App Build & Launch",
            "preLaunchTask": "run gradle",
            ...
        }
    ]
}
Add a new task to run the build command:
{
    "version": "2.0.0",
    "tasks": [
        {
            "label": "run gradle",
            "type": "shell",
            "command": "${workspaceFolder}/gradlew",
            "args": [
                "assembleDebug"
            ],
            "presentation": {
                "echo": true,
                "reveal": "always",
                "focus": false,
                "panel": "shared",
                "showReuseMessage": true,
                "clear": false
            },
            "problemMatcher": [],
            "group": {
                "kind": "build",
                "isDefault": true
            }
        }
    ]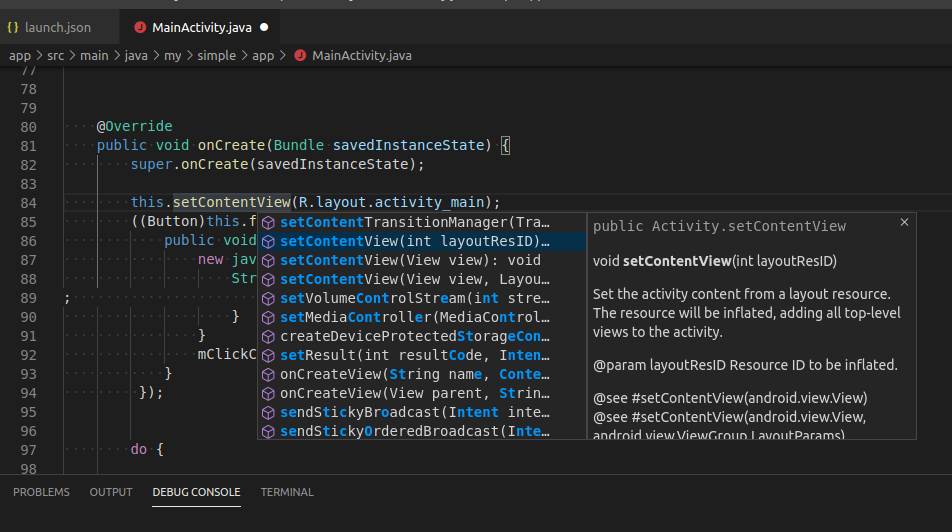
}Support for Java Intellisense is currently in beta, so any feedback is appreciated.
To use Java intellisense, make sure the option is enabled in Settings (Extensions > Android > Enable Java language support for Android)
and press ctrl/cmd-space when editing a Java source file.
You can read more about using code-completion on the VSCode website and how to configure code-completion to suit your Android project in the wiki.
Format specifiers can be appended to watch and repl expressions to change how the evaluated result is displayed. The specifiers work with the same syntax used in Visual Studio. See https://docs.microsoft.com/en-us/visualstudio/debugger/format-specifiers-in-cpp for examples.
123              123
123,x            0x0000007b
123,xb           0000007b
123,X            0x0000007B
123,o            000000000173
123,b            0b00000000000000000000000001111011
123,bb           00000000000000000000000001111011
123,c            '{'
"one\ntwo"       "one\ntwo"
"one\ntwo",sb    one\ntwo
"one\ntwo",!     one
                 two
You can also apply the specifiers to object and array instances to format fields and elements:
arr,x            int[3]
   [0]           0x00000001
   [1]           0x00000002
   [1]           0x00000003
Note: Format specifiers for floating point values (e/g) and string encoding conversions (s8/su/s32) are not supported.
The Android Developer Extension is a completely free, fully open-source project. If you've found the extension useful, you can support it by buying me a coffee.
If you use ApplePay or Google Pay, you can scan the code with your phone camera:

Every coffee makes a difference, so thanks for adding your support.
If you run into any problems, tell us on GitHub or contact me on Twitter.

![dependabot[bot] avatar](https://avatars.githubusercontent.com/in/29110?v=4 "dependabot[bot]")