aleip / capriextract Goto Github PK
View Code? Open in Web Editor NEWExtraction of CAPRI results from gdx files
Extraction of CAPRI results from gdx files


Introduce option to highlight outliers as it is already done with the negative values.
Suggestion
x < lowthreshold and y if y > highthresholdFunctions opendata(), filteropen() and filtermultiple() should set attributes to the data table in case it is saved for later inspection. Attributes should contain:
Enable custom color schemes for CAPRI plot.
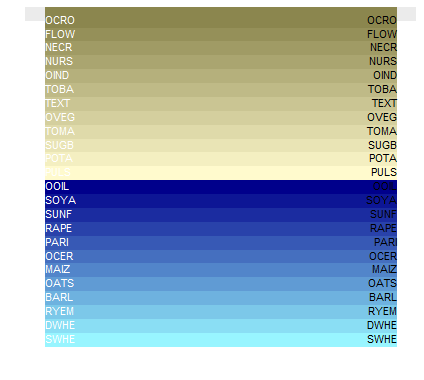
the function setcolors() identifies fixed colors for each CAPRI element (such as crops) so that all plots get an equal look. The function has not yet set colors for all possible items and needs to be extended as the needs arise.
An example of colors are given in below.
Depending on the plot, the elements could be in ROWS or COLS.
setcolors() returns a function colfun(n) with n indicating the number of colors required.
however, as shown in the attached file - the use in the plotting functions (here: plotbars()) does not work!
res_2_0830epnf_refpol_endotechall_SSP1mp_SSP1mpmbal_SSP1-SSP2-SSP3-SSP4-SSP5.pdf
Check availability of data to avoid that 'empty' plots/pages are being produced. Optionally jump over a panel (leaving blank) or using space for next plot.
Generate plots that display the difference vs one selected scenario / file
A declarative, efficient, and flexible JavaScript library for building user interfaces.
🖖 Vue.js is a progressive, incrementally-adoptable JavaScript framework for building UI on the web.
TypeScript is a superset of JavaScript that compiles to clean JavaScript output.
An Open Source Machine Learning Framework for Everyone
The Web framework for perfectionists with deadlines.
A PHP framework for web artisans
Bring data to life with SVG, Canvas and HTML. 📊📈🎉
JavaScript (JS) is a lightweight interpreted programming language with first-class functions.
Some thing interesting about web. New door for the world.
A server is a program made to process requests and deliver data to clients.
Machine learning is a way of modeling and interpreting data that allows a piece of software to respond intelligently.
Some thing interesting about visualization, use data art
Some thing interesting about game, make everyone happy.
We are working to build community through open source technology. NB: members must have two-factor auth.
Open source projects and samples from Microsoft.
Google ❤️ Open Source for everyone.
Alibaba Open Source for everyone
Data-Driven Documents codes.
China tencent open source team.