Giter Site home page Giter Site logo

allisonhorst / palmerpenguins Goto Github PK

View Code? Open in Web Editor NEW
856.0 23.0 204.0 40.12 MB

A great intro dataset for data exploration & visualization (alternative to iris).

Home Page: https://allisonhorst.github.io/palmerpenguins/

License: Creative Commons Zero v1.0 Universal

R 90.07% CSS 9.93%

palmerpenguins's Introduction

palmerpenguins

DOI CRAN

The goal of palmerpenguins is to provide a great dataset for data exploration & visualization, as an alternative to iris.

Installation

You can install the released version of palmerpenguins from CRAN with:

install.packages("palmerpenguins")

To install the development version from GitHub use:

# install.packages("remotes")
remotes::install_github("allisonhorst/palmerpenguins")

About the data

Data were collected and made available by Dr. Kristen Gorman and the Palmer Station, Antarctica LTER, a member of the Long Term Ecological Research Network.

The palmerpenguins package contains two datasets.

library(palmerpenguins)
data(package = 'palmerpenguins')

One is called penguins, and is a simplified version of the raw data; see ?penguins for more info:

head(penguins)
#> # A tibble: 6 × 8
#>   species island bill_length_mm bill_depth_mm flipper_length_… body_mass_g sex  
#>   <fct>   <fct>           <dbl>         <dbl>            <int>       <int> <fct>
#> 1 Adelie  Torge…           39.1          18.7              181        3750 male 
#> 2 Adelie  Torge…           39.5          17.4              186        3800 fema…
#> 3 Adelie  Torge…           40.3          18                195        3250 fema…
#> 4 Adelie  Torge…           NA            NA                 NA          NA <NA> 
#> 5 Adelie  Torge…           36.7          19.3              193        3450 fema…
#> 6 Adelie  Torge…           39.3          20.6              190        3650 male 
#> # … with 1 more variable: year <int>

The second dataset is penguins_raw, and contains all the variables and original names as downloaded; see ?penguins_raw for more info.

head(penguins_raw)
#> # A tibble: 6 × 17
#>   studyName `Sample Number` Species          Region Island Stage `Individual ID`
#>   <chr>               <dbl> <chr>            <chr>  <chr>  <chr> <chr>          
#> 1 PAL0708                 1 Adelie Penguin … Anvers Torge… Adul… N1A1           
#> 2 PAL0708                 2 Adelie Penguin … Anvers Torge… Adul… N1A2           
#> 3 PAL0708                 3 Adelie Penguin … Anvers Torge… Adul… N2A1           
#> 4 PAL0708                 4 Adelie Penguin … Anvers Torge… Adul… N2A2           
#> 5 PAL0708                 5 Adelie Penguin … Anvers Torge… Adul… N3A1           
#> 6 PAL0708                 6 Adelie Penguin … Anvers Torge… Adul… N3A2           
#> # … with 10 more variables: `Clutch Completion` <chr>, `Date Egg` <date>,
#> #   `Culmen Length (mm)` <dbl>, `Culmen Depth (mm)` <dbl>,
#> #   `Flipper Length (mm)` <dbl>, `Body Mass (g)` <dbl>, Sex <chr>,
#> #   `Delta 15 N (o/oo)` <dbl>, `Delta 13 C (o/oo)` <dbl>, Comments <chr>

Both datasets contain data for 344 penguins. There are 3 different species of penguins in this dataset, collected from 3 islands in the Palmer Archipelago, Antarctica.

str(penguins)
#> tibble [344 × 8] (S3: tbl_df/tbl/data.frame)
#>  $ species          : Factor w/ 3 levels "Adelie","Chinstrap",..: 1 1 1 1 1 1 1 1 1 1 ...
#>  $ island           : Factor w/ 3 levels "Biscoe","Dream",..: 3 3 3 3 3 3 3 3 3 3 ...
#>  $ bill_length_mm   : num [1:344] 39.1 39.5 40.3 NA 36.7 39.3 38.9 39.2 34.1 42 ...
#>  $ bill_depth_mm    : num [1:344] 18.7 17.4 18 NA 19.3 20.6 17.8 19.6 18.1 20.2 ...
#>  $ flipper_length_mm: int [1:344] 181 186 195 NA 193 190 181 195 193 190 ...
#>  $ body_mass_g      : int [1:344] 3750 3800 3250 NA 3450 3650 3625 4675 3475 4250 ...
#>  $ sex              : Factor w/ 2 levels "female","male": 2 1 1 NA 1 2 1 2 NA NA ...
#>  $ year             : int [1:344] 2007 2007 2007 2007 2007 2007 2007 2007 2007 2007 ...

We gratefully acknowledge Palmer Station LTER and the US LTER Network. Special thanks to Marty Downs (Director, LTER Network Office) for help regarding the data license & use.

Examples

You can find these and more code examples for exploring palmerpenguins in vignette("examples").

Penguins are fun to summarize! For example:

library(tidyverse)
penguins %>% 
  count(species)
#> # A tibble: 3 × 2
#>   species       n
#>   <fct>     <int>
#> 1 Adelie      152
#> 2 Chinstrap    68
#> 3 Gentoo      124
penguins %>% 
  group_by(species) %>% 
  summarize(across(where(is.numeric), mean, na.rm = TRUE))
#> # A tibble: 3 × 6
#>   species   bill_length_mm bill_depth_mm flipper_length_mm body_mass_g  year
#>   <fct>              <dbl>         <dbl>             <dbl>       <dbl> <dbl>
#> 1 Adelie              38.8          18.3              190.       3701. 2008.
#> 2 Chinstrap           48.8          18.4              196.       3733. 2008.
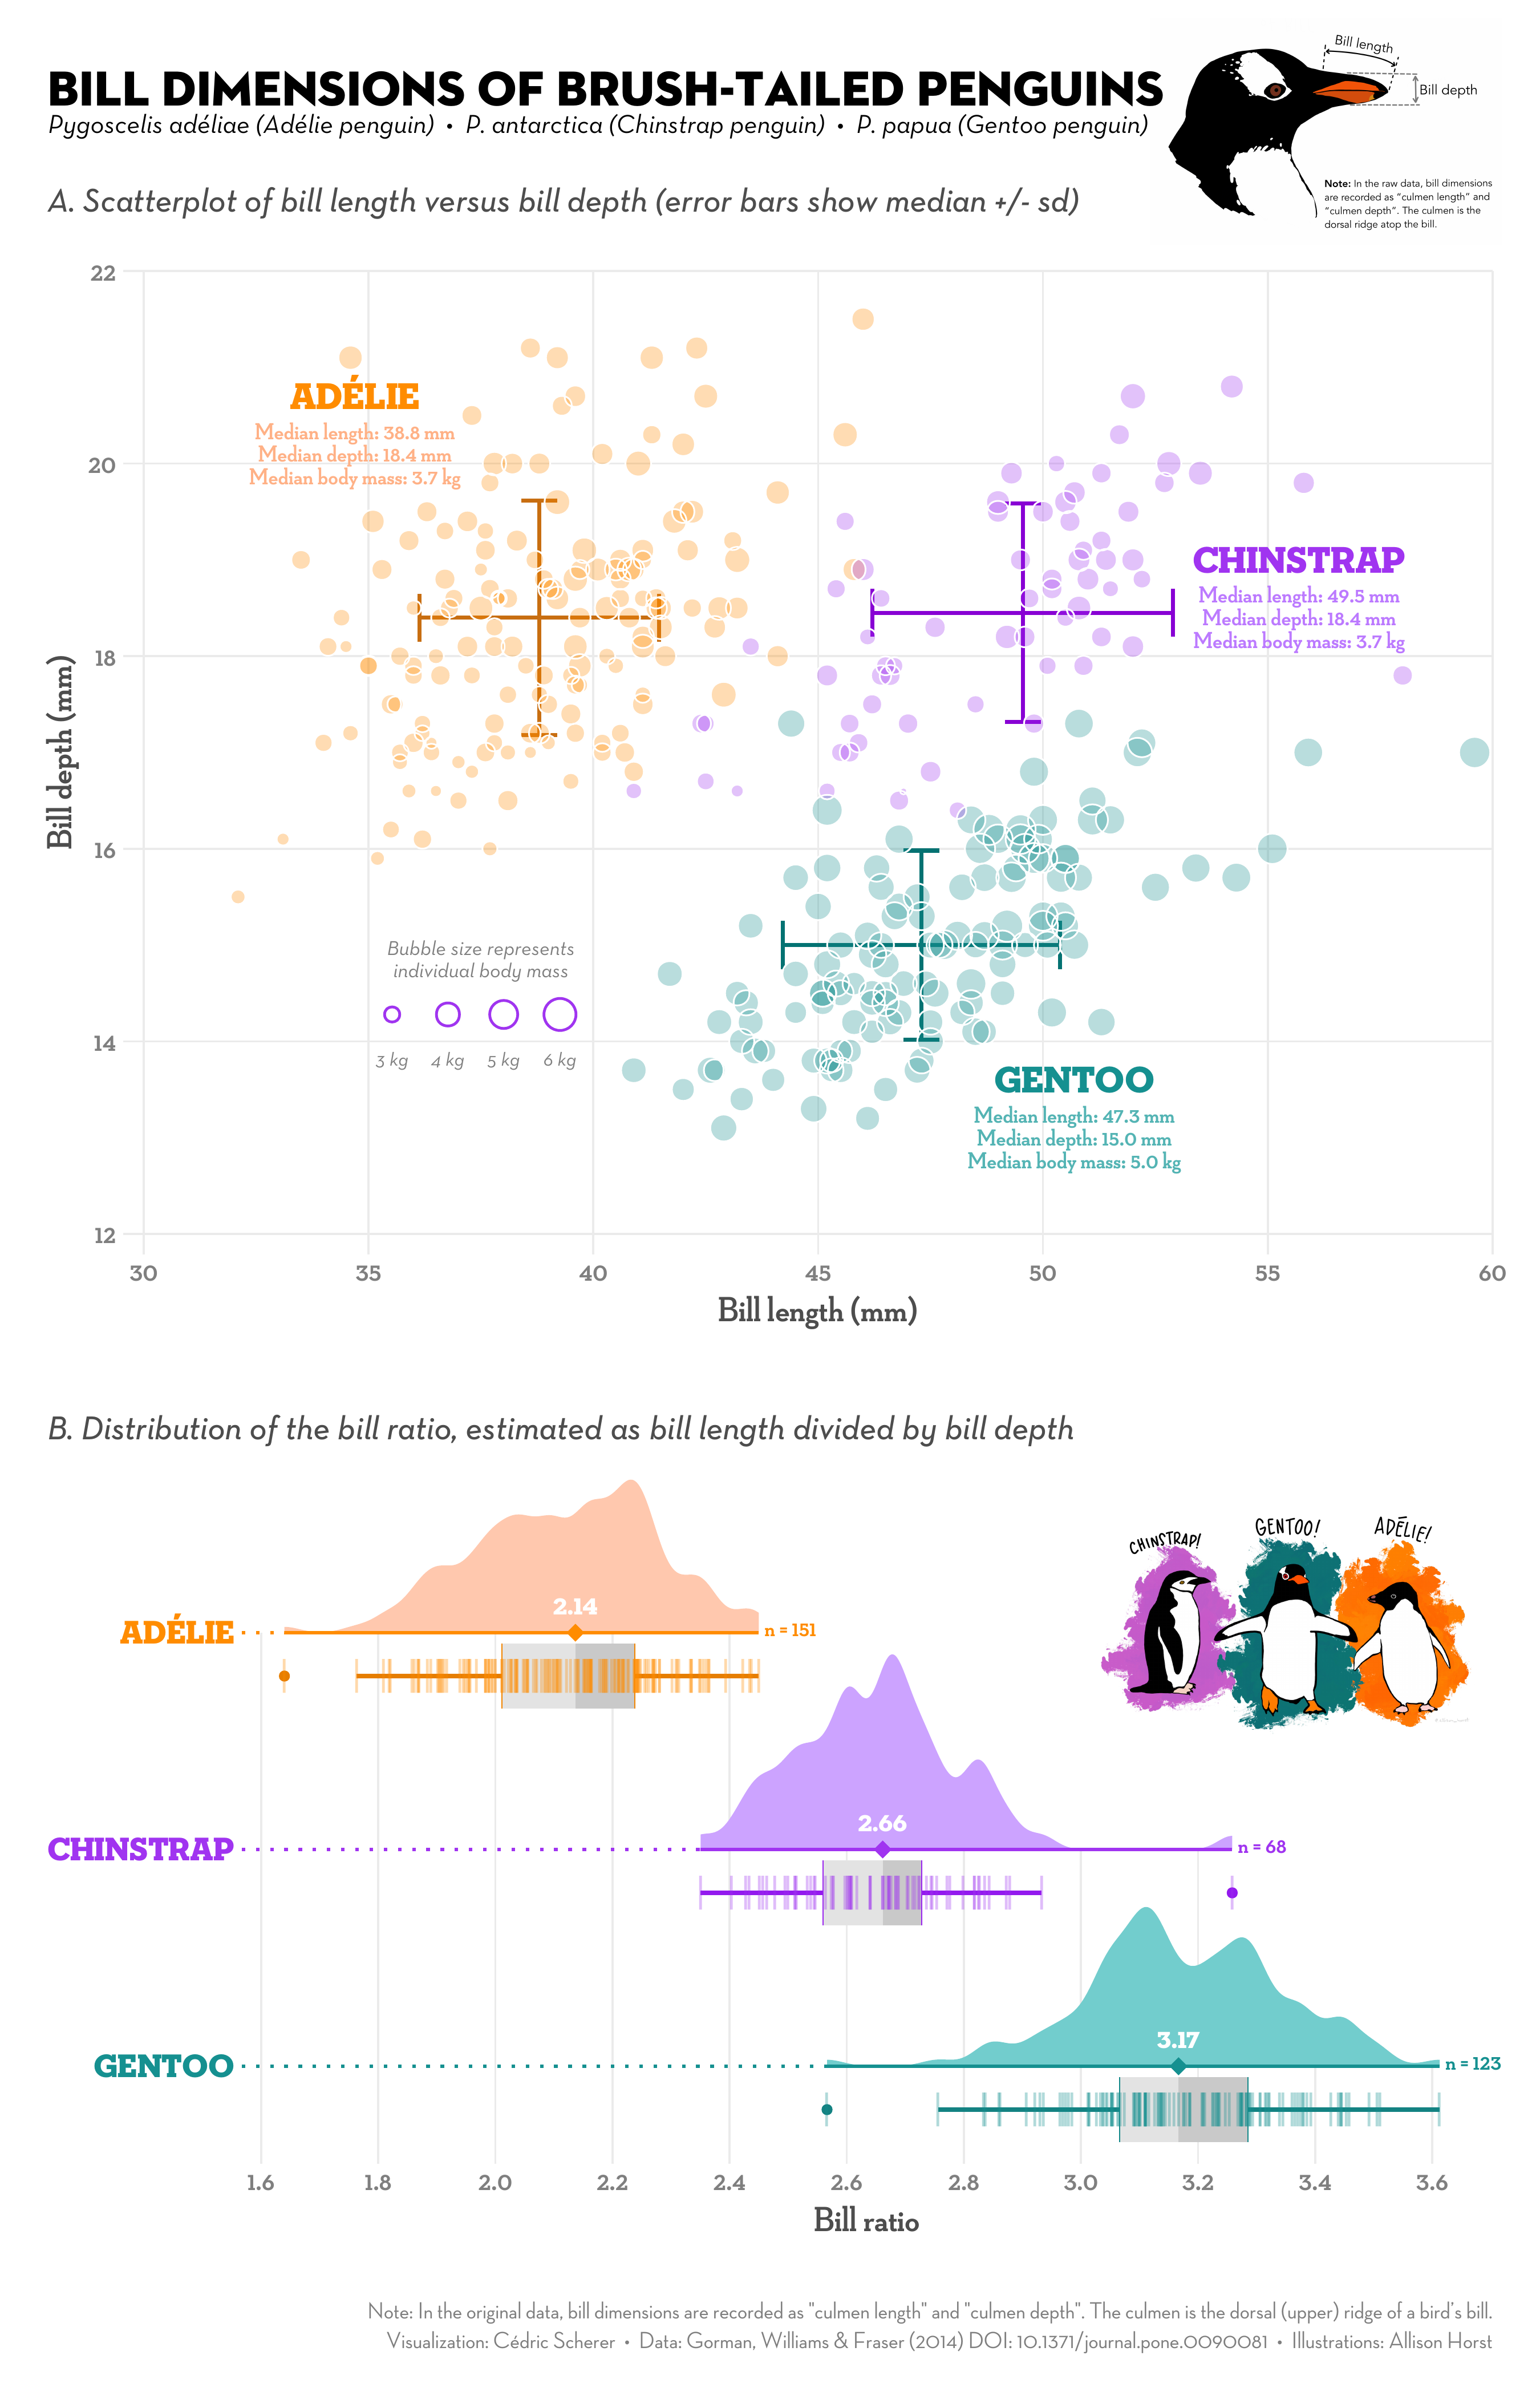
#> 3 Gentoo              47.5          15.0              217.       5076. 2008.

Penguins are fun to visualize! For example:

Artwork

You can download palmerpenguins art (useful for teaching with the data) in vignette("art"). If you use this artwork, please cite with: “Artwork by @allison_horst”.

Meet the Palmer penguins

Bill dimensions

The culmen is the upper ridge of a bird’s bill. In the simplified penguins data, culmen length and depth are renamed as variables bill_length_mm and bill_depth_mm to be more intuitive.

For this penguin data, the culmen (bill) length and depth are measured as shown below (thanks Kristen Gorman for clarifying!):

License

Data are available by CC-0 license in accordance with the Palmer Station LTER Data Policy and the LTER Data Access Policy for Type I data.

Citation

To cite the palmerpenguins package, please use:

citation("palmerpenguins")
#> 
#> To cite palmerpenguins in publications use:
#> 
#>   Horst AM, Hill AP, Gorman KB (2020). palmerpenguins: Palmer
#>   Archipelago (Antarctica) penguin data. R package version 0.1.0.
#>   https://allisonhorst.github.io/palmerpenguins/. doi:
#>   10.5281/zenodo.3960218.
#> 
#> A BibTeX entry for LaTeX users is
#> 
#>   @Manual{,
#>     title = {palmerpenguins: Palmer Archipelago (Antarctica) penguin data},
#>     author = {Allison Marie Horst and Alison Presmanes Hill and Kristen B Gorman},
#>     year = {2020},
#>     note = {R package version 0.1.0},
#>     doi = {10.5281/zenodo.3960218},
#>     url = {https://allisonhorst.github.io/palmerpenguins/},
#>   }

Additional data use information

Anyone interested in publishing the data should contact Dr. Kristen Gorman about analysis and working together on any final products. From Gorman et al. (2014): “Individuals interested in using these data are expected to follow the US LTER Network’s Data Access Policy, Requirements and Use Agreement: https://lternet.edu/data-access-policy/.”

References

Data originally published in:

  • Gorman KB, Williams TD, Fraser WR (2014). Ecological sexual dimorphism and environmental variability within a community of Antarctic penguins (genus Pygoscelis). PLoS ONE 9(3):e90081. https://doi.org/10.1371/journal.pone.0090081

Data citations:

Adélie penguins:

  • Palmer Station Antarctica LTER and K. Gorman, 2020. Structural size measurements and isotopic signatures of foraging among adult male and female Adélie penguins (Pygoscelis adeliae) nesting along the Palmer Archipelago near Palmer Station, 2007-2009 ver 5. Environmental Data Initiative. https://doi.org/10.6073/pasta/98b16d7d563f265cb52372c8ca99e60f (Accessed 2020-06-08).

Gentoo penguins:

  • Palmer Station Antarctica LTER and K. Gorman, 2020. Structural size measurements and isotopic signatures of foraging among adult male and female Gentoo penguin (Pygoscelis papua) nesting along the Palmer Archipelago near Palmer Station, 2007-2009 ver 5. Environmental Data Initiative. https://doi.org/10.6073/pasta/7fca67fb28d56ee2ffa3d9370ebda689 (Accessed 2020-06-08).

Chinstrap penguins:

  • Palmer Station Antarctica LTER and K. Gorman, 2020. Structural size measurements and isotopic signatures of foraging among adult male and female Chinstrap penguin (Pygoscelis antarcticus) nesting along the Palmer Archipelago near Palmer Station, 2007-2009 ver 6. Environmental Data Initiative. https://doi.org/10.6073/pasta/c14dfcfada8ea13a17536e73eb6fbe9e (Accessed 2020-06-08).

palmerpenguins's People

Contributors

apreshill avatar hadley avatar jennybc avatar jmbuhr avatar trangdata avatar

Stargazers

 avatar  avatar  avatar  avatar  avatar  avatar  avatar  avatar  avatar  avatar  avatar  avatar  avatar  avatar  avatar  avatar  avatar  avatar  avatar  avatar  avatar  avatar  avatar  avatar  avatar  avatar  avatar  avatar  avatar  avatar  avatar  avatar  avatar  avatar  avatar  avatar  avatar  avatar  avatar  avatar  avatar  avatar  avatar  avatar  avatar  avatar  avatar  avatar  avatar  avatar  avatar  avatar  avatar  avatar  avatar  avatar  avatar  avatar  avatar  avatar  avatar  avatar  avatar  avatar  avatar  avatar  avatar  avatar  avatar  avatar  avatar  avatar  avatar  avatar  avatar  avatar  avatar  avatar  avatar  avatar  avatar  avatar  avatar  avatar  avatar  avatar  avatar  avatar  avatar  avatar  avatar  avatar  avatar  avatar  avatar  avatar  avatar  avatar  avatar  avatar

Watchers

 avatar  avatar  avatar  avatar  avatar  avatar  avatar  avatar  avatar  avatar  avatar  avatar  avatar  avatar  avatar  avatar  avatar  avatar  avatar  avatar  avatar  avatar  avatar

palmerpenguins's Issues

About using the Images

Hello,
First of all, Thank you for providing this awsome dataset, which all beginner can access easily.

I have a plan to open a basic competition by using this dataset.
Fortunately, data is provided by CC0 but the image, which describe palmerpenguins data and is in readme.md has no aligned liscence.

I want to ask this dataset provider ,that I can use the images
(Ofcourse I clearly define the source)

thanks

data(penguins_raw) not found

For some reason, I can access palmerpenguins::penguins_raw, but I cannot load it with the data() function:

library(palmerpenguins)

data(penguins)
data(penguins_raw)
#> Warning in data(penguins_raw): data set 'penguins_raw' not found

When I type data(package="palmerpenguins"), I get this:

Data sets in package ‘palmerpenguins’:

penguins                               Size measurements for adult foraging penguins near Palmer Station, Antarctica
penguins_raw (penguins)                Penguin size, clutch, and blood isotope data for foraging adults near Palmer
                                       Station, Antarctica

So the problem may be related to the weird palmerpenguins_raw (penguins) string (with space) under which the dataset is catalogued.

Any ideas what might be causing this?

Thanks!

Release palmerpenguins 0.1.0

Prepare for release:

  • Check that description is informative
  • Check licensing of included files
  • usethis::use_cran_comments()
  • devtools::check() (+ devtools::check(cran = TRUE))
  • devtools::check_win_devel()
  • rhub::check_for_cran()
  • Polish pkgdown reference index
  • Draft blog post

Submit to CRAN:

  • usethis::use_version('minor')
  • Update cran-comments.md
  • devtools::submit_cran()
  • Approve email

Wait for CRAN...

  • Accepted 🎉
  • usethis::use_github_release()
  • usethis::use_dev_version()
  • usethis::use_news_md()
  • Update install instructions in README
  • Finish blog post
  • Tweet
  • Add link to blog post in pkgdown news menu

theme specification for captions not used in ggplot2 examples

In the ggplot2 examples there are some theme specifications for captions, e.g.

plot.caption = element_text(hjust = 0, face= "italic"),
plot.caption.position = "plot"

I believe these are not used since the plots don't have captions. Were they supposed to have captions or should these be removed? I'm happy to send in a PR but I wasn't sure which way to go. 🐧

Include `penguins` and `penguins_raw` in base R datasets package

The palmerpenguins package is a wonderful resource, offering a better alternative to the iris dataset, and has been widely embraced by the R community in courses, workshops, blog posts, and other learning materials.

In order to make the data even more available (especially for use in teaching and generating examples) it would be great to include penguins and penguins_raw in the datasets package in base R (noting that penguins is already included in Python, Julia and TensorFlow, and that there's a CC0 license on the package).

As well as including the data, we also propose updating all examples in base R that use iris to use penguins instead.

We discussed this at the R Contributors Office Hour this morning. Heather recalled that there had been a call for this previously on twitter (thread). Has there been anything further from that (tagging @gadenbuie, @njtierney)?

Those on the discussion this morning (especially me and @hturner) are happy to push this forward. We thought an issue here was the best place to start, to get the insight of the package authors (tagging @allisonhorst and @apreshill). Do you support this idea? Would you like to be involved? There are a few things that will need thinking about, and we'd appreciate your input:

  • Would the data go in hard-coded or would the data-generating scripts in the package be used?
  • Could the vignettes be included (hasn't been done before for in dataset package)?
  • What happens with all the additional material, e.g. the art? (Presumably keep the webpage and link to it in the datasets documentation?)

How were these questions handled for the inclusion of the data in Python/Julia/TensorFlow?

Once there's a response here, we'll also get a conversation going in the R Contributors Slack and prepare a case for the R Core Team (of which this issue and the links in it will form a part) as the next steps. The R Contributors Office Hours notes linked above also lists further steps needed for making this addition to base R.

Build failure: Error in loadNamespace(x) : there is no package called ‘palmerpenguins’

This is likely Macports-specific error, but this is the only one package I got it (we have about 1500 R packages in Macports by now):

--->  Configuring R-palmerpenguins
Executing:  cd "/opt/local/var/macports/build/_opt_PPCSnowLeopardPorts_R_R-palmerpenguins/R-palmerpenguins/work/palmerpenguins" && /opt/local/bin/R CMD build . --no-manual --no-build-vignettes 
* checking for file ‘./DESCRIPTION’ ... OK
* preparing ‘palmerpenguins’:
* checking DESCRIPTION meta-information ... OK
* checking for LF line-endings in source and make files and shell scripts
* checking for empty or unneeded directories
* re-saving .R files as .rda
Error in loadNamespace(x) : there is no package called ‘palmerpenguins’
Execution halted
Command failed:  cd "/opt/local/var/macports/build/_opt_PPCSnowLeopardPorts_R_R-palmerpenguins/R-palmerpenguins/work/palmerpenguins" && /opt/local/bin/R CMD build . --no-manual --no-build-vignettes 
Exit code: 1
Error: Failed to configure R-palmerpenguins: configure failure: command execution failed

NAMESPACE has:

# Generated by roxygen2: do not edit by hand

export(path_to_file)

Error in gzfile(file, "rb") : cannot open the connection

Hello @allisonhorst , Thanks for making this! I'm facing a quite strange error and I'm not sure what I've done wrong. Sorry if this is trivial.

> library(palmerpenguins)
> summary(penguins)
Error in gzfile(file, "rb") : cannot open the connection
In addition: Warning message:
In gzfile(file, "rb") :
  cannot open compressed file 'data/penguins.rds', probable reason 'No such file or directory'
> sessionInfo()
R version 4.0.0 (2020-04-24)
Platform: x86_64-apple-darwin17.0 (64-bit)
Running under: macOS Catalina 10.15.5

Matrix products: default
BLAS:   /System/Library/Frameworks/Accelerate.framework/Versions/A/Frameworks/vecLib.framework/Versions/A/libBLAS.dylib
LAPACK: /Library/Frameworks/R.framework/Versions/4.0/Resources/lib/libRlapack.dylib

locale:
[1] en_US.UTF-8/en_US.UTF-8/en_US.UTF-8/C/en_US.UTF-8/en_US.UTF-8

attached base packages:
[1] stats     graphics  grDevices utils    
[5] datasets  methods   base     

other attached packages:
[1] palmerpenguins_0.0.0.9000

loaded via a namespace (and not attached):
 [1] compiler_4.0.0  magrittr_1.5   
 [3] ellipsis_0.3.0  tools_4.0.0    
 [5] pillar_1.4.4    rstudioapi_0.11
 [7] tibble_3.0.1    crayon_1.3.4   
 [9] vctrs_0.2.4     lifecycle_0.2.0
[11] pkgconfig_2.0.3 rlang_0.4.6   

Julia package

Hej!

First of all, I'd like to thank you for providing the Palmer penguins dataset and the accompanying resources! I want to inform you that I put together a Julia package "PalmerPenguins.jl" to make the dataset more easily accessible for Julia users and developers. The package uses DataDeps.jl to download the CSV file of the dataset once and to make it available for further use. Users are presented with a summary of the information in https://github.com/allisonhorst/palmerpenguins/blob/master/README.md such as authors, website, general structure, license, and how to cite the dataset (the same information is also included in https://github.com/devmotion/PalmerPenguins.jl/blob/master/README.md).

I hope I gave credit to your work correctly - in particular I'm wondering if it's OK to use the logo (IMO it looks really great) to link to your webpage?

Vignettes not accessible from package

library(palmerpenguins)
sessionInfo()
#> R version 4.0.5 (2021-03-31)
#> Platform: x86_64-apple-darwin17.0 (64-bit)
#> Running under: macOS Mojave 10.14.6
#> 
#> Matrix products: default
#> BLAS:   /Library/Frameworks/R.framework/Versions/4.0/Resources/lib/libRblas.dylib
#> LAPACK: /Library/Frameworks/R.framework/Versions/4.0/Resources/lib/libRlapack.dylib
#> 
#> locale:
#> [1] en_US.UTF-8/en_US.UTF-8/en_US.UTF-8/C/en_US.UTF-8/en_US.UTF-8
#> 
#> attached base packages:
#> [1] stats     graphics  grDevices utils     datasets  methods   base     
#> 
#> other attached packages:
#> [1] palmerpenguins_0.1.0
#> 
#> loaded via a namespace (and not attached):
#>  [1] compiler_4.0.5  magrittr_1.5    tools_4.0.5     htmltools_0.5.0
#>  [5] yaml_2.2.1      stringi_1.4.6   rmarkdown_2.6   highr_0.8      
#>  [9] knitr_1.29      stringr_1.4.0   xfun_0.15       digest_0.6.25  
#> [13] rlang_0.4.7     evaluate_0.14
vignette(package = "palmerpenguins")
#> no vignettes found

Created on 2021-06-14 by the reprex package (v0.3.0)

This discussion may be relevant.

multivariate penguin vignettes

Hi
I completed another vignette, published on Rpubs

Can you please edit the vignettes/articles/user_contributions.Rmd file to include these links

Links to user-contributed examples, posts and vignettes:

  • Penguins data: Multivariate EDA

    • Author: Michael Friendly
    • Description: These examples show the use of multivariate exploratory visualization methods -- principal component analysis and biplots -- to understand the relations among variables in the penguins data set.
  • Penguins data: MANOVA and HE plots

    • Author: Michael Friendly
    • Description: This vignette illustrates the use of MANOVA, HE plots and canonical discriminant analysis in the analysis of the Palmer penguins data.

user contributed example: fixed-width file

I have written a blog post using a fixed-width version of the palmerpenguins data
https://martinmonkman.com/post/2020-09-15_penguins/

Title: Importing fixed-width files
Description: Examples using the functions in the {readr} package to import a fixed-width version of the palmerpenguins data.

If you are interested, I can submit a pull request with the R code to generate the fixed-width version and the .txt file. See
https://github.com/MonkmanMH/palmerpenguins/tree/master/data-fwf
for details

Thanks for the super data!

Match culmen_depth.png to new column names

Hi!

Thanks so much for all your effort in this package and the beautiful illustrations! 👩‍🎨 💕

I would love to be able to use the culmen_depth.png for a tutorial I am building.
Since the column names have been changed from culmen_* to to bill_*, I was wondering if you could update culmen depth illustration to reflect that when you get a chance? 🐧

Thank you!

Update pkgdown GHA workflow

I'm about to TA in a workshop that Hadley is teaching and we're going to use palmerpenguins. So I installed it and noticed it was very recently updated and binaries aren't available yet, so I just wanted to check on what the changes were. And I saw some recent changes to the pkgdown workflow.

It turns out it's much better to update the entire workflow file. It doesn't really work so well to just edit v1 to v2, for example.

https://www.tidyverse.org/blog/2022/06/actions-2-0-0/#simpler-workflow-files

I don't know if you're currently having any problems because of this, but it's just a good idea to freshen the whole workflow. I'll make a PR and you can see what you think. If you're worried about merging it, I'll also stick around long enough to work through any issues.

Remove dependency on tibble

Dear Allison,

First of all: thank you for making this package available. It is a great data set for teaching!

I noticed that the package imports tibble, while tibble is not used anywhere in the R folder. It can therefore be removed from the DESCRIPTION file. This makes the package more lightweight to install.

Explicitly, tibble also depends on packages, which depend on packages again, and so on. This means that when I install palmerpenguins in a clean R installation, a total number of 66 extra packages will be installed. None of these packages, including tibble, are needed to use the penguins data set.

I'm happy to make a PR if you agree.

Thanks again for all the work,
Mark

flipper_length_mm is integer?

I was surprised to see the flipper_length_mm column is explicitly created as an integer column

mutate(flipper_length_mm = as.integer(flipper_length_mm)) %>%
but the other _mm columns are dbl.

Is it there an intention behind this or would you be open to a PR to convert this into dbl?

Request for 'simplified' penguins dataset

First, thank you for providing this great dataset!

For the mlr3 project (www.github.com/mlr-org/mlr3) we've been replacing all instances of the problematic iris dataset with penguins. However one of the large benefits of iris is that it can be handled by all (classical and ML) models as it contains no factors and has no missing values. Whilst we could modify penguins internally this could be messy as users may be confused by multiple similar datasets (i.e. running a model on our penguins would not be same results as version here).

Therefore I'd like to request an 'official' simplified version of penguins, exported with the package, that removes missing observations and converts the factor column to integer.

Thanks!
Raphael

User-contributed example

short title: Creating Report-Ready Charts for Group Comparisons in R: A Step-By-Step Guide
link: https://dallasnova.rbind.io/post/faded-violin-plots-my-go-to-style-for-clear-and-transparent-data-visualization/
Author name(s): Dallas Novakowski
brief (1 - 2 sentence) description: This post is a rundown of a workflow for preparing group-comparison graphs that are ready to include in nearly any kind of report. The code is sectioned out piece-by-piece so beginners can better understand the impacts of each ggplot function and argument, graphs also incorporate statistical hypothesis tests (one-way & two-way ANOVA, t-tests).

User-contributed data visualization #TidyTuesday

Scatterplot and raincloud plots showing bill dimensions.


Visualization by Cédric Scherer, artwork by Allison Horst

The visualization shows the relationship of bill lengthg versus bill depth for the three brush-tailed penguins as well as the distribution of bill ratio, estimated as bill length divided by bill depth, as raincloud plots. All 100% ggplot2 as a #TidyTuesday contribution for week 2020/31.

User-contributed code: Mapping Penguin Population Study Sites

Alison asked if I'd submit some code from a Tweet as a contribution:.

  • Title: Mapping Penguin Population Study Sites
  • Author: Alex Cookson
  • Description: This code shows how to create a map of Antarctica with a "polar orthographic" projection (looking at Antarctica from the bottom of the Earth). Shown on the map are over 600 sites from the MAPPPD (Mapping Application for Penguin Populations and Projected Dynamics) project, as well as an annotation showing the Palmer Peninsula -- birthplace of the Palmer Penguins in the dataset!

The code is here. This is just a simple example, so it's a short RMarkdown file with comments in the code. If you prefer something different, I'm more than happy to change it to suit what you'd like!

Include data as csv files?

One really great aspect of the gapminder package is that it includes the tsv files so that learners can also practice reading data in from a file. Would that be possible to add here? Is there interest for this feature (beyond myself)?

Include csv files in repository?

Thanks for your efforts in providing this new data set as a standard. I just cloned the repo and noticed one thing missing that I wanted to use for an example: a stored csv.

One thing frequently shown when teaching data wrangling is taught is remote download from a URL just as you do here in your data-raw/ directory. And while the package is nicely set-up according to CRAN packaging standards and cleanly provides its data, it only provides to R users of the package which is more limiting than it could be and excludes other users.

Would you consider also writing the data as a csv file so that is could be slurped with a remote csv read? This would offer two benefits not currently covered. One is more minor: you can "standardize" on a file name by using one, so it will always be palmerpenguins.csv rather than some variant, and two, more importantly, you do not close the door to data science users not starting from an R package.

Disk space is reasonably cheap, and the vignettes/ directory alone is 3mb. The csv export of the data set I just made (for a demo use) clocks in at 14kb, or less that 1/2 of a percent. So we'd have the space, and I think we'd loose nothing by also offering a downloadable csv. I am more ambivalent of how to best ship it in a package. The data set is so small that I would probably include it as a csv but given that the whole LazyLoad machinery is set up there is no reason to change this. But having a download target csv would be a nice net gain for some users not currently reached. Thanks for your considerations.

query about use of factors in the penguins dataset

I love the penguins. Thanks for putting this together.

I had one question. Dospecies, island, and sex need to be factors?

As an example of how leaving them as character vectors might be preferable, imagine an analysis that considers penguins on only two island. If dplyr::filter() is used then there's still a stray factor level that needs to be dropped.

Would it be feasible to move to characters in a future release?

suppressPackageStartupMessages(library(dplyr))
library(palmerpenguins)
glimpse(penguins)
#> Rows: 344
#> Columns: 8
#> $ species           <fct> Adelie, Adelie, Adelie, Adelie, Adelie, Adelie, Ade…
#> $ island            <fct> Torgersen, Torgersen, Torgersen, Torgersen, Torgers…
#> $ bill_length_mm    <dbl> 39.1, 39.5, 40.3, NA, 36.7, 39.3, 38.9, 39.2, 34.1,…
#> $ bill_depth_mm     <dbl> 18.7, 17.4, 18.0, NA, 19.3, 20.6, 17.8, 19.6, 18.1,…
#> $ flipper_length_mm <int> 181, 186, 195, NA, 193, 190, 181, 195, 193, 190, 18…
#> $ body_mass_g       <int> 3750, 3800, 3250, NA, 3450, 3650, 3625, 4675, 3475,…
#> $ sex               <fct> male, female, female, NA, female, male, female, mal…
#> $ year              <int> 2007, 2007, 2007, 2007, 2007, 2007, 2007, 2007, 200…

Created on 2020-08-02 by the reprex package (v0.3.0)

User-contributed examples

Hi, thanks for great data. I love penguins :)

I made short data analysis example, which is published to R-bloggers.

and if you allow, I hope for using that post as User-contributed examples

Please let me know, if there's any issue or instruction about these process.

Thanks.

Recommend Projects

  • React photo React

    A declarative, efficient, and flexible JavaScript library for building user interfaces.

  • Vue.js photo Vue.js

    🖖 Vue.js is a progressive, incrementally-adoptable JavaScript framework for building UI on the web.

  • Typescript photo Typescript

    TypeScript is a superset of JavaScript that compiles to clean JavaScript output.

  • TensorFlow photo TensorFlow

    An Open Source Machine Learning Framework for Everyone

  • Django photo Django

    The Web framework for perfectionists with deadlines.

  • D3 photo D3

    Bring data to life with SVG, Canvas and HTML. 📊📈🎉

Recommend Topics

  • javascript

    JavaScript (JS) is a lightweight interpreted programming language with first-class functions.

  • web

    Some thing interesting about web. New door for the world.

  • server

    A server is a program made to process requests and deliver data to clients.

  • Machine learning

    Machine learning is a way of modeling and interpreting data that allows a piece of software to respond intelligently.

  • Game

    Some thing interesting about game, make everyone happy.

Recommend Org

  • Facebook photo Facebook

    We are working to build community through open source technology. NB: members must have two-factor auth.

  • Microsoft photo Microsoft

    Open source projects and samples from Microsoft.

  • Google photo Google

    Google ❤️ Open Source for everyone.

  • D3 photo D3

    Data-Driven Documents codes.