Giter Site home page Giter Site logo

phidl's Introduction

pytest pre-commit

PHIDL

GDS scripting for Python that's intuitive, fast, and powerful.

  • Installation / requirements
  • Tutorial + examples (or try an interactive notebook)
  • Geometry library + function documentation
  • Changelog (latest update 1.7.2 on July 3, 2024)
    • New KLayout-based boolean/offset/outline functions! These are under the name pg.kl_boolean(), pg.kl_offset, pg.kl_outline(), pg.kl_invert(). They utilize the excellent KLayout tile processor, which allows breaking down & parallelizing these operations--in a nutshell, these operations should be much, much faster, and they also are more robust than the gdspy/clipper implementation. To use these new functions, you must first pip install klayout
    • Path.interpolate() now allows easy placement of objects alongside a path (e.g. for placing vias). See the tutorial for more information

Citation

If you found PHIDL useful, please consider citing it in (just one!) of your publications -- we appreciate it greatly. (BibTeX)

  • McCaughan, A. N., et. al. PHIDL: Python-based layout and geometry creation for nanolithography. J. Vac. Sci. Technol. B 39, 062601 (2021). http://dx.doi.org/10.1116/6.0001203

Gallery

Installation / requirements

  • Install or upgrade with pip install -U phidl
  • Install with pip install -U phidl[all] to include optional dependencies (e.g. freetype-py, klayout, rectpack)
  • Python version >=3.6

Testing

  • Install with test dependencies with pip install -U phidl[test] (includes all extras as well)
  • Run tests with pytest (or python -m pytest)

About PHIDL

fiddle (verb) - /ˈfidl/ - to make minor manual movements, especially to adjust something

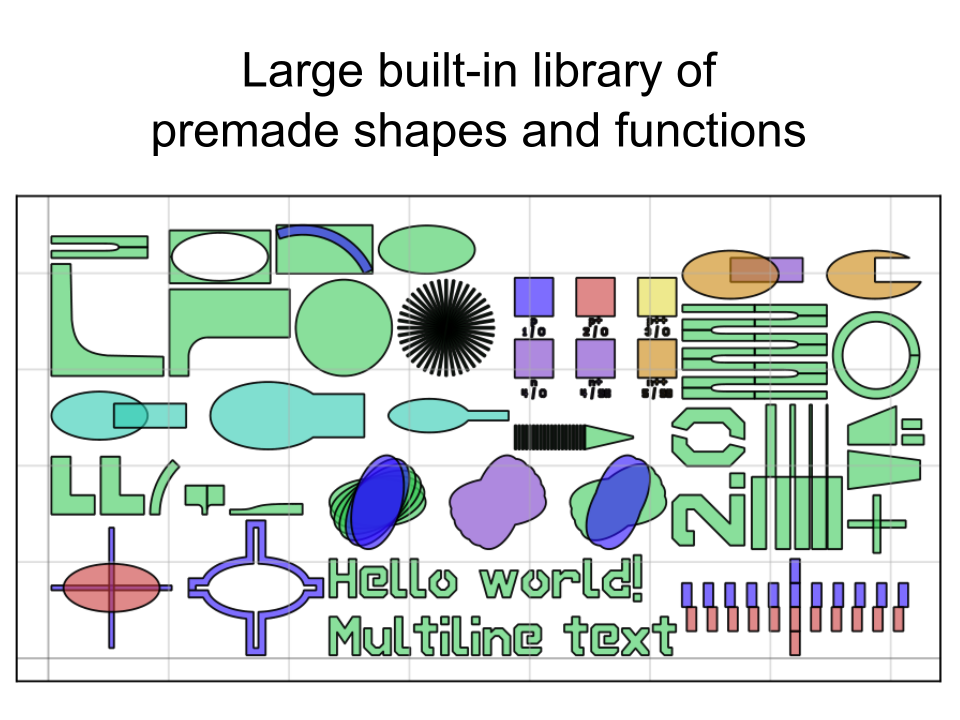
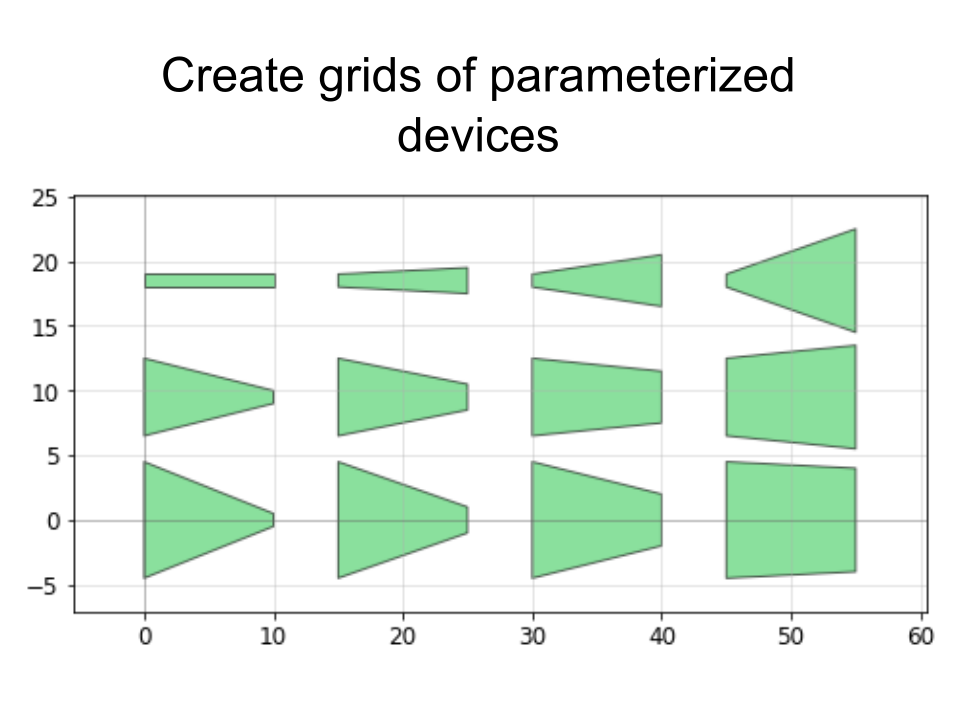
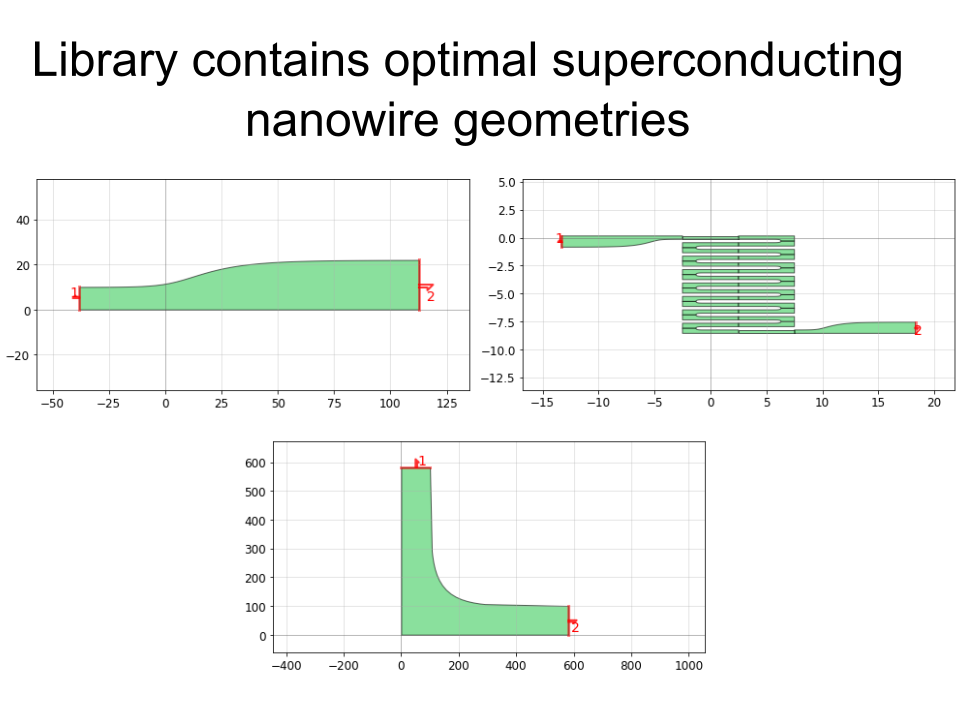
PHIDL is an open-source GDS-based CAD tool for Python that significantly extends the excellent gdspy. The base installation includes a large library of simple shapes (e.g. rectangles, circles), photonic structures (e.g. sine curve waveguides), and superconducting nanowire shapes (e.g. single photon detectors) that are fully parameterized. It also has a built-in quick-plotting function based on matplotlib (or Qt) that allows you view the state of any GDS object, useful when scripting geometry-making functions. It also has a geometry library reference and a set of very thorough tutorials that will walk you through the process of getting acquainted with PHIDL.

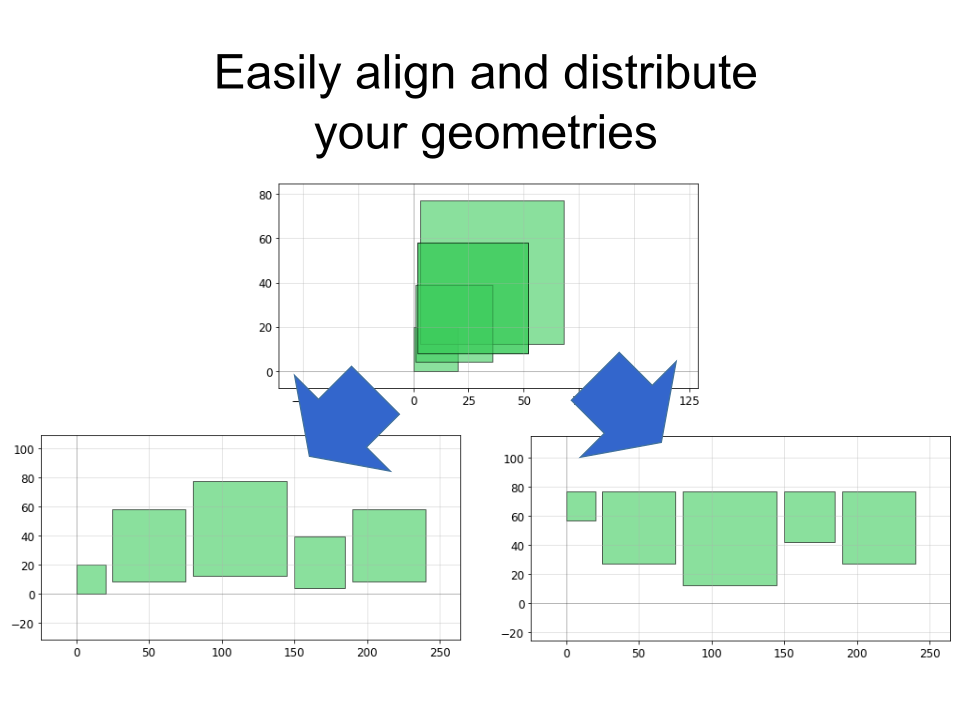
The goal is to bring the usability of Illustrator / Inkscape drawing programs to the GDS scripting world. Like Python itself, it aims to be readable, and intuitive. For instance, when building a geometry you don't have to worry about what the exact coordinates are anymore. If you want to separate two ellipses in the x direction by 5 units, you can do things like this:

ellipse1.xmin = ellipse2.xmax + 5

or if you want to move then rotate one ellipse by 45 degrees you can do

ellipse2.move([1,7]).rotate(45)

There's a few dozen shortcuts like this that make life easier built into PHIDL--they're simple, but they make a world of difference when you just want to e.g. space a ring resonator some distance from a waveguide without having to track each and every coordinate of the shape.

phidl example image

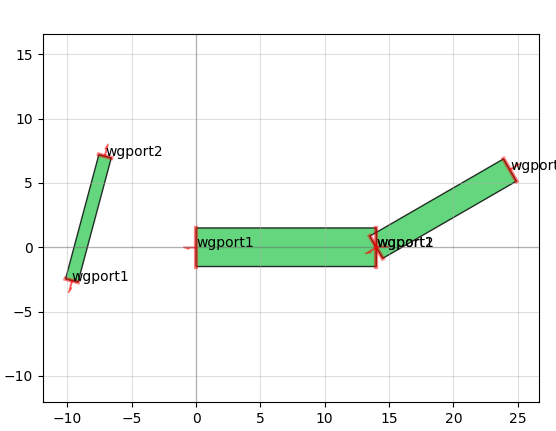
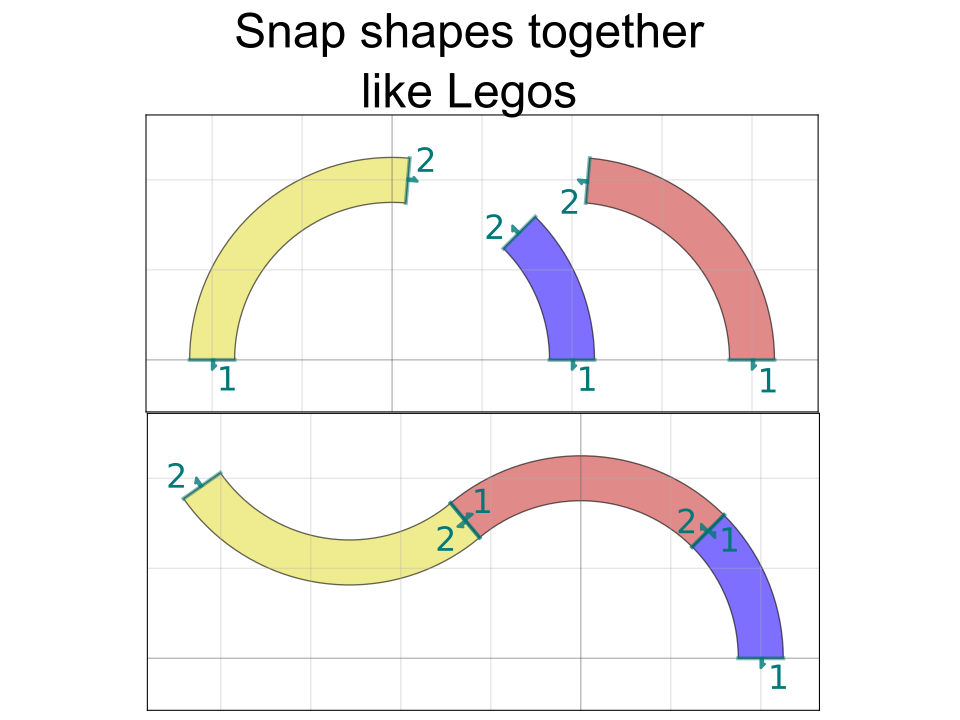
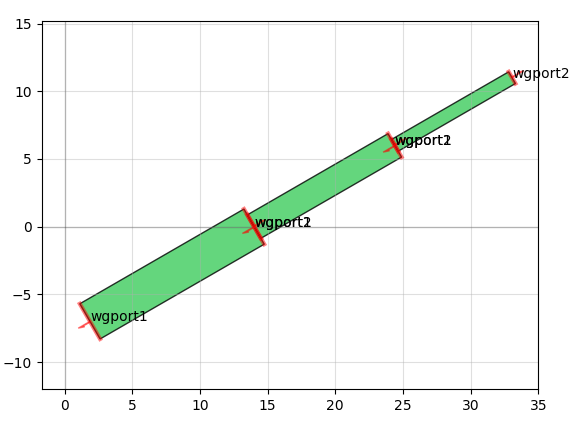
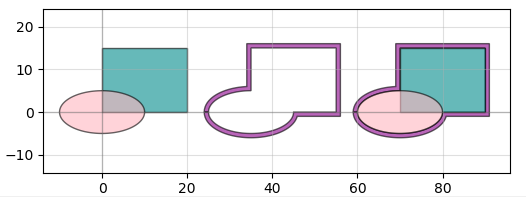
There's also a "port" functionality that allows you to snap together geometry like Legos without caring about where exactly the absolute coordinates of either geometry is. For instance, connecting the above misaligned rectangles is a two-line command:

phidl example image

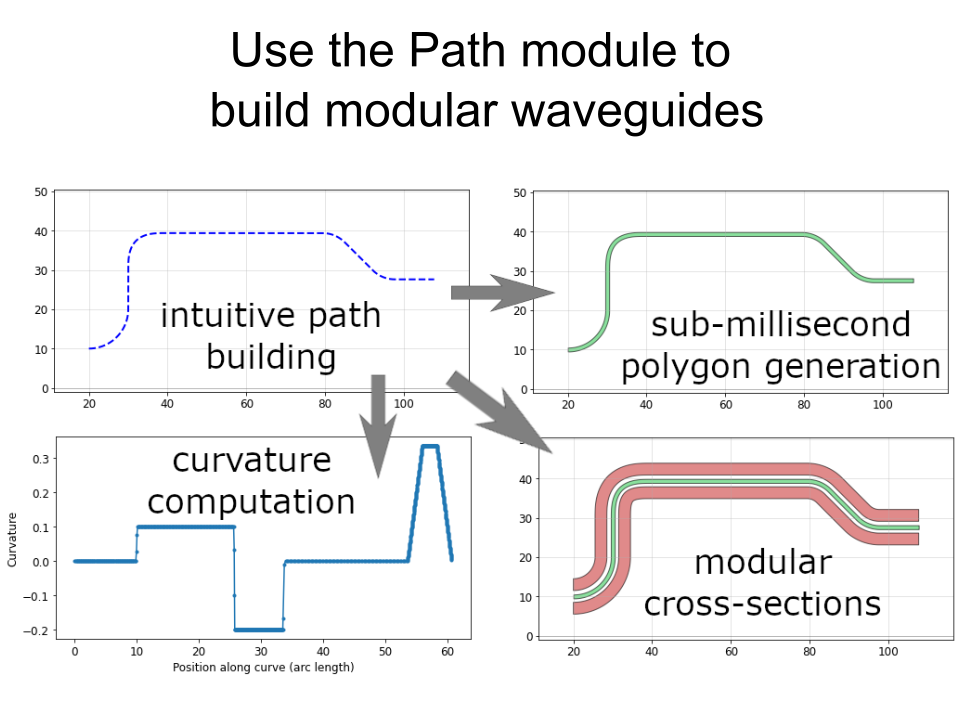
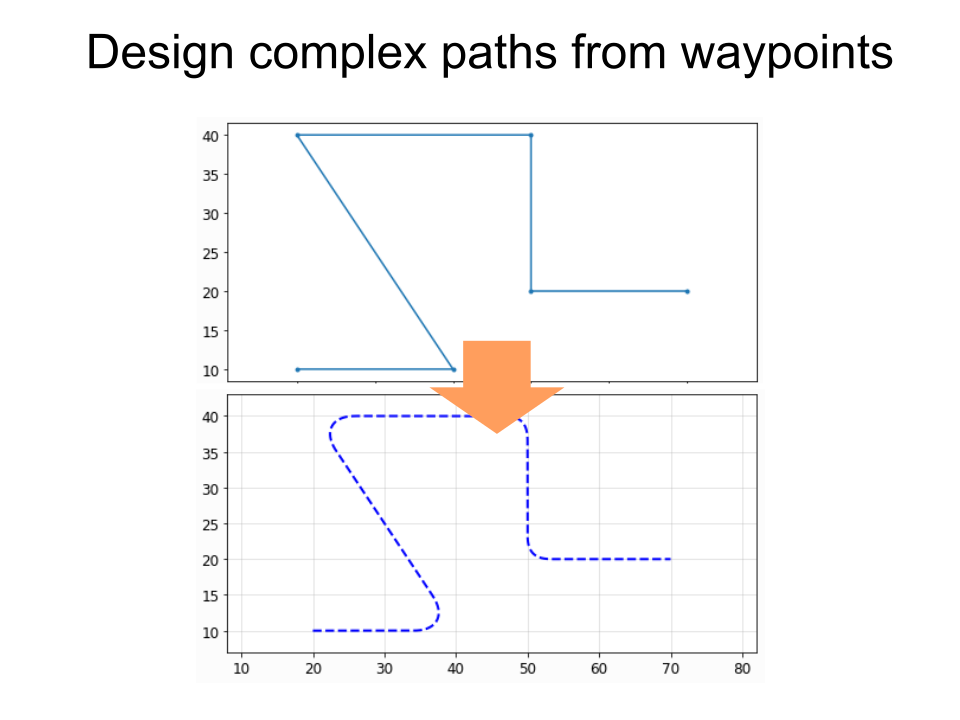
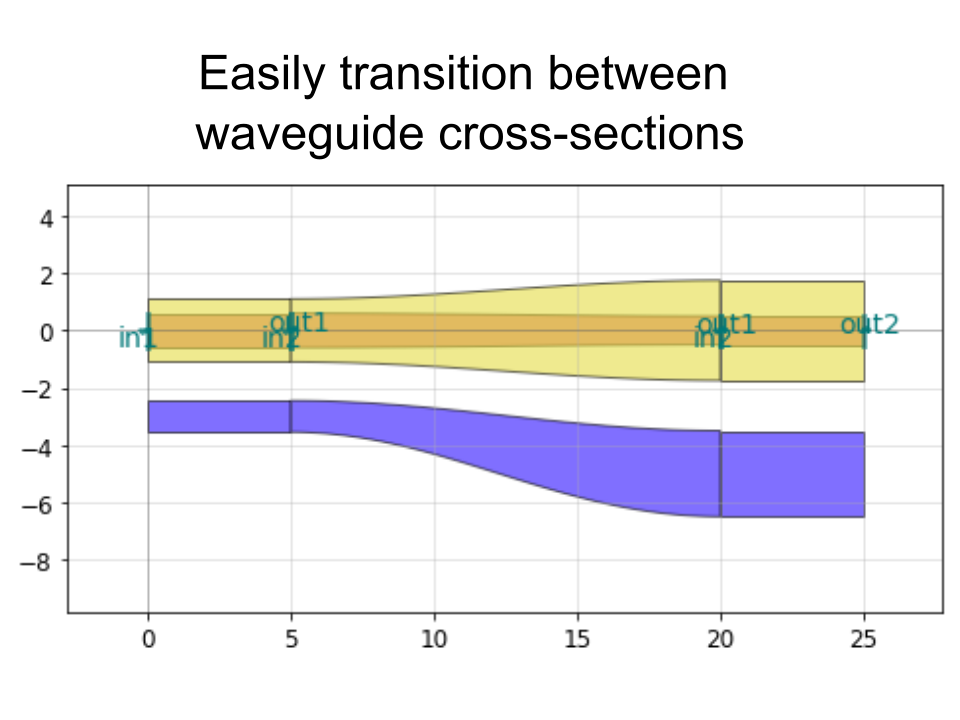
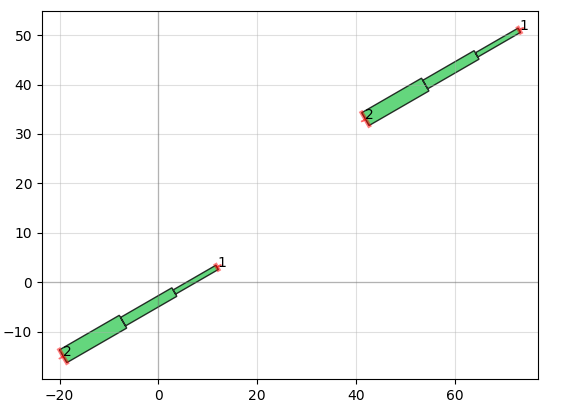
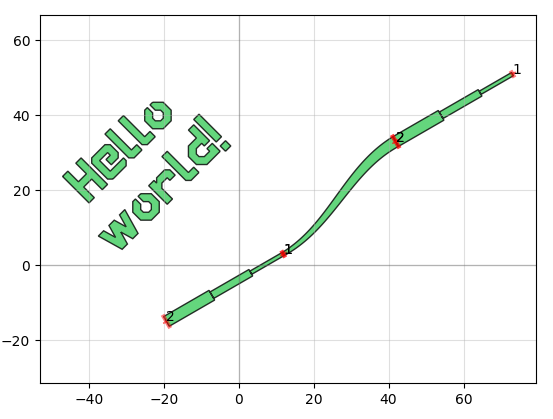
It also allows you to do things like add text and create smooth or straight routing curves between "ports" of different devices, convenient for making electrical or optical connections:

phidl example image phidl example image

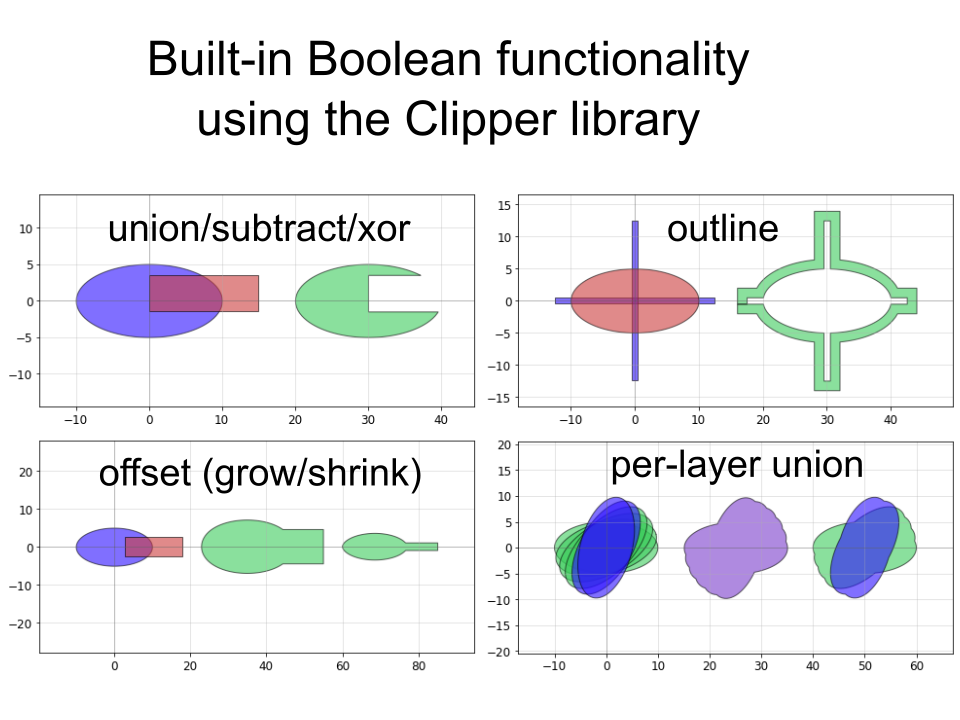
Other useful functionality available are standard operations like booleans:

phidl example image

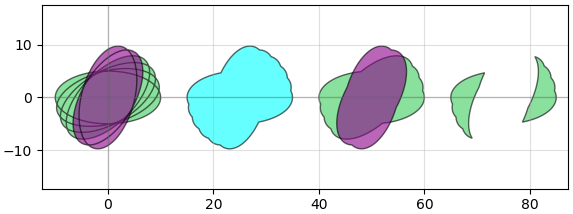
and less standard ones like creating outlines. A whole layout can be outlined directly in the GDS without requiring you to use Beamer (useful for positive-tone resist structures):

pg.outline(D, distance = 0.7, layer = 4)

phidl example image

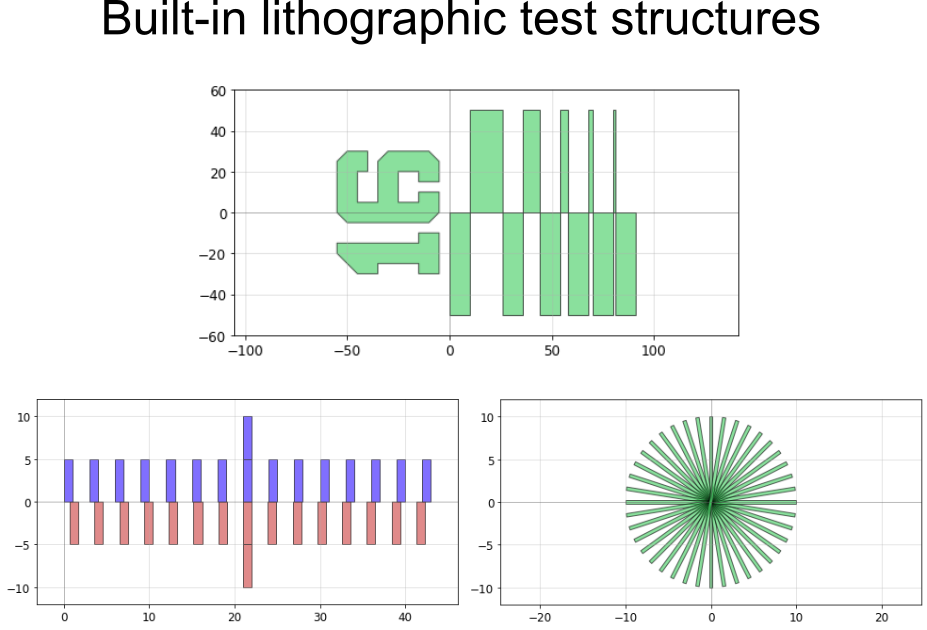
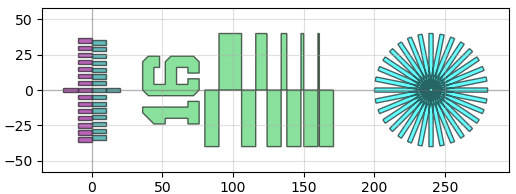
The geometry library also has useful resolution test-structures built into it, for instance

pg.litho_calipers(num_notches = 7, offset_per_notch = 0.1)
pg.litho_steps(line_widths = [1,2,4,8,16])
pg.litho_star(num_lines = 16, line_width = 3)

phidl example image

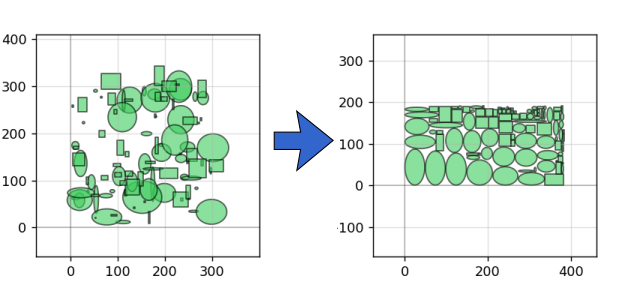
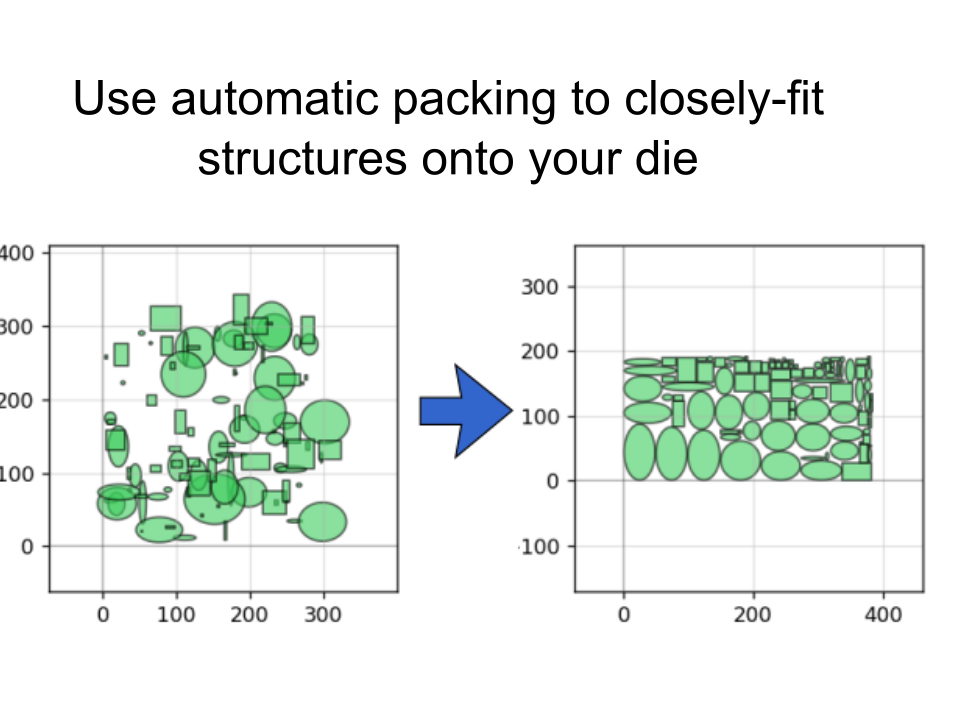
There are also handy functions to help pack shapes into as small an area as possible:

pg.packer(D_list, spacing = 1.25, aspect_ratio = (2,1))

phidl example image

phidl's People

Contributors

aganders3 avatar amccaugh avatar atait avatar basnijholt avatar bucklesm avatar dileepvr avatar dmwo avatar gyger avatar joamatab avatar jolzgrafe avatar jtchiles avatar melonisj avatar mr-roger-a avatar omedeiro avatar paniash avatar sbalk avatar spauka avatar synapticarbors avatar yoshi74ls181 avatar

Stargazers

 avatar  avatar  avatar  avatar  avatar  avatar  avatar  avatar  avatar  avatar  avatar  avatar  avatar  avatar  avatar  avatar  avatar  avatar  avatar  avatar  avatar  avatar  avatar  avatar  avatar  avatar  avatar  avatar  avatar  avatar  avatar  avatar  avatar  avatar  avatar  avatar  avatar  avatar  avatar  avatar  avatar  avatar  avatar  avatar  avatar  avatar  avatar  avatar  avatar  avatar  avatar  avatar  avatar  avatar  avatar  avatar  avatar  avatar  avatar  avatar  avatar  avatar  avatar  avatar  avatar  avatar  avatar  avatar  avatar  avatar  avatar  avatar  avatar  avatar  avatar  avatar  avatar  avatar  avatar  avatar  avatar  avatar  avatar  avatar  avatar  avatar  avatar  avatar  avatar  avatar  avatar  avatar  avatar  avatar  avatar  avatar  avatar  avatar  avatar  avatar

Watchers

 avatar  avatar  avatar  avatar  avatar  avatar  avatar  avatar  avatar  avatar  avatar  avatar  avatar  avatar  avatar  avatar  avatar

phidl's Issues

add plt.ioff() option to quickplot2()

Hi!
I would like to block script when quickplot() is called, until figure is closed.

If I run a .py script with the following code:

from phidl import quickplot as qp
import matplotlib.pyplot as plt
r=pg.rectangle()
qp(r)

the figure immediatly disappears.
It seems that i can pause for x time the script via plt.pause(x) but that doesn't really do the job for me.

I would like qp() to block script until window is closed, as in

import matplotlib.pyplot as plt
plt.ioff()
plt.figure()
plt.show()

Adding plt.ioff() before qp() doesn't work for me.
Is this something you could implement? is this already implemented?

show_subports=True in quickplot

Hi again
I noticed that when creating higher lever hierachy of cells , ports are not printed in quickplot()
Here is a test function:

import phidl.geometry as pg
from phidl.device_layout import Device,Port
from phidl import quickplot as qp
import matplotlib.pyplot as plt

r=pg.ring()

d=Device()

d<<r

r.add_port(Port('center',midpoint=(0,0),width=10))

r2=d<<r

r2.move(origin=(0,0),destination=(20,0))

d_super=Device()

d_super<<d

qp(d)

plt.pause(2)

qp(d_super)

plt.pause(2)

print('Ports in subcell',* d.get_ports(),sep='\n')
print('Ports in supercell',* d_super.get_ports(),sep='\n')

I tried replacing quickplot with quickplot2, but python3 crashes.
I read in the docs that there is a kwarg show_subports=True but it seems not to show subports.

manhattan route withg gradual bend

Hi Adam,

I noticed that phidl.routing.route_manhattan has some issues if it does not have enough space for a route

from phidl import Device, Port
from phidl.quickplotter import quickplot as qp
from phidl.routing import route_manhattan

if __name__ == "__main__":
    c = Device()

    ports1 = [
        # Port("in1", (10, 5), 0.5, 90),
        # Port("in2", (-10, 20), 0.5, 0),
        # Port("in3", (10, 30), 0.5, 0),
        # Port("in4", (-10, -5), 0.5, 90),
        # Port("in6", (0, 0), 0.5, 0),
        Port("in5", (0, 0), 0.5, 0),
    ]

    ports2 = [
        # Port("in1", (90, -60), 0.5, 180),
        # Port("in2", (-100, 20), 0.5, 0),
        # Port("in3", (100, -25), 0.5, 0),
        # Port("in4", (-150, -65), 0.5, 270),
        # Port("in6", (0, 12), 0.5, 180),
        Port("in5", (15, 6), 0.5, 180),
    ]
    N = len(ports1)

    for i in range(N):
        route = route_manhattan(ports1[i], ports2[i], radius=3, bendType="gradual")
        c.add(route.references)

    # qp(c)

image

What do you think of adding a check and raise an Error if it does not fit?

    if bendType == "gradual":
        b = _gradual_bend(radius=radius)
        radius_eff = b.xsize
    else:
        radius_eff = radius

    if (
        abs(port1.midpoint[0] - port2.midpoint[0]) < 2 * radius_eff
        or abs(port1.midpoint[1] - port2.midpoint[1]) < 2 * radius_eff
    ):
        raise ValueError(
            f"bend does not fit (radius = {radius_eff}) you need radius <",
            min(
                [
                    abs(port1.midpoint[0] - port2.midpoint[0]) / 2,
                    abs(port1.midpoint[1] - port2.midpoint[1]) / 2,
                ]
            ),
        )

CrossSections are unnamed in .gds file

Hello,

Following the tutorial for "Transitioning between cross-sections" and appending a command to write a GDS file results in the paths being "Unnamed" in the GDS cell tree. Is this a bug or am I doing something wrong?

from phidl import Device, Layer, LayerSet, Path, CrossSection
from phidl import quickplot as qp
import numpy as np
import phidl.geometry as pg
import phidl.path as pp

P = Path()
P.append( pp.arc(radius = 10, angle = 90) ) # Circular arc
P.append( pp.straight(length = 10) ) # Straight section
P.append( pp.euler(radius = 3, angle = -90) ) # Euler bend (aka "racetrack" curve)
P.append( pp.straight(length = 40) )
P.append( pp.arc(radius = 8, angle = -45) )
P.append( pp.straight(length = 10) )
P.append( pp.arc(radius = 8, angle = 45) )
P.append( pp.straight(length = 10) )

Create our first CrossSection

X1 = CrossSection()
X1.add(width = 1.2, offset = 0, layer = 2, name = 'wg', ports = ('in1', 'out1'))
X1.add(width = 2.2, offset = 0, layer = 3, name = 'etch')
X1.add(width = 1.1, offset = 3, layer = 1, name = 'wg2')

Create the second CrossSection that we want to transition to

X2 = CrossSection()
X2.add(width = 1, offset = 0, layer = 2, name = 'wg', ports = ('in2', 'out2'))
X2.add(width = 3.5, offset = 0, layer = 3, name = 'etch')
X2.add(width = 3, offset = 5, layer = 1, name = 'wg2')

To show the cross-sections, let's create two Paths and create Devices by extruding them

P1 = pp.straight(length = 5)
P2 = pp.straight(length = 5)
WG1 = P1.extrude(X1)
WG2 = P2.extrude(X2)

Place both cross-section Devices

D = Device()
wg1 = D << WG1
wg2 = D << WG2
wg2.movex(7.5)

Create the transitional CrossSection

Xtrans = pp.transition(cross_section1 = X1,
cross_section2 = X2,
width_type = 'sine')

Create a Path for the transitional CrossSection to follow

P3 = pp.straight(length = 15)

Use the transitional CrossSection to create a Device

WG_trans = P3.extrude(Xtrans)

D = Device()
wg1 = D << WG1 # First cross-section Device
wg2 = D << WG2
wgt = D << WG_trans

wgt.connect('in2', wg1.ports['out1'])
wg2.connect('in2', wgt.ports['out1'])

qp(D)

D.write_gds('TestGDS')
Capture

latest pip version (1.0.2) not working with gdspy v1.4

After downloading the latest version of phidl from pip (1.0.2), and the latest version of gdspy (1.4) I receive the following error when initialising a device (using the tutorial example).

AttributeError                            Traceback (most recent call last)
<ipython-input-6-ba05aab005b6> in <module>()
----> 1 D = Device('MultiWaveguide')

lib/python2.7/site-packages/phidl/device_layout.pyc in __init__(self, *args, **kwargs)
    445         self._internal_name = _internal_name
    446         gds_name = '%s%06d' % (self._internal_name[:20], self.uid) # Write name e.g. 'Unnamed000005'
--> 447         super(Device, self).__init__(name = gds_name, exclude_from_current=True)
    448         Device._next_uid += 1
    449 

lib/python2.7/site-packages/gdspy/__init__.pyc in __init__(self, name, exclude_from_current)
   4839     def __init__(self, name, exclude_from_current=False):
   4840         self.name = name
-> 4841         self.polygons = []
   4842         self.paths = []
   4843         self.labels = []

AttributeError: can't set attribute
 

Hierarchical Layout Question

Hi @amccaugh !
I am trying to find a way to get relative position for DeviceReferences nested in arbitrarily nested hierarchy.

I hope this scenario will clarify what I mean:

r=pg.rectangle()

p=dl.Device('parent')
rect_ref=p.add_ref(r,alias='rect_ref')

rect_ref.move(destination=(5,0))

gp=dl.Device('grandparent')
parent_ref=gp.add_ref(p,alias='parent_ref')

parent_ref.move(destination=(5,0))

Now, if I query for gp['parent_ref'].origin I will get [5 0] . However, if I type gp['parent_ref'].parent['rect_ref'].origin I will also get [5 0]. While this makes perfect sense in a simple Parent->Reference tree, I wonder if you thought of a way of returning DeviceReference properties with respect to a more nested hierarchy. (To clarify, I am looking for ways to get [10 0] in this case)

I thought about it for a bit and I don't see any obvious way of achieving this with ```phidl``, so before coding it by myself I thought of checking in with you to see whether I am missing something here.

Thanks!

non-manhattan connect

How can we connect two structures that have non-manhattan connections with offgrid ports?

import phidl.path as pp
import phidl.device_layout as pd


if __name__ == "__main__":
    c = pd.Device('non-manhattan-connect')
    b = c << pg.arc(theta=30)
    s = c << pg.straight(size=(1, 1))
    s.connect(1, b.ports[2])

image

First feedback on the waveguide work

I have seen with excitement that the wave-guide module is coming along. I wanted to add some initial feedback below, of course everything is up to you and I am aware that there is probably still a lot of movement happening at the moment.

  • Paths should be connectable with +, I think. So I am wondering if we should add the group operator #70 from + to | (for bitwise or), which also somehow reflects that both given elements are considered in the group, or we can overload the + in the Path operator as connecting path which is not so nice.
  • XSection, the name is intuitive, but somehow not smooth.
  • Could the XSection be part of the Port, always applied inward to the device?

Some more things to think of:

  • Should one track the path as a subset of paths with circular information (OASIS supports circles, and some e-beams have circle elements), so perhaps the flattening into points should only happen at the end?

I will play a little bit more with the new parts and extend this "bug" report.

support gdstk backend

Hi @amccaugh ,

I was curious if you have considered supporting gdstk as a new backend (substitute for gdspy). I think it is starting to become feature complete and on par with the original API and functionality of gdspy. Since I believe all new development is going into gdstk instead, it would be great to leverage all the great work that @heitzmann and others are putting in. Not sure if you had already considered this or looked further.

@joamatab

Extruded Paths geometric hash error

Hi Adam,

how can we get the geometric hash from a Device that comes from an extruded path?

I get an error when I do this

from phidl import CrossSection
import phidl.path as pp

X1 = CrossSection()
X1.add(width=1.2, offset=0, layer=2, ports=("in1", "out1"))
X1.add(width=2.2, offset=0, layer=3)
X1.add(width=1.1, offset=3, layer=1)

P3 = pp.straight(length=15)
c = P3.extrude(X1)
print(c.hash_geometry())

Device.flatten() TypeError

TypeError is raised when attempting to flatten a device. Repeatable using lines 630-640 of tutorial.

Paste of Traceback:

732     def flatten(self,  single_layer = None):
733         if single_layer is None:
--> 734             super(Device, self).flatten(single_layer=None, single_datatype=None, single_texttype=None)
735         else:
736             gds_layer, gds_datatype = _parse_layer(single_layer)

TypeError: flatten() got an unexpected keyword argument 'single_texttype'

np.ceil return value not safely castable to int

In routing.py the return value can not be safely cast to an int, leading to a bug in an up-to-date python stack (I am not sure when it became mandatory).
An easy fix is to explicitly cast the points for linspace in _arc. e.g.
int(np.ceil(abs(theta)/angle_resolution))

The error seen in the console will be: object of type <class 'numpy.float64'> cannot be safely interpreted as an integer

pg.boolean returns polygons where properties are the same object in memory

See:

import phidl

a = phidl.geometry.bbox(bbox=[(0, 0), (1, 2)])
b = phidl.geometry.bbox(bbox=[(0, 0.5), (1, 1.5)])
d = phidl.geometry.boolean(a, b, operation="not")

phidl.quickplot([a, b])
set(id(p.properties) for p in d.polygons)

image
and prints:

{6076552704}

which means that

d.polygons[0].properties["a"] = 1
print(d.polygons[1].properties)

prints {'a': 1}.

@joamatab, maybe also happens in gdsfactory?

quickplots not showing

Hi there.

I am having the issue where my plots aren't showing and I think it might be the same issue as described here #91,

but in the examples/tutorial you don't use set_quickplot_options(blocking=True) so I am wondering why it is not an issue for you.

Any thoughts?

Obstacles for Automated Routing

Hello,

I stumbled into this package while I was looking for a method that could be used to route from pads to device terminals automatically. First I wanted to thank you for all of this work, this is a really great idea and so far it's been a really great tool to learn how to use. I see so much potential with it!

So on to my "issue". I may have misread the "routing" documentation, but I had assumed that "obstacles" could be created and routed around using the built in phidl functions. After testing things out on my own, I've come to realize that this may not be the case, and that the "obstacles" in the documentation were simply meant to demonstrate how a user could manually tweak routing to avoid the obstacles placed in the automated routing's path.

I am essentially wondering if there is a function that I am missing that has the routing take obstacles into account when connecting port 1 to port 2? In the examples you have for simple xy routing, it works quite nicely, but generally speaking, the amount of manual intervention in the routing functions (i.e. creating a manual path per connection, or creating a large combination of "yyyxxyyy" like strings) makes using this just as time consuming as hand crafting polygons in a layout editor when the layout increases in complexity. If there is no way of automatically doing this as of now, are there any future plans to incorporate automatic recognition of "obstacles" in the routing functions?

Thanks for your time/help!

Glitch when using extrude on a spiral path

Thanks for all of your great work developing the Phidl package! I have only been using it for the past week, but I've really been enjoying the package and your nice documentation.

I encountered an issue with using the extrude function on a spiral path. Basically, it is possible it get a large glitch in object that is created:

image

I used this code to generate this image:

import phidl
import phidl.path as pp

P = pp.Path()
P.append(pp.spiral(num_turns=15.5, gap=5, inner_gap=200, num_pts=8000))
D = P.extrude(width=1)
phidl.quickplot(D)

The glitch only occurs for certain values of gap/inner_gap/width. Sometimes the glitch will appear in the center of the spiral.

Thanks!

Port add and remove

I noticed that in a situation like this:

import phidl.geometry as pg
import phidl.device_layout as dl

c=dl.Device(name='test')

p=dl.Port()

c.add_port(p)

print(c)

c.remove(p)

print(c)

the Device c doesn't lose p when it is asked to remove it.
By looking at your code, it seems that the Device.remove method tries to compare p with existing ports, but fails to recognize the identity. I implemented a magic method __eq__ for the Port, but I am not sure It will be a good implementation ( I believe I opened a "pull request" but not sure I am doing the right thing , let me know if this is any good )

GM

lazy load matplotlib

Hi Adam,

i rarely use the matplotlib ploter from phidl, so making import matplotlib as a lazy loaded module could save almost 3 seconds when importing the phidl module

image

DeprecationWarning: `np.float` is a deprecated alias for the builtin `float`

Hey, as of numpy 1.20 I'm getting this warning:

DeprecationWarning: `np.float` is a deprecated alias for the builtin `float`. To silence this warning, use `float` by itself. Doing this will not modify any behavior and is safe. If you specifically wanted the numpy scalar type, use `np.float64` here.

I could open a PR for this, but the changes necessary to solve this problem are so trivial it's probably not worth it. I think you'd need to swap np.float by np.float64 (or just float) in 3 places in device_layout.py.

pp.smooth() with collinear segments breaks

When building paths from pp.smooth(), it seems that the code breaks when collinear points are passed.

As a MWE, this code works nicely:

import phidl.path as pp

from phidl import quickplot as qp

path1=pp.smooth([(0,0),(50,0)])
import phidl.path as pp

from phidl import quickplot as qp

path1=pp.smooth([(0,0),(50,0)])

qp(path1)

However, if another point on the x axis is passed, the code breaks :

import phidl.path as pp

from phidl import quickplot as qp

path1=pp.smooth([(0,0),(50,0),(100,0)])

qp(path1)

I am trying to implement an autorouting script that would greatly benefit from this , let me know if there is any chance you can implement this!

Rename cells?

Straight question, can you rename cells?
If so, would you propose a workaround to accomplish this?
I see that there is an "_internal_name" protected variable, I would like not to touch it ( I would assume there is a reason why it's protected).
Let me know

Giuseppe

label ports not being used

Hi Adam,

thank you for your your new phidl update

I noticed that label ports are passed to the set_quickplot_options but not being used

def set_quickplot_options(show_ports = None, show_subports = None,
              label_ports = None, label_aliases = None, new_window = None,
              blocking = None, zoom_factor = None):

How can you replace a reference that has already been added?

How can you replace a reference that has already been added?

why does this not work?

This code replaces an ellipse with a ring

import phidl.device_layout as pd
import phidl.geometry as pg
from phidl import quickplot2 as qp


c = pd.Device()
c1 = c << pg.ellipse()
c2 = pg.ring()
c1.parent = c2
qp(c)

but the plot still shows the ellipse

how to move device with labels?

Hi Adam,

we still use phidl 1.0.3 because one of our tests broke on the following releases

I just wanted to check with you whether this is a bug ^^

I find it convenient to be able to move a Device that has labels on it

Thank you for your work on Phidl, it's great!

from phidl import device_layout as pd
import phidl.geometry as pg
from phidl.device_layout import Device
from phidl import quickplot as qp


def test_label_move():
    """ test that when we move a device its label also moves """
    c = Device()
    E = pg.ellipse(radii=(10, 5), layer=1)
    label = pd.gdspy.Label(
        text="demo", position=(0, 0), anchor="o", layer=66, texttype=0,
    )
    c.add(label)
    c.add_ref(E)
    c.movex(10)
    print(c.references)
    assert c.references[0].origin[0] == 10
    assert c.labels[0].position[0] == 10
    qp(c)


if __name__ == "__main__":
    test_label_move()

precision of ring

Here I try to draw a ring resonator, I think the only I need to do is just moving one of the device, ring or bus waveguide.

We say, gap=0 and width=0.8, thus, the two device should be attached without any gap.

D = Device()
WG = waveguide(100,0.8)
RG = pg.ring(50,0.8)
wg = D << WG
rg = D << RG
rg.movex(50).movey(50+1.5*0.8)
D.write_gds('test_rect.gds')

But I checked by Layout Editor and the measured value is 0.003, even with a higher writing precision.

I also found such an error increases with the ring radius (radius=200, measured gap=0.012) and doesn't occur in the case of rectangles. So it may be related to the precision of ring or other curves.

boolean operations on layers?

Is it possible to perform boolean operations on Layers, rather than Devices (i.e. similar to the functionality in KLayout) ? I tried to create and pass phidl.Layer objects when creating Devices (see below), but that didn't seem to have the desired effect. Apologies if this is already possible and I've just missed it (I couldn't find it in gdspy either) .

import phidl, phidl.geometry as pg
from phidl import quickplot as qp

l0 = phidl.Layer( 0, name = "layer0" ) 
l1 = phidl.Layer( 1, name = "layer1" ) 

r0 = pg.rectangle( layer = l0 )
r1 = pg.rectangle( layer = l1 ).movex(1)

qp( pg.boolean(A = r0, A = r1, operation = 'xor', layer = 2) )  # expected result
qp( pg.boolean(A = l0, B = l1, operation = 'xor', layer = 2)  ) # nothing there

casting issue when moving components with labels

Hi Adam,

I noticed this casting bug

import phidl.geometry as pg
from phidl import quickplot as qp
from phidl import Device

c = Device()
c << pg.ellipse(radii = (10,5))
c.add_label('hi', position=(0, 0))
c.movex(10.)

UFuncTypeError: Cannot cast ufunc 'add' output from dtype('float64') to dtype('int64') with casting rule 'same_kind'

the casting issue can only be solved by using position and movements with the same data types. For example, it works if position and movement are both int

c.add_label('hi', position=(0, 0)) c.movex(10)

or float

c.add_label('hi', position=(0., 0.))
c.movex(10.)

PHIDL won't update in anaconda navigator

Stuck on version 1.4.2 despite installing the latest version. Command 'conda list' shows version 1.5.2 but anaconda will only run 1.4.2 and will not show update available therefore cannot use gridsweep function

Release 1.6.0 might actually be v1.5.3

At least the version number didn't get incremented.

import phidl
print(phidl.__file__)
print(phidl.__version__)

produces:

c:\users\danielhickstein\downloads\phidl-1.6.0\phidl-1.6.0\phidl\__init__.py
1.5.2

Interactive ```qp``` with jupyter

Hi amccaugh.

I am trying to get interactive plots in jupyter lab cells. I am using your latest version of your dev branch phidl
(Merge: 7a86876 c618648).
To get the interactive window directly on the jupyter cell , I am using the widget backend .
If I use qt5, I do get the interactive plots, but on a separate window which is annoying...
To install widget, I use the tutorial here.

When I run the following cell from a clean kernel

%matplotlib widget

from phidl import quickplot as qp
import phidl.geometry as pg

qp(pg.circle()

The interactive plot is correctly displayed.

If I then proceed to another cell where I write

qp(pg.rectangle())

I get no output.

My question is :

  • Should I keep using widget or do you have another recommendation on the backend to pair with phidl ?

  • If I should use widget, would you recommend a solution/strategy to overcome this issue?

smooth feature request

Hi Adam,

I've reallly like the simplicity of defining routes with smooth as well as the new CrossSection.
I am thinking about simplifying the routes in gdsfactory with the new smooth function

Something that is important for photonic routes is that you want to keep the idea of a component (bend, straight) because for circuit simulations a bend and a straight will have different models

What do you think of breaking smooth into a dict of straights and bends?
How would you detect the straight paths in pp.smooth?

import numpy as np
from phidl import Device
import phidl.geometry as pg
import phidl.path as pp


def smooth(
    points,
    radius=4.0,
    bend_path_function=pp.euler,
    **kwargs,
):
    """Returns a list of Paths from a series of waypoints. Corners will be rounded
    using `bend_path_function` and any additional key word arguments (for example,
    `use_eff = True` when using `bend_path_function = pp.euler`)

    FIXME: need to extract straights

    Args:
        points: array-like[N][2] List of waypoints for the path to follow
        radius: radius of curvature, passed to `bend_path_function`
        bend_path_function: function that controls how the corners are rounded.
        **kwargs: Extra keyword arguments that will be passed to `bend_path_function`
    """
    straights = []

    points = np.asfarray(points)
    normals = np.diff(points, axis=0)
    normals = (normals.T / np.linalg.norm(normals, axis=1)).T

    dx = np.diff(points[:, 0])
    dy = np.diff(points[:, 1])
    ds = np.sqrt(dx ** 2 + dy ** 2)
    theta = np.degrees(np.arctan2(dy, dx))
    delta_theta = np.diff(theta)
    delta_theta = delta_theta - 360 * np.floor((delta_theta + 180) / 360)

    # Create arcs
    bends = []
    radii = []
    for dt in delta_theta:
        P = bend_path_function(radius=radius, angle=dt, **kwargs)
        chord = np.linalg.norm(P.points[-1, :] - P.points[0, :])
        r = (chord / 2) / np.sin(np.radians(dt / 2))
        r = np.abs(r)
        radii.append(r)
        bends.append(P)

    d = np.abs(np.array(radii) / np.tan(np.radians(180 - delta_theta) / 2))
    encroachment = np.concatenate([[0], d]) + np.concatenate([d, [0]])
    if np.any(encroachment > ds):
        raise ValueError(
            "[PHIDL] smooth(): Not enough distance between points to to fit curves."
            " Try reducing the radius or spacing the points out farther"
        )
    p1 = points[1:-1, :] - normals[:-1, :] * d[:, np.newaxis]

    # Move bends into position
    new_points = list()
    new_points.append([points[0, :]])
    for n, dt in enumerate(delta_theta):
        P = bends[n]
        P.rotate(theta[n] - 0)
        P.move(p1[n])
        new_points.append(P.points)
    new_points.append([points[-1, :]])
    new_points = np.concatenate(new_points)

    # P = Path()
    # P.rotate(theta[0])
    # P.append(new_points)
    # P.move(points[0, :])
    return dict(straights=straights, bends=bends)


def get_route(paths_dict, cross_section):
    D = Device("route")
    bends = paths_dict["bends"]
    straights = paths_dict["straights"]

    for i, path in enumerate(bends):
        bend = path.extrude(cross_section)
        bend.name = f"bend_{i}"
        D.add_ref(bend)

    for i, path in enumerate(straights):
        straight = path.extrude(cross_section)
        straight.name = f"straight_{i}"
        D.add_ref(path.extrude(cross_section))
    return D


if __name__ == "__main__":
    from phidl import Path, CrossSection
    from phidl.quickplotter import quickplot as qp

    dx = 20
    dy = 20

    paths_dict = smooth([(0, 0), (dx, 0), (dx, dy), (dx + dx, dy)])
    X = CrossSection()
    X.add(width=1, offset=0, layer=0, ports=("in", "out"))

    route = get_route(paths_dict, cross_section=X)
    qp(route)


simplify installation with conda package

Hi Adam,

some windows users have reported that is hard to install phidl/gdspy/gdsfactory on windows

I proposed them 2 options:

  1. Install the wheel for the python version that they have, for example for python 3.7 or 3.8:
pip install https://github.com/heitzmann/gdspy/releases/download/v1.6.1/gdspy-1.6.1-cp37-cp37m-win_amd64.whl
pip install https://github.com/heitzmann/gdspy/releases/download/v1.6.1/gdspy-1.6.1-cp38-cp38-win_amd64.whl
  1. Install a C++ compiler "Build Tools for Visual Studio"

A third option would be to build a conda package

how could we build a conda package for phidl, so they could install phidl with conda install phidl?

aliases behavior upon Device.add()

Hi amccaugh!
I come to you again looking for delucidations.

When using the Device.add() method, is the "destination" class supposed to store the alias for the "source" cell references?

I am trying to use such a functionality, in this example it seems that the d cell doesn't inherit the alias of the reference to r...

import phidl.device_layout as dl

r=pg.rectangle()

c=dl.Device(name='test')

c.add_ref(r,alias='r1')

d=dl.Device(name='testwrapper')

d.add(c)
print("Original Class\n")
print(c)
print("\nWrapper Cell\n")
print(d)

Bug in union?

Hey Adam,

I found that Union isn't managing to unionize some polygons. Not sure why yet. I am showing below an example.

image

Placing functions - align, distribute

Hej,
thanks for this new functions, also the packer (although I have not used that one yet, I somehow too much OCD to allow the computer to scatter my devices).

I was thinking the align function in Inkscape has this possibility to treat the selection as group, I think that would be also super nice if this could be an parameter. So align(center) does not put them on top of each other, but moves the whole group of devices in the center of the parent.

The second thing I was wondering about is distribute, if we can extend it to also allow distributing on a grid, e.g. by choosing xy as a parameter. I am unsure how to efficiently parametrize that.

device.remove() doesn't traverse its references

The following:

device = phidl.Device()
box = phidl.geometry.bbox()
ref = device.add_ref(box)
device.remove(ref.parent.polygons[0])

raises

---------------------------------------------------------------------------
ValueError                                Traceback (most recent call last)
File ~/mambaforge/envs/qms-lab-20220224-main/lib/python3.9/site-packages/phidl/device_layout.py:1556, in Device.remove(self, items)
   1555 if isinstance(item, gdspy.PolygonSet):
-> 1556     self.polygons.remove(item)
   1557 if isinstance(item, gdspy.CellReference):

ValueError: list.remove(x): x not in list

During handling of the above exception, another exception occurred:

ValueError                                Traceback (most recent call last)
Input In [35], in <module>
      2 box = phidl.geometry.bbox()
      3 ref = device.add_ref(box)
----> 4 device.remove(ref.parent.polygons[0])

File ~/mambaforge/envs/qms-lab-20220224-main/lib/python3.9/site-packages/phidl/device_layout.py:1563, in Device.remove(self, items)
   1561             self.aliases = { k:v for k, v in self.aliases.items() if v != item}
   1562         except:
-> 1563             raise ValueError("""[PHIDL] Device.remove() cannot find the
   1564                              item
   1565                              it was asked to remove in the Device:
   1566                              "%s".""" % (item))
   1568 self._bb_valid = False
   1569 return self

ValueError: [PHIDL] Device.remove() cannot find the
                                     item
                                     it was asked to remove in the Device:
                                     "Polygon (4 vertices, layer 0, datatype 0)".

I am not sure whether this is expected or whether I should expect remove to traverse down the references?

Ports are lost upon flattening

See this example:

import phidl

D = phidl.device_layout.Device()
D2 = phidl.device_layout.Device()
D2.add_port(phidl.Port("test"))
D << D2
D.flatten()

print(D.ports)

which prints an empty dict.

Spiral with smoothly varying radius of curvature

The current function to generate a spiral path features a sharp transition from a positive to a negative radius of curvature in the center of the spiral. In addition, there is a jump between two different ROCs as the spiral transitions into and out-of the center region. Also, if a straight waveguide is connected to the spiral, then there will be a jump in curvature here as well. For a real-world waveguide, this might cause loss, since the mode in a straight waveguide isn't the same as the mode in a curved waveguide. It seems like there might be a need for a spiral function that has a smoothly varying radius of curvature.

image

EDIT: here is the code for the plot:

import phidl
import phidl.path as pp
from phidl import CrossSection
import matplotlib.pyplot as plt

P = pp.Path()
P.append(pp.spiral(num_turns=15.5, gap=5, inner_gap=200, num_pts=8000))

X=CrossSection()
X.add(width=0.8, layer=1, ports=('in', 'out'))

D = P.extrude(width=1)
phidl.quickplot(D)

plt.figure()
s,K = P.curvature()
plt.plot(s,K,'.-')
plt.xlabel('Position along curve (arc length)')
plt.ylabel('Curvature');
plt.ylim(-0.025, 0.025)
plt.show()

Recommend Projects

  • React photo React

    A declarative, efficient, and flexible JavaScript library for building user interfaces.

  • Vue.js photo Vue.js

    🖖 Vue.js is a progressive, incrementally-adoptable JavaScript framework for building UI on the web.

  • Typescript photo Typescript

    TypeScript is a superset of JavaScript that compiles to clean JavaScript output.

  • TensorFlow photo TensorFlow

    An Open Source Machine Learning Framework for Everyone

  • Django photo Django

    The Web framework for perfectionists with deadlines.

  • D3 photo D3

    Bring data to life with SVG, Canvas and HTML. 📊📈🎉

Recommend Topics

  • javascript

    JavaScript (JS) is a lightweight interpreted programming language with first-class functions.

  • web

    Some thing interesting about web. New door for the world.

  • server

    A server is a program made to process requests and deliver data to clients.

  • Machine learning

    Machine learning is a way of modeling and interpreting data that allows a piece of software to respond intelligently.

  • Game

    Some thing interesting about game, make everyone happy.

Recommend Org

  • Facebook photo Facebook

    We are working to build community through open source technology. NB: members must have two-factor auth.

  • Microsoft photo Microsoft

    Open source projects and samples from Microsoft.

  • Google photo Google

    Google ❤️ Open Source for everyone.

  • D3 photo D3

    Data-Driven Documents codes.