Mmm (vegan) bacon... controlling bias and inflation in association studies using the empirical null distribution
bacon can be used to remove inflation and bias often observed in epigenome- and transcriptome-wide association studies (Iterson, Zwet, and Heijmans 2017). You can read more about it here: https://bioconductor.org/packages/release/bioc/vignettes/bacon/inst/doc/bacon.html
#try http:// if https:// URLs are not supported
source("https://bioconductor.org/biocLite.R")
biocLite("bacon")
require(bacon)This doesn't work if you try to run it on test statistics from METAL. Very small effects and SEs are rounded to 0, so we can't calculate a z score :(
z <- dat$beta / dat$se
bc <- bacon(z)
bc
estimates(bc)
inflation(bc)
bias(bc)
Histogram of Z-scores - with standard normal (black) and estimated empirical null distribution (red)
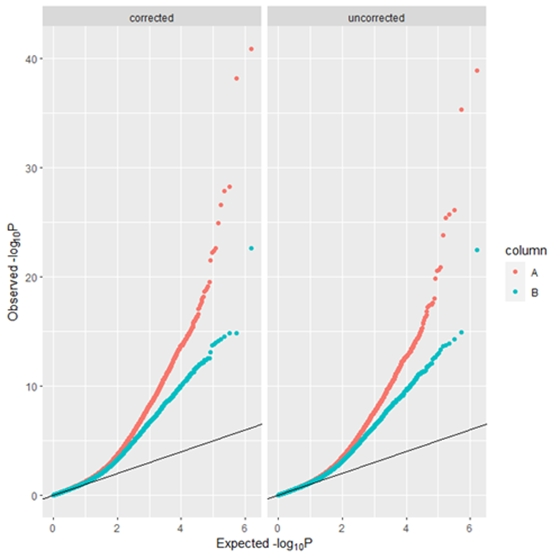
plot(bc, type="hist")QQ plots of -log10 transformed P-values - left panel using uncorrected P-values and right panel using bacon bias and inflation corrected P-values
plot(bc, type="qq")Youll probably want to run this in parallel
library(BiocParallel)
register(MulticoreParam(1, log=TRUE))
es is a matrix of effect sizes (beta coefficients) and se is a matrix of the equivalent standard errors. Each row is a probe and each column is a study.
bc <- bacon(NULL, es, se)
bc
estimates(bc)
inflation(bc)
bias(bc)
plot(bc, type="hist")
plot(bc, type="qq")You'll probably want to run this in parallel
library(BiocParallel)
register(MulticoreParam(1, log=TRUE))
bc <- bacon(NULL, es, se)
bc
bcm <- meta(bc)
head(pval(bcm))
print(topTable(bcm))
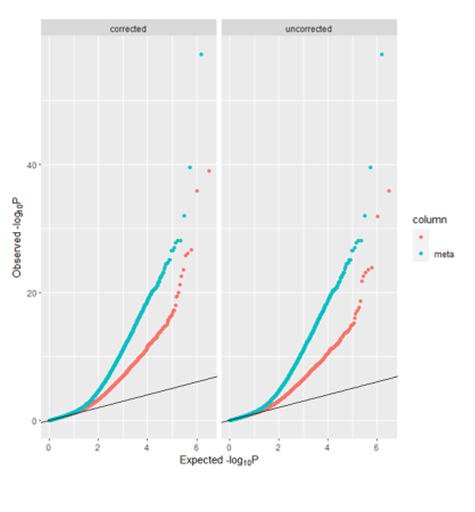
plot(bcm, type="qq")An example using the PACE BMI results
load("/Volumes/filestore/Documents/IEU work/PACE/Maternal BMI/Results/Meta-analysis/BMI/BMI_1_random1.Rdata")
es<-na.omit(as.matrix(M_C[,grep(colnames(M_C),pattern="_beta")]))
se<-na.omit(as.matrix(M_C[,grep(colnames(M_C),pattern="_se")]))
bacon doesn't appear to cope with NAs, and since not every cohort supplied results for every probe, there are a lot of NAs. In fact there are only 255,514 probes
How have other people got round this?