CoSaMP algorithm in Python.
How to install:
pip install cosamp
or
pip3 install cosamp
Dependencies: numpy.
@Input:  Phi - Sampling matrix
          u   - Noisy sample vector
          s   - Sparsity vector

@Return: A s-sparse approximation "a" of the target signal
Using CoSaMP algorithm to reconstruct a high-frequency signal from sparse measurements:
import numpy as np
import scipy.linalg
import scipy.signal
import matplotlib.pyplot as plt
from cosamp import cosamp
n = 100 # number of measurements
t = np.linspace(0.0, 1.0, num=n)
x = np.sin(91*2*np.pi*t) + np.sin(412*2*np.pi*t) # original signal (to be reconstructed)
# randomly sample signal
p = 103 # random sampling (Note that this is one eighth of the Shannon–Nyquist rate!)
aquis = np.round((n-1) * np.random.rand(p)).astype(int)
y = x[aquis] # our compressed measurement from the random sampling
# Here {y} = [C]{x} = [C][Phi]{s}, where Phi is the inverse discrete cosine transform
Phi = scipy.fft.dct(np.eye(n), axis=0, norm='ortho')
CPhi = Phi[aquis,:]
# l1 minimization (through linear programming)
s = cosamp.cosamp(CPhi, y, 10) # obtain the sparse vector through CoSaMP algorithm
xrec = scipy.fft.idct(s, axis=0, norm='ortho') # Reconstructed signal
figw, figh = 7.0, 5.0 # figure width and height
plt.figure(figsize=(figw, figh))
plt.plot(t, s)
plt.title('Sparse vector $s$')
plt.show()
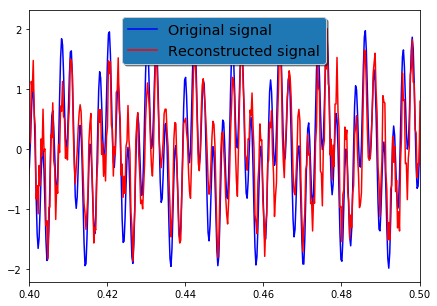
# Visualize the compressed-sensing reconstruction signal
figw, figh = 7.0, 5.0 # figure width and height
plt.figure(figsize=(figw, figh))
plt.plot(t, x, 'b', label='Original signal')
plt.plot(t, xrec, 'r', label='Reconstructed signal')
plt.xlim(0.4, 0.5)
legend = plt.legend(loc='upper center', shadow=True, fontsize='x-large')
# Put a nicer background color on the legend.
legend.get_frame().set_facecolor('C0')
plt.show()
MATLAB versions of the algorithm are readly available (see here for instance). This Python method is based on the MATLAB routine written by Prof. Bob L. Sturm.
The original Needell and Tropp's 2008 paper can be found here.
