Giter Site home page Giter Site logo

appmetrics / elasticsearch Goto Github PK

View Code? Open in Web Editor NEW
18.0 18.0 20.0 253 KB

App Metrics Extensions for Elasticsearch reporting

Home Page: http://app-metrics.io/getting-started/reporting/index.html

License: Apache License 2.0

C# 91.85% PowerShell 5.10% Shell 3.05%
dotnet-core elasticsearch grafana metrics monitoring

elasticsearch's Introduction

App Metrics App Metrics

Official Site License Donate

What is App Metrics?

App Metrics is an open-source and cross-platform .NET library used to record metrics within an application. App Metrics can run on .NET Core or on the full .NET framework. App Metrics abstracts away the underlaying repository of your Metrics for example InfluxDB, Graphite, Prometheus etc, by sampling and aggregating in memory and providing extensibility points to flush metrics to a repository at a specified interval.

App Metrics provides various metric types to measure things such as the rate of requests, counting the number of user logins over time, measure the time taken to execute a database query, measure the amount of free memory and so on. Metrics types supported are Gauges, Counters, Meters, Histograms and Timers and Application Performance Indexes Apdex.

App.Metrics includes an Exponentially Forward Decaying, Sliding Window and Algorithm R reservoir implementations. For more details on reservoir sampling see the docs.

Documentation

Latest Builds, Packages & Repo Stats

Branch Azure Devops
dev Azure Devops
main AppVeyor

Visualization

Dashboards can be imported from Grafana

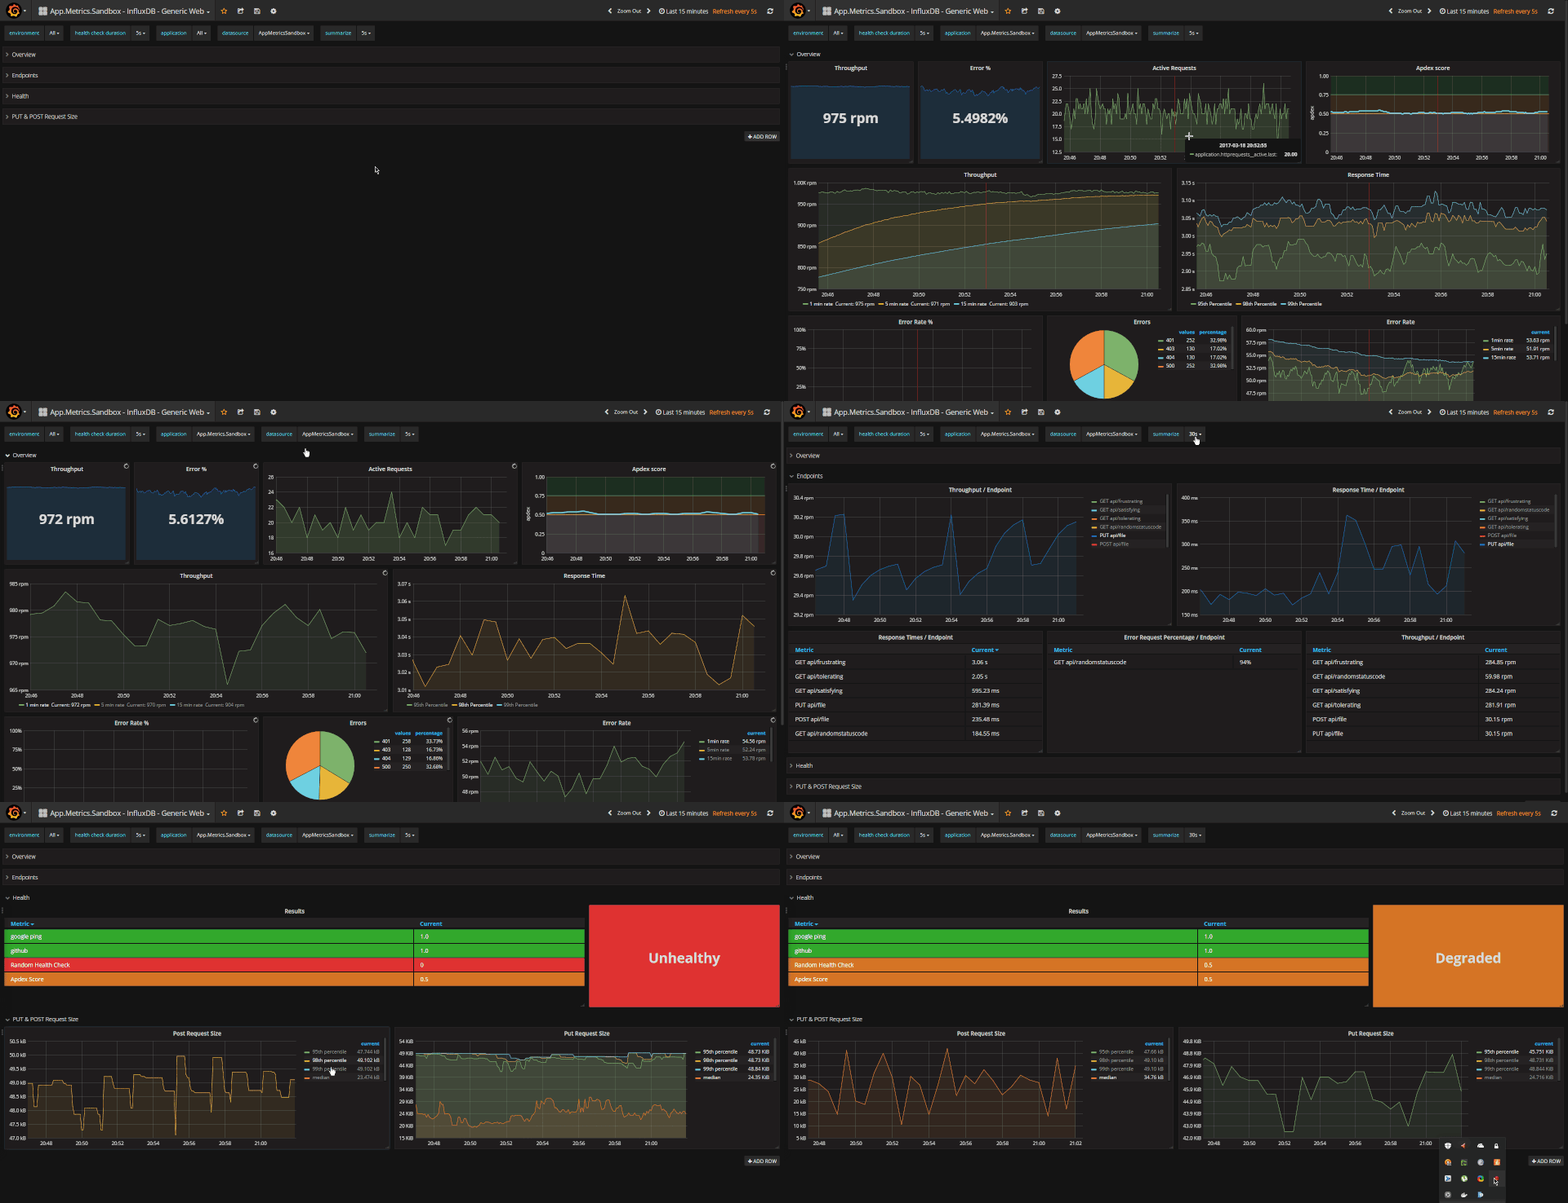
Grafana Web Monitoring

Grafana/InfluxDB Generic Web Dashboard Demo

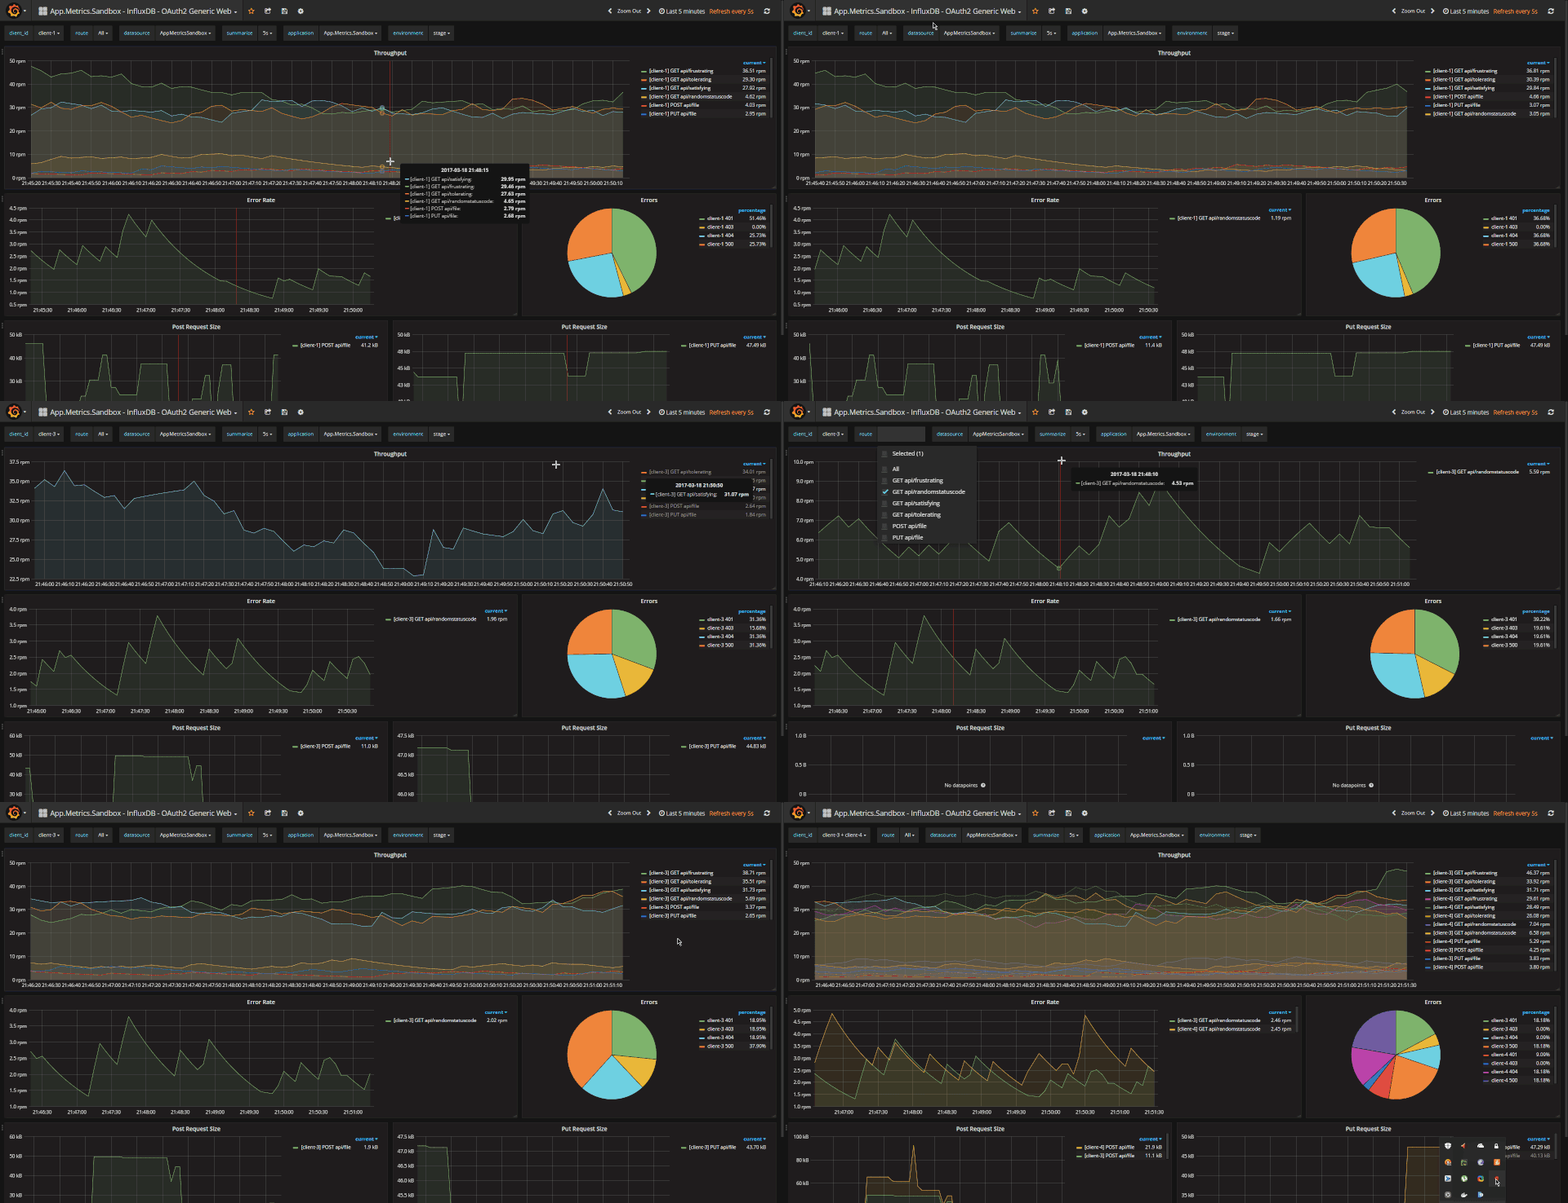
Grafana OAuth2 Client Web Monitoring

Grafana/InfluxDB Generic OAuth2 Web Dashboard Demo

How to build

Azure Devops builds are triggered on commits and PRs to the dev branch

  • Install the latest .NET Core 2.x SDK
  • Run build.ps1 or build.sh in the root of the repository

How to run benchmarks

App.Metrics includes benchmarking using BenchmarkDotNet.

Two benchmark projects exist targeting App.Metrics.Core and App.Metrics.Concurrency

	cd .\src\Core\benchmarks\App.Metrics.Benchmarks.Runner
	dotnet run -c "Release" --framework netcoreapp3.1

	cd .\src\Concurrency\benchmarks\App.Metrics.Concurrency.Benchmarks.Runner
	dotnet run -c "Release" --framework netcoreapp3.1

You'll then be prompted to choose a benchmark to run which will output a markdown file with the result in directory.

You can find the benchmark results here and here.

Contributing

See the contribution guidlines for details.

Acknowledgements

Thanks for providing free open source licensing

License

This library is release under Apache 2.0 License ( see LICENSE ) Copyright (c) 2016 Allan Hardy

See LICENSE


App Metrics is based on the Metrics.NET library, and at the moment uses the same reservoir sampling code from the original library which is a port of the Java Dropwizard Metrics library.

Metrics.NET Licensed under these terms: "Metrics.NET is release under Apache 2.0 License Copyright (c) 2014 Iulian Margarintescu" see LICENSE

Dropwizard Metrics Licensed under these terms*: "Copyright (c) 2010-2013 Coda Hale, Yammer.com Published under Apache Software License 2.0, see LICENSE"

elasticsearch's People

Contributors

alhardy avatar jenyayel avatar koenmetsu avatar linezero avatar majian159 avatar rethorique avatar

Stargazers

 avatar  avatar  avatar  avatar  avatar  avatar  avatar  avatar  avatar  avatar  avatar  avatar  avatar  avatar  avatar  avatar  avatar  avatar

Watchers

 avatar  avatar  avatar  avatar  avatar  avatar  avatar

elasticsearch's Issues

There is a bug in grafana's elasticsearch template

Error Rate there is always data.
search query missing space characters.

old:
name:application.httprequests__error_rateAND tags.env:$environment AND tags.app:$application AND tags.server:$server
new:
name:application.httprequests__error_rate AND tags.env:$environment AND tags.app:$application AND tags.server:$server

System.MissingMethodException on call to .Report.ToElasticSearch()

Hi - I'm trying to use version 2.0.0-alpha in my project, and am stumbling at the first hurdle with an exception being thrown from the call to .Report.ToElasticSearch() on startup

I'm using the overload which takes the string url and elasticsearchIndex arguments

System.MissingMethodException
HResult=0x80131513
Message=Method not found: 'Void App.Metrics.GeneratedMetricNameMapping..ctor(System.Collections.Generic.IDictionary2<App.Metrics.HistogramValueDataKeys,System.String>, System.Collections.Generic.IDictionary2<App.Metrics.MeterValueDataKeys,System.String>, System.Collections.Generic.IDictionary2<App.Metrics.ApdexValueDataKeys,System.String>, System.Collections.Generic.IDictionary2<App.Metrics.CounterValueDataKeys,System.String>)'.
Source=App.Metrics.Formatters.Elasticsearch
StackTrace:
at App.Metrics.Formatters.Elasticsearch.MetricsElasticsearchDocumentFormattingOptions..ctor()
at App.Metrics.Formatters.Elasticsearch.MetricsElasticsearchOutputFormatter..ctor(String elasticsearchIndex)
at App.Metrics.Reporting.Elasticsearch.ElasticsearchReporter..ctor(MetricsReportingElasticsearchOptions options, IElasticsearchClient elasticsearchClient)
at App.Metrics.MetricsElasticsearchReporterBuilder.ToElasticsearch(IMetricsReportingBuilder metricReporterProviderBuilder, String url, String elasticsearchIndex)
..........

is this currently a known issue? Thanks

Wrong mapping fields names for webtracking with ElasticSearch

In the doc (https://www.app-metrics.io/reporting/reporters/elasticsearch/) it is recommended to create an index and to send the mapping :

Add an index and the document mappings to Elasticsearch using the default mappings provided in the github repository

But when i send this command to ES :

PUT appmetricssandbox/_mapping/timer?update_all_types
{
  "properties": {
    "tags.env": { 
      "type":     "text",
      "fielddata": true
    },
    "tags.exception": { 
      "type":     "text",
      "fielddata": true
    },
    "tags.app": { 
      "type":     "text",
      "fielddata": true
    },
    "tags.route": { 
      "type":     "text",
      "fielddata": true
    },
    "tags.server": { 
      "type":     "text",
      "fielddata": true
    },
    "tags.item": { 
      "type":     "text",
      "fielddata": true
    },
    "tags.client_id": { 
      "type":     "text",
      "fielddata": true
    },
    "tags.http_status_code": { 
      "type":     "text",
      "fielddata": true
    },
    "tags.health_check_name": { 
      "type":     "text",
      "fielddata": true
    }
  }
}

I get this error for ES :

{
"error": {
"root_cause": [
{
"type": "mapper_parsing_exception",
"reason": "Field name [tags.env] cannot contain '.'"
}
],
"type": "mapper_parsing_exception",
"reason": "Field name [tags.env] cannot contain '.'"
},
"status": 400
}

Grafana dashboard doesn't work

I use elastic search 5.x + grafana 5.x + asp net core 2.
Index and mappings are the same like in this file https://github.com/AppMetrics/Elasticsearch/blob/dev/visualization/App.Metrics.Sandbox-Elasticsearch-IndexAndMappingSetup.json but I had to add one more property
timestamp": { "type": "date", "format": "epoch_millis" }
in each type mappings because I was not able to create data source in grafana without some date property (need to specify this in "Time field name" input).

Part of Program.cs

public static IWebHost BuildWebHost(string[] args) =>
            WebHost.CreateDefaultBuilder(args)
                .ConfigureMetricsWithDefaults(builder => 
                {
                    builder.Report.ToElasticsearch(options =>
                    {
                        options.Elasticsearch.Index = "appmetricssandbox";
                        options.Elasticsearch.BaseUri = new Uri("http://127.0.0.1:9200");
                        options.Elasticsearch.AuthorizationSchema = ElasticSearchAuthorizationSchemes.Anonymous;
                        options.HttpPolicy.BackoffPeriod = TimeSpan.FromSeconds(30);
                        options.HttpPolicy.FailuresBeforeBackoff = 5;
                        options.HttpPolicy.Timeout = TimeSpan.FromSeconds(10);
                        options.MetricsOutputFormatter = new MetricsJsonOutputFormatter();
                        options.FlushInterval = TimeSpan.FromSeconds(20);
                        options.Filter = new MetricsFilter().WhereType(MetricType.Timer);
                    });
                })
                .UseMetrics()
                .UseStartup<Startup>()
                .Build();

And in configure services method I have

public void ConfigureServices(IServiceCollection services)
{
         services.AddMvc().AddMetrics();
}

Error in grafana

{
    "root_cause": [
        {
            "type": "query_shard_exception",
            "reason": "Failed to parse query [name:application.httprequests__active AND tags.env: AND tags.app: AND tags.server:()]",
            "index_uuid": "Nt8ntKjkS-qM8VrbhHrxDw",
            "index": "appmetricssandbox"
        }
    ],
    "type": "search_phase_execution_exception",
    "reason": "all shards failed",
    "phase": "query",
    "grouped": true,
    "failed_shards": [
        {
            "shard": 0,
            "index": "appmetricssandbox",
            "node": "3tw4J0WDQGKTYKvrzUbtgQ",
            "reason": {
                "type": "query_shard_exception",
                "reason": "Failed to parse query [name:application.httprequests__active AND tags.env: AND tags.app: AND tags.server:()]",
                "index_uuid": "Nt8ntKjkS-qM8VrbhHrxDw",
                "index": "appmetricssandbox",
                "caused_by": {
                    "type": "parse_exception",
                    "reason": "Cannot parse 'name:application.httprequests__active AND tags.env: AND tags.app: AND tags.server:()': Encountered \"  \"AND \"\" at line 1, column 52.\r\nWas expecting one of:\r\n     ...\r\n    \"(\" ...\r\n    \"*\" ...\r\n     ...\r\n     ...\r\n     ...\r\n     ...\r\n     ...\r\n    \"[\" ...\r\n    \"{\" ...\r\n     ...\r\n    ",
                    "caused_by": {
                        "type": "parse_exception",
                        "reason": "Encountered \"  \"AND \"\" at line 1, column 52.\r\nWas expecting one of:\r\n     ...\r\n    \"(\" ...\r\n    \"*\" ...\r\n     ...\r\n     ...\r\n     ...\r\n     ...\r\n     ...\r\n    \"[\" ...\r\n    \"{\" ...\r\n     ...\r\n    "
                    }
                }
            }
        }
    ]
}

Dashboard was added using ID from this page https://grafana.com/dashboards/2140 .
In my asp net core project I use App.Metrics.AspNetCore.Mvc and App.Metrics.Reporting.Elasticsearch.

Spent some time with research and didn't find any useful solution. What I need to change to start it work ?
Thanks

State of project

Hi,

We would like to use AppMetrics for our metric needs, we use ELK stack for monitoring.
Seeing that this repository was not updated in a while, wondering is there any plans to update this reporter to latest AppMetrics version?

Thank you!

Has this project been abandoned?

Hi just wantet to ask whether this project is still active or not? If not, it would be nice if it were mentioned in the description of the repo or the repo was to be archived!

_bulk api call not compatible with ES 6.2

I can't say if this is a bug because I don't really know the intent of the code. It seems that _bulk is being used in order to send multiple events to ES.

One thing I noticed is that the endpoint used is not _bulk for the configured index but at the ES app root. The index endpoint is preferred: /{index}/_bulk or {index}/{type}/_bulk instead of /_bulk

\r\n is being used in the payload which is not allowed except for delimiting records.

It could be that a recent ES version changed the format but the docs don't specify a required version. The payload seems all wrong for the bulk API.

Recommend Projects

  • React photo React

    A declarative, efficient, and flexible JavaScript library for building user interfaces.

  • Vue.js photo Vue.js

    ๐Ÿ–– Vue.js is a progressive, incrementally-adoptable JavaScript framework for building UI on the web.

  • Typescript photo Typescript

    TypeScript is a superset of JavaScript that compiles to clean JavaScript output.

  • TensorFlow photo TensorFlow

    An Open Source Machine Learning Framework for Everyone

  • Django photo Django

    The Web framework for perfectionists with deadlines.

  • D3 photo D3

    Bring data to life with SVG, Canvas and HTML. ๐Ÿ“Š๐Ÿ“ˆ๐ŸŽ‰

Recommend Topics

  • javascript

    JavaScript (JS) is a lightweight interpreted programming language with first-class functions.

  • web

    Some thing interesting about web. New door for the world.

  • server

    A server is a program made to process requests and deliver data to clients.

  • Machine learning

    Machine learning is a way of modeling and interpreting data that allows a piece of software to respond intelligently.

  • Game

    Some thing interesting about game, make everyone happy.

Recommend Org

  • Facebook photo Facebook

    We are working to build community through open source technology. NB: members must have two-factor auth.

  • Microsoft photo Microsoft

    Open source projects and samples from Microsoft.

  • Google photo Google

    Google โค๏ธ Open Source for everyone.

  • D3 photo D3

    Data-Driven Documents codes.