
Sea level rise and extreme value analysis for Boston tide gauge using IPCC AR6 projections
Cover image credit: "Boston Harbor, Sunset" by Fitz Henry Lane


Python implementation of the sea level and storm surge analysis found in Lempert et al. (2012) and Oddo et al. (2017). Generates sea level rise scenarios consistent with projections from Chapter 9 of Working Group 1 contribution to the Intergovernmental Panel on Climate Change (IPCC) Sixth Assessment Report. Performs generalized extreme value (GEV) analysis on Boston tide records using annual block maxima approach and Markov Chain Monte Carlo (MCMC).
Original R code authors:
Clone repository to your device:
git clone https://github.com/pcoddo/boston-tides.gitCreate conda environment using provided environment.yml file:
conda env create -f environment.yml
conda activate tides
Install noaa-coops package to access NOAA Tides and Currents API:
pip install noaa-coops
Launch Jupyter Notebook:
jupyter notebookThe following Jupyter Notebooks outline the three stages of the analysis:
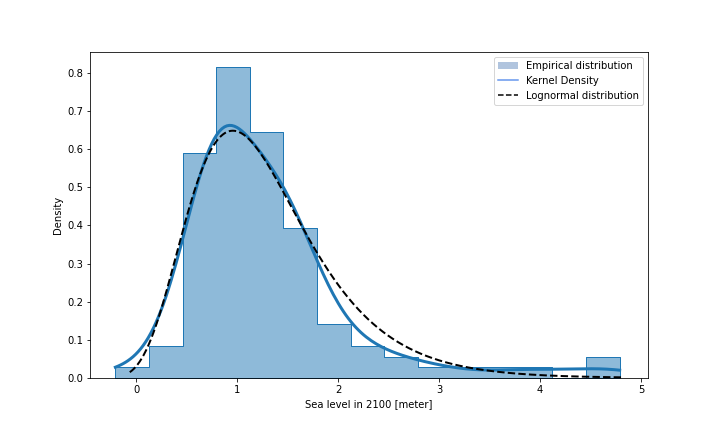
ar6_fit_distribution.ipynbFits a lognormal distribution to the IPCC AR6 empirical sea level projections for the year 2100.
Output | Parameters for fitted lognormal distribution to use as target for sea level rise scenarios:
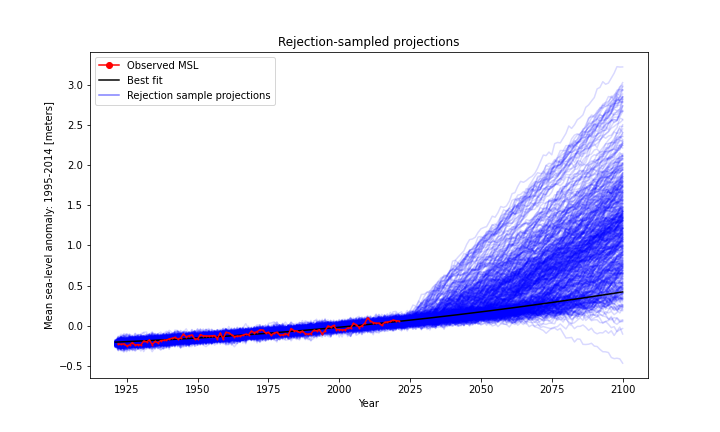
boston_slr.ipynbUses rejection sampling approach to generate uncertain sea level rise scenarios consistent with the IPCC expert assessment.
Output | Sea level rise scenarios from 2021 to 2100, corresponding to target distribution:
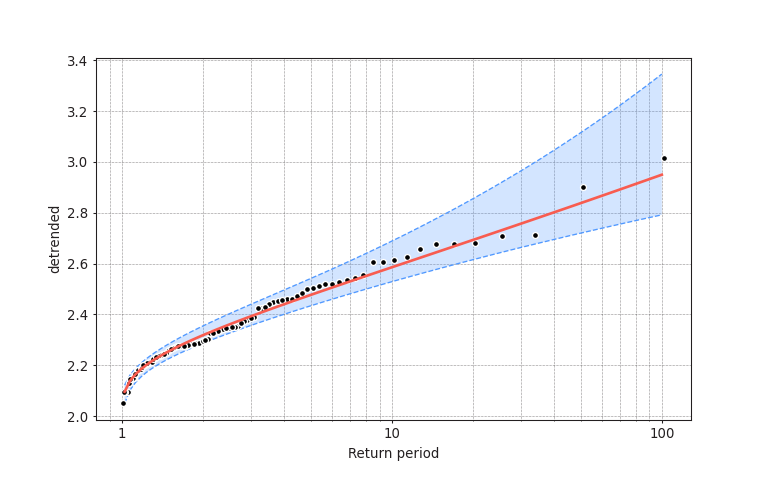
boston_gev.ipynbPerforms a generalized extreme value (GEV) analysis for the Boston tide gauge using block maxima and Markov Chain Monte Carlo (MCMC). Analysis based on pyextremes package.
Output | Return levels based on annual block maxima at Boston tide gauge. Also produces trace plots and distributions for GEV shape, location, and scale parameters:
Python version 3.7+
Packages:
- ipython
- matplotlib
- scipy
- ipykernel
- scikit-learn
- statsmodels
- ipywidgets
- openpyxl
- netcdf4
- seaborn
- fitter
- easydev
- pyextremes
- noaa-coops
-
Lempert, R., Sriver, R. L., & Keller, K. (2012). Characterizing Uncertain Sea Level Rise Projections to Support Investment Decisions (No. CEC-500-2012-056). California Energy Commission Sacramento, CA, USA. Retrieved from https://www.rand.org/pubs/external_publications/EP51475.html
-
Oddo, P. C., Lee, B. S., Garner, G. G., Srikrishnan, V., Reed, P. M., Forest, C. E., & Keller, K. (2017). Deep Uncertainties in Sea-Level Rise and Storm Surge Projections: Implications for Coastal Flood Risk Management. Risk Analysis. https://doi.org/10.1111/risa.12888
-
Talke, S. A., Kemp, A. C., & Woodruff, J. (2018). Relative Sea Level, Tides, and Extreme Water Levels in Boston Harbor From 1825 to 2018. Journal of Geophysical Research: Oceans, 123(6), 3895–3914. https://doi.org/https://doi.org/10.1029/2017JC013645
-
Fox-Kemper, B., H. T. Hewitt, C. Xiao, G. Aðalgeirsdóttir, S. S. Drijfhout, T. L. Edwards, N. R. Golledge, M. Hemer, R. E. Kopp, G. Krinner, A. Mix, D. Notz, S. Nowicki, I. S. Nurhati, L. Ruiz, J-B. Sallée, A. B. A. Slangen, Y. Yu, 2021, Ocean, Cryosphere and Sea Level Change. In: Climate Change 2021: The Physical Science Basis. Contribution of Working Group I to the Sixth Assessment Report of the Intergovernmental Panel on Climate Change [Masson-Delmotte, V., P. Zhai, A. Pirani, S. L. Connors, C. Péan, S. Berger, N. Caud, Y. Chen, L. Goldfarb, M. I. Gomis, M. Huang, K. Leitzell, E. Lonnoy, J. B. R. Matthews, T. K. Maycock, T. Waterfield, O. Yelekçi, R. Yu and B. Zhou (eds.)]. Cambridge University Press. In press.
-
Garner, G. G., R. E. Kopp, T. Hermans, A. B. A. Slangen, G. Koubbe, M. Turilli, S. Jha, T. L. Edwards, A. Levermann, S. Nowikci, M. D. Palmer, C. Smith, in prep. Framework for Assessing Changes To Sea-level (FACTS). Geoscientific Model Development.
-
Garner, G. G., T. Hermans, R. E. Kopp, A. B. A. Slangen, T. L. Edwards, A. Levermann, S. Nowikci, M. D. Palmer, C. Smith, B. Fox-Kemper, H. T. Hewitt, C. Xiao, G. Aðalgeirsdóttir, S. S. Drijfhout, T. L. Edwards, N. R. Golledge, M. Hemer, R. E. Kopp, G. Krinner, A. Mix, D. Notz, S. Nowicki, I. S. Nurhati, L. Ruiz, J-B. Sallée, Y. Yu, L. Hua, T. Palmer, B. Pearson, 2021. IPCC AR6 Sea-Level Rise Projections. Version 20210809. PO.DAAC, CA, USA. Dataset accessed [2021-10-26] at https://podaac.jpl.nasa.gov/announcements/2021-08-09-Sea-level-projections-from-the-IPCC-6th-Assessment-Report.
We thank the projection authors for developing and making the sea-level rise projections available, multiple funding agencies for supporting the development of the projections, and the NASA Sea-Level Change Team for developing and hosting the IPCC AR6 Sea-Level Projection Tool. Special thanks to Gregory Garner for providing subset of full projections for the Boston tide gauge.
Contact: Perry Oddo
