- Classify algorithms by measuring runtime for a range of problem sizes.
For this lab we provide a class called Profiler that contains code for running code with a range of problem sizes, measuring runtimes, then plotting and analyzing the results.
You will use Profiler to measure and classify the performance of the add method for the Java implementations of ArrayList and LinkedList.
Here's an example that shows how to use the profiler:
	public static void profileArrayListAddEnd() {
		Timeable timeable = new Timeable() {
			List<String> list;

			public void setup(int n) {
				list = new ArrayList<String>();
			}

			public void timeMe(int n) {
				for (int i=0; i<n; i++) {
					list.add("a string");
				}
			}
		};

		String title = "ArrayList add end";
		Profiler profiler = new Profiler(title, timeable);

		int startN = 4000;
		int endMillis = 1000;
		XYSeries series = profiler.timingLoop(startN, endMillis);
		profiler.plotResults(series);
	}
This method measures the time it takes to run add on an ArrayList, which adds the new element at the end. We'll explain the code and then show the results.
In order to use Profiler, we need to create a Timeable object that provides two methods: setup and timeMe. The setup method does whatever needs to be done before we start the clock; in this case it creates an empty list. Then timeMe does whatever operation we are trying to measure; in this case it adds n elements to the list.
The code that creates timeable is an anonymous class that defines a new implementation of the Timeable interface and creates an instance of the new class at the same time. If you are not familiar with anonymous classes, you can read about them here. But you really don't need to know much for this lab; even if you are not comfortable with anonymous classes, you can do the exercises by copying and modifying the example code.
The next step is to create the Profiler object, passing the Timeable object and a title as parameters.
The Profiler provides timingLoop which uses the Timeable object stored as an attribute. It invokes the timeMe method on the Timeable object several times with a range of values of n. timingLoop takes two parameters:
-
startNis the value ofnthe timing loop should start at. -
endMillisis a threshold in milliseconds. AstimingLoopincreases the problem size, the runtime increases; when the runtime exceeds this threshold,timingLoopstops.
When you run these experiments, you might have to adjust these parameters. If startN is too low, the runtime might be too short to measure accurately. If endMillis is too low, you might not get enough data to see a clear relationship between problem size and run time.
This code is in ProfileAdd.java, which you'll run in the next lab. When we ran it, we got this output:
4000, 3
8000, 0
16000, 1
32000, 2
64000, 3
128000, 6
256000, 18
512000, 30
1024000, 88
2048000, 185
4096000, 242
8192000, 544
16384000, 1325
The first column is problem size, n; the second column is runtime in milliseconds. The first few measurements are pretty noisy, it might have been better to set startN around 64000.
The result from timingLoop is an XYSeries that contains this data. If you pass this series to plotResults, it generates a plot like this:
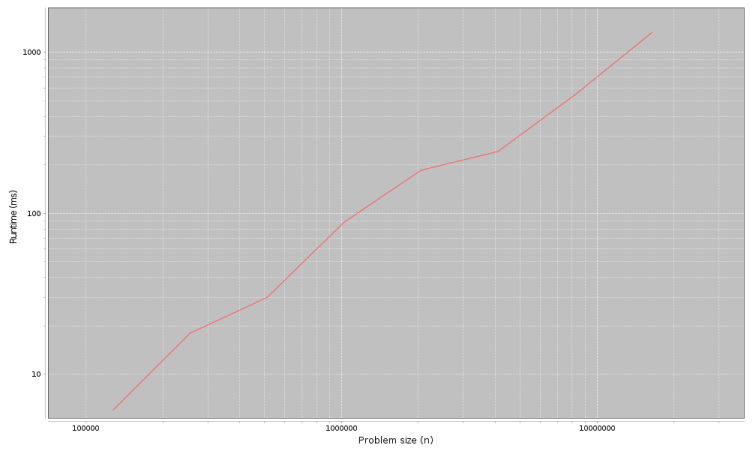
The next section explains how to interpret it.
Based on our understanding of how ArrayList works, we expect the add method to take constant time when we add elements to the end. So the total time to add n elements should be linear.
To test that theory, we could plot total runtime versus problem size, and we should see a straight line, at least for problem sizes that are big enough to measure accurately. Mathematically, we can write the function for that line:
runtime = a + b * n
Where a is the intercept of the line and b is the slope.
On the other hand, if add is linear, the total time for n adds would be quadratic. If we plot runtime versus problem size, we expect to see a parabola. Or mathematically, something like:
runtime = a + b * n + c * n2
With perfect data, we might be able to tell the difference between a straight line and a parabola, but if the measurements are noisy, it can be hard to tell. A better way to interpret noisy measurements is to plot runtime and problem size on a log-log scale.
Why? Let's suppose that runtime is proportional to nk, but we don't know what the exponent k is. We can write the relationship like this:
runtime = a + b * n + ... + c * nk
For large values of n, the term with the largest exponent is the most important, so:
runtime ≈ c * nk
Where ≈ is the symbol for "approximately equal". Now, if we take the log of both sides of this equation:
log(runtime) ≈ log(c) + k * log(n)
This equation implies that if we plot runtime versus n on a log-log scale, we expect to see a straight line with intercept log(c) and slope k. We don't care much about the intercept, but the slope indicates the order of growth: if k==1, the algorithm is linear; if k==2, it's quadratic.
Looking at the figure in the previous section, you can estimate the slope by eye. But when you call plotResults it computes a least squares fit to the data and prints the estimated slope. In this example:
Estimated slope= 1.06194352346708
Which is close to 1; and that suggests that the total time for n adds is linear, so each add is constant time, as expected.
One important point: if you see a straight line on a graph like this, that does not mean that the algorithm is linear. If the run time is proportional to nk for any exponent k, we expect to see a straight line with slope k. If the slope is close to 1, that suggests the algorithm is linear. If it is close to 2, it's probably quadratic.
When you check out the respository for this lab, you should find a file structure similar to what you saw in previous labs. The top level directory contains CONTRIBUTING.md, LICENSE.md, README.md, and the directory that contains the code for this lab, javacs-lab04.
In the subdirectory javacs-lab04/src/com/flatironschool/javacs you'll find the source files you need for this lab:
-
Profiler.javacontains the implementation of theProfilerclass described above. You will use this class, but you don't have to know how it works. But feel free to read the source. -
ProfileAdd.javacontains starter code for this lab, including the example, above, which profilesArrayList.add. You will modify this file to profile a few other methods.
Also, in javacs-lab04, you'll find the Ant build file build.xml.
-
In
javacs-lab04runant ProfileAddto runProfileAdd.java. You should get results similar to ours, but you might have to adjuststartNorendMillis. The estimated slope should be close to 1, indicating that performingnadd operations takes time proportional tonraised to the exponent 1; that is, it is O(n). -
In
ProfileAdd.java, you'll find an empty method namedprofileArrayListAddBeginning. Fill in the body of this method with code that testsArrayList.add, always putting the new element at the beginning. If you start with a copy ofprofileArrayListAddEnd, you should only have to make a few changes. Add a line inmainto invoke this method.Run
ant ProfileAddagain and interpret the results. Based on our understanding of howArrayListworks, we expect each add operation to be linear, so the total time fornadds should be quadratic. If so, the estimated slope of the line, on a log-log scale, should be near 2. Is it? -
Now let's compare that to the performance of
LinkedList. Fill in the body ofprofileLinkedListAddBeginningand use it to classifyLinkedList.addwhen we put the new element at the beginning. What performance do you expect? Are the results consistent with your expectations? -
Finally, fill in the body of
profileLinkedListAddEndand use it to classifyLinkedList.addwhen we put the new element at the end. What performance do you expect? Are the results consistent with your expectations?
We'll present our results and answer these questions in the next README.
Anonymous classes: Java tutorial.


