![]()


CLASSIX is a fast and explainable clustering algorithm based on sorting. Here are a few highlights:
- Ability to cluster low and high-dimensional data of arbitrary shape efficiently
- Ability to detect and deal with outliers in the data
- Ability to provide textual explanations for the generated clusters
- Full reproducibility of all tests in the accompanying paper
- Support of Cython compilation
CLASSIX is a contrived acronym of CLustering by Aggregation with Sorting-based Indexing and the letter X for explainability. CLASSIX clustering consists of two phases, namely a greedy aggregation phase of the sorted data into groups of nearby data points, followed by a merging phase of groups into clusters. The algorithm is controlled by two parameters, namely the distance parameter radius for the group aggregation and a minPts parameter controlling the minimal cluster size.
Here is a video abstract of CLASSIX:

A detailed documentation (work in progress), including tutorials, is available at .
CLASSIX has the following dependencies:
- cython (recommend >= 0.27)
- numpy >=1.7.3 (recommend <= 1.21.0)
- scipy >= 1.2.1
- requests
- matplotlib
- pandas
If you want to compare the speed with other clustering algorithms in scikit-learn or other packages using Cython, please also use CLASSIX with Cython for a fair comparison. To double check whether you are using the Cython installation or not, please use:
import classix
classix.cython_is_available(verbose=1)
If needed, you can disable Cython using
classix.__enable_cython__ = FalseTo install the current CLASSIX release via PIP use:
pip install classixclustering
To check the CLASSIX installation use:
python -m pip show classixclustering
To install CLASSIX via conda use:
conda install -c conda-forge classixclustering
To show the installed version use:
conda list classixclustering
Download this repository via:
git clone https://github.com/nla-group/classix.git
Here is an example clustering a synthetic dataset:
from sklearn import datasets
from classix import CLASSIX

# Generate synthetic data
X, y = datasets.make_blobs(n_samples=5000, centers=2, n_features=2, random_state=1)

# Call CLASSIX
clx = CLASSIX(radius=0.35, verbose=0)
clx.fit(X)
The cluster labels of each data point are available in clx.labels_:
import matplotlib.pyplot as plt
plt.figure(figsize=(10,10))
plt.scatter(X[:,0], X[:,1], c=clx.labels_)
plt.show()CLASSIX provides an API for the easy visualization of clusters and to explain the assignment of data points to their clusters. To get an overview of the data, the location of starting points, and their associated groups, type:
clx.explain(plot=True)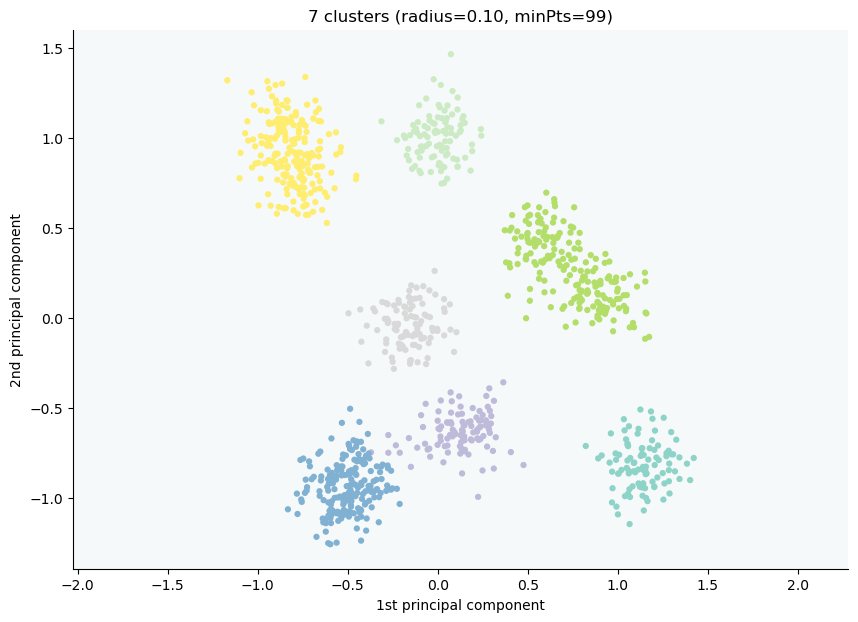
The starting points, shown as the small red boxes, can be thought of as a coarse representation of the data. Each starting point is associated with a group of data points, and groups are merged into clusters. The explain method returns a textual summary of the clustering:
A clustering of 5000 data points with 2 features has been performed.
The radius parameter was set to 0.50 and MinPts was set to 0.
As the provided data has been scaled by a factor of 1/6.01,
data points within a radius of R=0.50*6.01=3.01 were aggregated into groups.
In total 7903 comparisons were required (1.58 comparisons per data point).
This resulted in 14 groups, each uniquely associated with a starting point.
These 14 groups were subsequently merged into 2 clusters.
A list of all starting points is shown below.
----------------------------------------
 Group  NrPts  Cluster  Coordinates
   0     398      0     -1.19 -1.09
   1    1073      0     -0.65 -1.15
   2     553      0     -1.17 -0.56
  ---      lines omitted        ---
  11       6      1       0.42 1.35
  12       5      1       1.24 0.59
  13       2      1        1.0 1.08
----------------------------------------
In order to explain the clustering of individual data points,
use .explain(ind1) or .explain(ind1, ind2) with indices of the data points.
In the above table, Group denotes the group label, NrPts denotes the number of data points in the group, Cluster is the cluster label assigned to the group, and the final column shows the normalized Coordinates of the starting point. In order to explain the cluster assignment of a particular data point, simply provide its index to the explain method:
clx.explain(0, plot=True)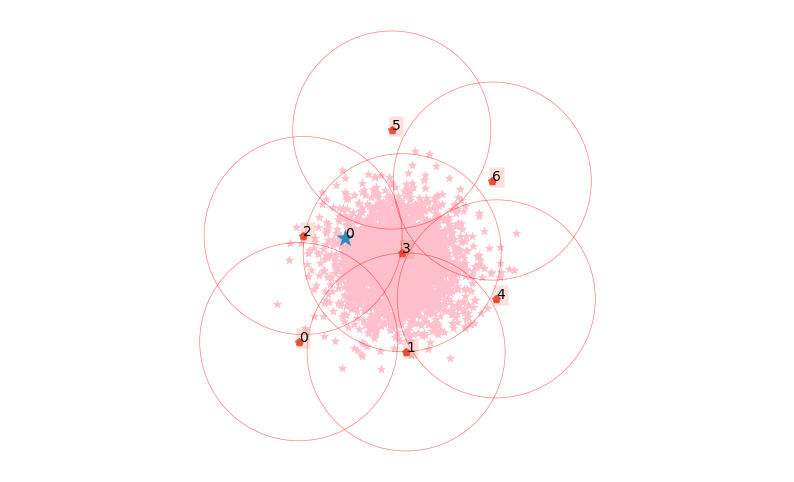
The data point 0 is in group 2, which has been merged into cluster #0.
We can also query why two data points ended up in the same cluster, or not:
clx.explain(0, 2000, plot=True)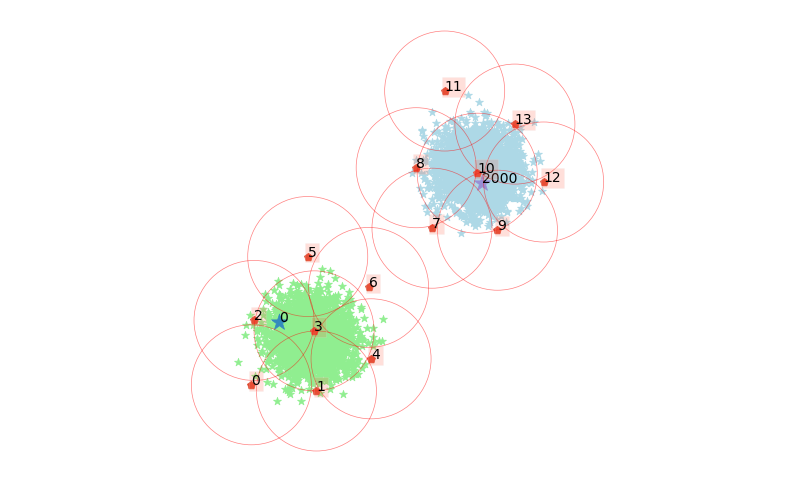
The data point 0 is in group 2, which has been merged into cluster 0.
The data point 2000 is in group 10, which has been merged into cluster 1.
There is no path of overlapping groups between these clusters.
CLASSIX also supports dataframes and using dataframe indices to refer to data points:
from sklearn import datasets
from classix import CLASSIX
import pandas as pd

X, _ = datasets.make_blobs(n_samples=5, centers=2, n_features=2, cluster_std=1.5, random_state=1)
X = pd.DataFrame(X, index=['Anna', 'Bert', 'Carl', 'Tom', 'Bob'])

#            0     |     1
# Anna | -7.804551 | -7.043560
# Bert | -9.519154 | -4.327404
# Carl | -0.361448 |  0.954182
# Tom  |  0.957658 |  3.264680
# Bob  | -2.451818 |  2.797037

clx = CLASSIX(radius=0.5)
clx.fit_transform(X)
clx.explain(index1='Tom', index2='Bert', plot=True, sp_fontsize=12)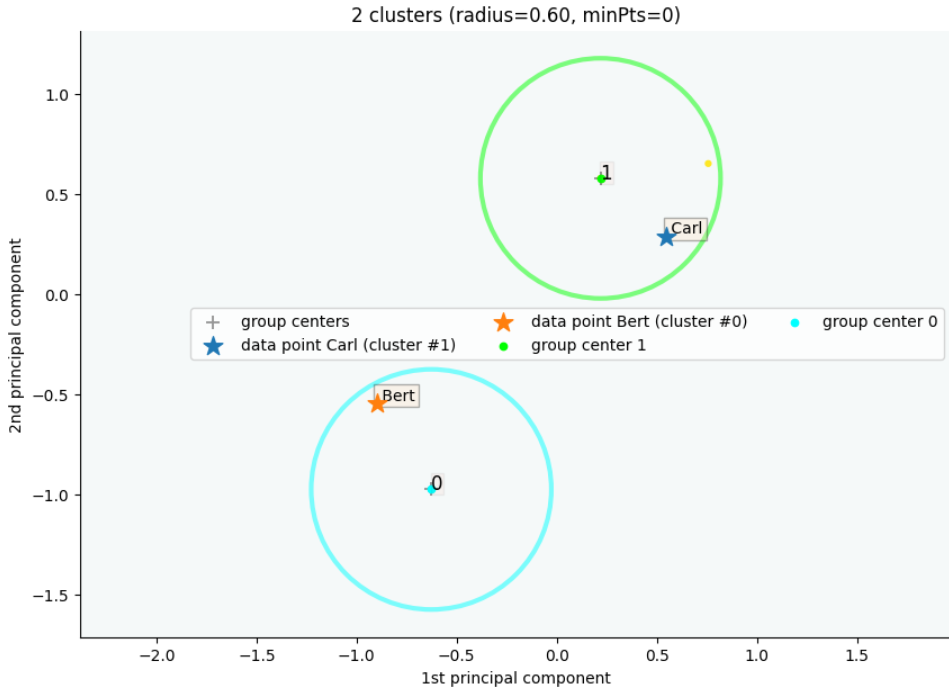
----------------------------------------
 Group  NrPts  Cluster Coordinates  Label
   3      1       0      0.76 0.65    Tom
   1      1       1     -0.9 -0.55   Bert
----------------------------------------
The data point Tom is in group 3, which has been merged into cluster 0.
The data point Bert is in group 1, which has been merged into cluster 1.
There is no path of overlapping groups between these clusters.
Generally, we recommend first running CLASSIX with a relatively large radius parameter, such as radius=1, and minPts=0. It also helps to use verbose=1 to get more detailed feedback from the method. Typically, the larger the radius parameter, the faster the method performs and the smaller the number of computed clusters. If the number of clusters is too small, successively reduce the radius parameter until a "good" (depending on context) number of meaningful clusters is obtained.
If there are unwanted "noise" clusters containing just a small number of data points, increase the minPts parameter to remove them. If, for example, minPts=14, all clusters with fewer than 14 data points will be reassigned to larger clusters. Here is an example that demonstrates the effect of minPts:
from sklearn import datasets
from classix import CLASSIX
# generate synthetic data
X, y = datasets.make_blobs(n_samples=1000, centers=2, n_features=2, random_state=0)
# run CLASSIX
clx = CLASSIX(sorting='pca', radius=0.15, group_merging='density', verbose=1, minPts=14, post_alloc=False)
clx.fit(X)
# draw figure
plt.figure(figsize=(8,8))
plt.rcParams['axes.facecolor'] = 'white'
plt.scatter(X[:,0], X[:,1], c=clx.labels_)
plt.xticks([])
plt.yticks([])
plt.show()
Output:
CLASSIX(sorting='pca', radius=0.15, minPts=14, group_merging='density')
The 1000 data points were aggregated into 212 groups.
In total 5675 comparisons were required (5.67 comparisons per data point).
The 212 groups were merged into 41 clusters with the following sizes:
      * cluster 0 : 454
      * cluster 1 : 440
      * cluster 2 : 13
      * cluster 3 : 10
      * cluster 4 : 7
    --- lines omitted ---
      * cluster 38 : 1
      * cluster 39 : 1
      * cluster 40 : 1
As MinPts is 14, the number of clusters has been further reduced to 3.
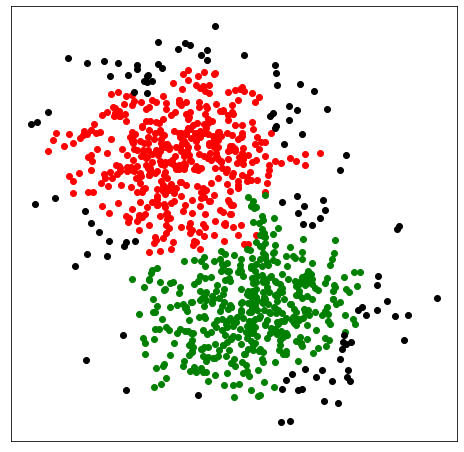
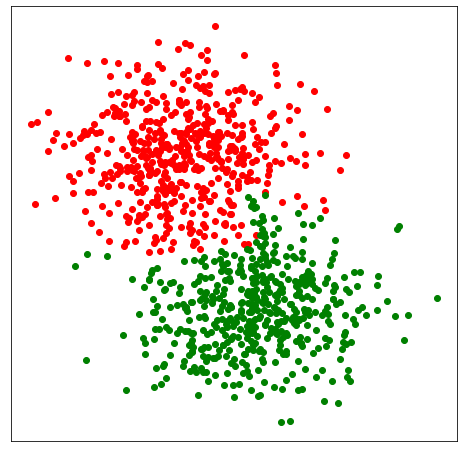
Note that there are many clusters with fewer than 14 data points. Because minPts=14 and post_alloc=False all of these tiny clusters are labelled as noise with the label -1. We can also reallocate noisy clusters to their respective nearby clusters by setting post_alloc=True (which is the default value). In this case we get the following clustering:
The second phase of CLASSIX consists of merging groups into clusters and there are two options for doing so, depending on the group_merging parameter.
If group_merging='distance' (the default value), two groups will be merged if their associated starting points are within scl*radius distance from each other. The scaling parameter defaults to scl=1.5 if not modified. Distance-based merging is very fast and works in most cases.
If group_merging='density', two groups will be merged only if there are sufficiently many data points in their overlap. This merging procedure requires more computation and might be slow, but it can prove useful in cases of tightly packed clusters such in the above Gaussian blob example.
When there are many data points, the vizualisations produced by the .explain method might be difficult to interprete. There are several options that help producing better plots, e.g. when the boxes of starting points are too large so that they hide the data points. In this case, we may set sp_alpha smaller to get more transparency for the box of starting points or set sp_pad smaller to get the box smaller, or we can change the color of that by specifying sp_fcolor to a more shallow color. For more detail, we refer users to the documentation. Also, you can set cmap (e.g., 'bmh'), cmin and cmax to customize a color map of the clusters.
All experiments in the paper referenced below are reproducible by running the code in the folder of "exp".
Before running, ensure the dependencies scikit-learn and hdbscan are installed and the Quickshift++ code (Quickshift++: Provably Good Initializations for Sample-Based Mean Shift) is compiled. After configuring all of these, run the following commands:
cd exp
python3 run exp_main.py
All results will be written to the folder "exp/results". Please let us know if you have any questions.
Any form of contribution is welcome. Please be free to post issues and pull requests if you want to assist in documentation or code. To contribute, please fork the project and pull a request for your changes. We will strive to work through any issues and requests and get your code merged into the main branch. Contributors will be acknowledged in the release notes.
@techreport{CG22b,
  title   = {Fast and explainable clustering based on sorting},
  author  = {Chen, Xinye and G\"{u}ttel, Stefan},
  year    = {2022},
  number  = {arXiv:2202.01456},
  pages   = {25},
  institution = {The University of Manchester},
  address = {UK},
  type    = {arXiv EPrint},
  url     = {https://arxiv.org/abs/2202.01456}
}This project is licensed under the terms of the MIT license.


