Giter Site home page Giter Site logo

vscode-browser-preview's Introduction

๐Ÿšจ Deprecation Notice

This extension has been deprecated in favor of the Live Preview extension.

The Live Preview extension is under active development and has much of the same functionality, including an embedded preview and external browser debugging. You can install the Live Preview extension and safely uninstall or disable this Browser Preview extension. Please file any issues you encounter in the Live Preview repository.


logo
Browser Preview for VS Code

A real browser preview inside your editor that you can debug.

CI

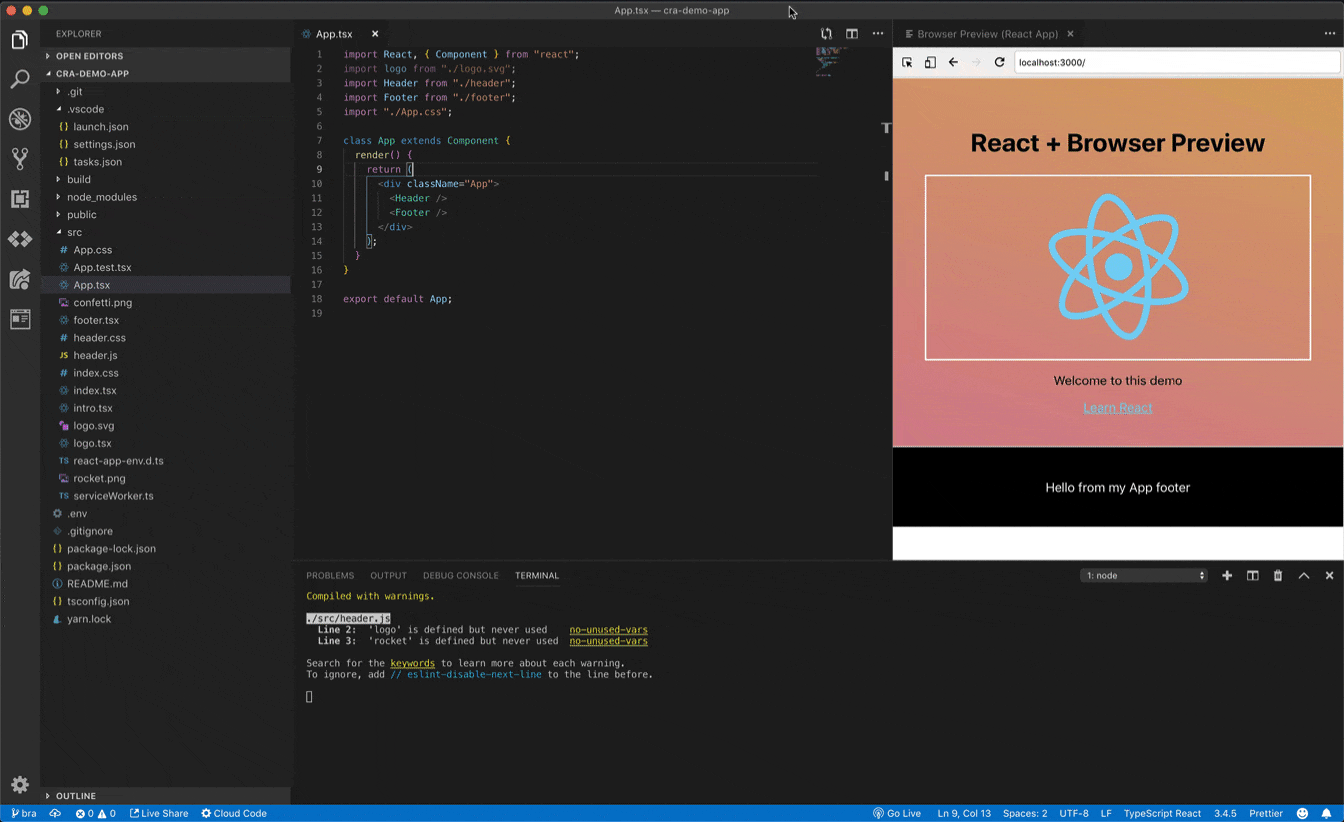
Browser Preview for VS Code enables you to open a real browser preview inside your editor that you can debug. Browser Preview is powered by headless Chromium, and works by starting a headless Chromium instance in a new process. This can either be Google Chrome or Microsoft Edge. This enables a secure way to render web content inside VS Code, and enables interesting features such as in-editor debugging and more!

Getting started

  1. Grab extension from marketplace
  2. Click the new "Browser Preview" button in the Side Bar to the left or run the command Browser View: Open Preview

Make sure you have Google Chrome installed on your computer.

Features

  • Browser preview inside VS Code (Powered by headless Chromium).
  • Ability to have multiple previews open at the same time.
  • Debuggable. Launch urls and attach Debugger for Chrome to the browser view instance, and debug within VS Code.
  • Attach Chrome DevTools via chrome://inspect
  • Option to set the default startUrl via browser-preview.startUrl
  • Option to set the path to the chrome executable via browser-preview.chromeExecutable
  • Option to set the type of rendering via browser-preview.format with the support for jpeg (default one) and png formats

How to change the default start url / start page?

Go to your settings, search for "browser preview" and set browser-preview.startUrl to your desired url.

Launch and Debugging

You can enable in-editor debugging of Browser Preview by installing Debugger for Chrome, and configure VS Code's debugger to either attach or launch to the browser previews by using the following configuration:

{
  "version": "0.1.0",
  "configurations": [
    {
      "type": "browser-preview",
      "request": "attach",
      "name": "Browser Preview: Attach"
    },
    {
      "type": "browser-preview",
      "request": "launch",
      "name": "Browser Preview: Launch",
      "url": "http://localhost:3000"
    }
  ]
}

The debug configuration also supports these additional properties: webRoot, pathMapping, trace, sourceMapPathOverrides and urlFilter. See https://github.com/Microsoft/vscode-chrome-debug#other-optional-launch-config-fields for details on how to use.

Watch It

Watch an animated gif showing how to open the preview and debug a browser app.

Additional configuration

Browser Preview has the following settings:

"browser-preview.startUrl": // The default start url for new Browser Preview instances
"browser-preview.verbose": false // Enable verbose logging of messages sent between VS Code and Chrome instance
"browser-preview.chromeExecutable": // The full path to the executable, including the complete filename of the executable
"browser-preview.format": // Option to set the type of rendering with the support for `jpeg` (default one) and `png` formats
"browser-preview.ignoreHttpsErrors": false // Ignore HTTPS errors if you are using self-signed SSL certificates

vscode-browser-preview's People

Contributors

arjunattam avatar arminkhodaei avatar auchenberg avatar capaj avatar digitarald avatar jarrodldavis avatar jawn avatar johnpapa avatar joseluisq avatar lostintangent avatar lpmi-13 avatar mburleigh avatar mjurczyk avatar modul8com avatar oliverkovacs avatar orta avatar peterblazejewicz avatar sana-ajani avatar simonsiefke avatar warpdesign avatar

Stargazers

 avatar  avatar  avatar  avatar  avatar  avatar  avatar  avatar  avatar  avatar  avatar  avatar  avatar  avatar  avatar  avatar  avatar  avatar  avatar  avatar  avatar  avatar  avatar  avatar  avatar  avatar  avatar  avatar  avatar  avatar  avatar  avatar  avatar  avatar  avatar  avatar  avatar  avatar  avatar  avatar  avatar  avatar  avatar  avatar  avatar  avatar  avatar  avatar  avatar  avatar  avatar  avatar  avatar  avatar  avatar  avatar  avatar  avatar  avatar  avatar  avatar  avatar  avatar  avatar  avatar  avatar  avatar  avatar  avatar  avatar  avatar  avatar  avatar  avatar  avatar  avatar  avatar  avatar  avatar  avatar  avatar  avatar  avatar  avatar  avatar  avatar  avatar  avatar  avatar  avatar  avatar  avatar  avatar  avatar  avatar  avatar  avatar  avatar  avatar  avatar

Watchers

 avatar  avatar  avatar  avatar  avatar  avatar  avatar  avatar  avatar  avatar  avatar  avatar  avatar  avatar  avatar  avatar  avatar  avatar  avatar  avatar  avatar  avatar  avatar  avatar  avatar  avatar  avatar  avatar  avatar  avatar  avatar  avatar  avatar  avatar  avatar  avatar  avatar  avatar  avatar  avatar  avatar  avatar  avatar  avatar  avatar  avatar  avatar  avatar  avatar

vscode-browser-preview's Issues

Add support for window.open

Some web apps use window.open to pop up secondary pages. It'd be nice if Browser Preview could handle this kind of thing:

window.open("https://code.visualstudio.com","_blank","width=600,height=400");

No default launch.json created when pressing F5

If I have a new project and hit 'F5' it gives me the option to use Browser Preview as my debug target, but it will then fail as no launch.json configuration is found.

If I do the same procedure with the regular chrome debugger extension, it'll instead create the default launch.json file with the required configuration needed to launch the tools. It'd be great for the Browser Preview to do the same.

Consolidate the command palette menu

There are 2 menu options that appear to do the same thing

image

  • Browser: Show Browser Preview
  • View: Show Browser Preview

If they are different, perhaps clarify in the readme. If they are indeed the same, consolidate them

Javascript initiated dialog (e.g. alert) freezes Browser Preview

If script on a page invokes alert('Hello world') the page becomes unresponsive. Nor does the alert appear.

The issue probably affects confirm and prompt in the same way, plus any dialog arising from onbeforeunload.

I suspect Browser Preview needs to listen for Page.javascriptDialogOpening on which I guess it'll receive hasBrowserHandler as false. Then it could invoke a VSCode equivalent and call Page.handleJavaScriptDialog with the result.

Perhaps JS alert would map to Window.showWarningMessage, and confirm to showInformationMessage, and prompt to showInputBox.

@auchenberg - based on how rapidly you turned around #40 I'm hoping you can do something with the above. Sorry, I'm not currently set up to offer you a PR.

Open browser url in BrowserView instead

Not sure if this is possible, but it would be great to be able to open the URL that is being sent to the browser from Code (via browserSync, for example) or an option to enable that.

Feature: Add "fit to width" scaling of viewport

First of all I want to thank you for this extension. I like the idea and implementation, and it helps me with prototyping fir side projects.

As I can see - size of browser preview affects viewport size that is rendered by headless chrome, which is expected but not ideal for my case.

I'm working on website where I should see full desktop version. At this moment I have to stack editors and preview vertically (unusual and uncomfortable to me, because of limited vertical space left for editors and total nightmare when terminal panel is open ๐Ÿ˜† )

As possible solution for my case I can see:

  1. Set fixed window size for headless chrome
  2. Render output image scaled down, so it will fit to width.
  3. Action to switch between regular and "fit to width" modes

Will you consider this feature or it is out of scope?

chrome://inspect not loading

Putting chrome://inspect in the location bar and hitting enter doesn't load the devtools page. If there's another way to do this, lmk. Love the project, thanks!

Chrome: Version 71.0.3578.98
Mac OS: 10.14.2 (18C54)
VSCode: Version 1.30.2 (1.30.2)

Vue/Nuxt: Preview consistently one save behind actual

Using Vue/Nuxt, which hot reloads code, the browser preview is very consistently showing me the state of the last change, rather than the one I just made. See attached screenshot where the "more" text in the browser has no underline, but preview is showing one.

MacBook Pro OSX latest
2.9 GHz Intel Core i7
16 GB 2133 MHz LPDDR3
Radeon Pro 560 4096 MB
Intel HD Graphics 630 1536 MB

screen shot 2019-01-22 at 11 38 13 am

Not respecting launch URL port

Using the following config, it is not respecting the port of the URL and still launching with :3000

{ "launch": { "configurations": [ { "name": "Browser Preview: Launch", "type": "browser-preview", "request": "launch", "url": "http://localhost:4201" } ], "compounds": [] } }

Unclear how to open the browser preview

The readme says to ....

Click the new "Browser Preview" button in the activity bar.

I think it is referring to this (shown below) in the groups in the explorer.

image

I do not have these visible, ever. I turn them off with "explorer.openEditors.visible": 0,

If this is the intent, then it should be stated in the readme that it can be accessed here or using the command palette.

Feature: Add mobile device emulation

Add mobile device emulation so each device preview can represent a specific device.

Multiple device configurations could be provided, to open multiple at the same time too. A virtual device lab!

Feature: Support Audio

Just tried to do some coding while watching youtube and no go ๐Ÿ˜„ Not sure if audio is supported by headless chrome, but maybe?

Feature: Add support for error pages when loading https invalid cert

So I have tested this with a few different servers. When I open a page with an invalid cert (such as a self signed cert for dev) The page does not load. If I open the page in native chrome I am able to accept the security exception. But on browser-preview I get a blank page.

searching for settings doesnt find any results

when i search for browser preview (space or no space) in settings, no results appear

nor is there any autocomplete for this setting referenced in the readme

"browserpreview.startUrl": // The default start url for new Browser Preview instances 

When I added this to the settings.json manually, it works. However it is underlined as it appears the json schema is unaware of it.

  "browserpreview.startUrl": "http://localhost:9626", 

Getting weird click event delays

I tried using this while working on the React Tic Tac Toe tutorial. My click events aren't fully processing right away. I have to click on a box (a <button ...>) and then I have to click somewhere else like on some text on the page before the click event is fully processed and an X or and O appears in the box I clicked first. Click events work fine and immediately in a normal browser though. So it seems like something about the click events and focus aren't always processing correctly.

Duplicate previews when switching themes

On a fresh run of Visual Studio Code, after I launch Browser Preview and cycle through Themes, I see duplicate windows open up.

Steps to reproduce:
โ€ข Open a fresh instance of VSC
โ€ข Click the Browser Preview icon in the activity bar
โ€ข The preview launches in a new column
โ€ข cmd-shift-P to change the color theme.
โ€ข Move up or down with arrows and after the first theme and a second preview launches in the second column

I also noticed that if I close the left-most column, when I try to change the color theme, a new column with a duplicate preview launches.

screen shot 2019-02-11 at 11 02 27 am

macOS: 10.14.3
VSC: 1.31.0
Browser Preview: 0.2.8
Chrome: 71.0.3578.98, 64-bit

Add support for Local file URLs

Browser Preview Version: 0.2.5
VS Code Version: 1.30.2 (1.30.2)
Platform: macOS 10.14.2
Chrome version: 71.0.3578.98 (Official Build) (64-bit)

Trying to open a valid file URL in Browser Preview (i.e. file:///Users/myuser/myfile.html) doesn't work:

  • A blank page is displayed (no error message)
  • The URL in the address bar changes from file://<url> to file//<url> (i.e. file///Users/myuser/myfile.html)
  • the title bar changes to Browser Preview (http://file///<url>) (i.e. Browser Preview (http://file///Users/myuser/myfile.html) ).

The same file URL works in Chrome.

Feature: Bookmarks

This is a super nice extension! ๐Ÿ˜„๐Ÿ‘

Bookmarks would be a super useful feature for those of us who just want to be able to keep any arbitrary web page opened in a vscode tab as a reference when coding

Perhaps a command palette cmd "Browser Preview Bookmarks" could show a list of predefined bookmarks which you could choose between. Hit enter on one to make it launch in a new tab.

Add support for custom Chrome installation paths

On my workPC Chrome is here:
C:\ProgramData\App-V\59B860A4-01C5-4693-93C0-81E835526730\3C66E565-8B3B-4F79-8DA0-AC77B1C890EF\Root\VFS\ProgramFilesX86\GoogleChromePortable\App\Chrome-bin\chrome.exe --enable-websocket-over-spdy

So when I try to run the browserpreview, I get a popup error:
Failed to launch chrome! spawn C:\Program Files (x86)\Google\Chrome\Application\chrome.exe ENOENT
TROUBLESHOOTING: https://github.com/GoogleChrome/puppeteer/blob/master/docs/troubleshooting.md

I guess that where-chrome doesn't provide it correctly... maybe your chrome location should be a setting ?

Feature: Add support for Drag and drop

Hi
Thanks for this extension. For me it works very well except the drag and drop. I currently dev a website in React where I can drag and drop columns (using Office fabric and their DetailsList).

In Chrome "normal browser" this works fine, but the extension in vscode doesn't seem to trigger the events.

Maybe related I can also notice that the mouse cursor is not updated - it remains the default arrow even on clickable items where it should change.

Any idea?

Thanks
Vincent

[Enhancement] - Allow adding this npm scripting

Imagine we can add a command to our npm scripts to open the browser preview to a specific url. That would be an awesome feature.

"cool": "concurrently \"npm run start\" \"code -browserpreview -url http://localhost:9626\"",

this would require some way to launch it, obviously, from the command line.

Address bar doesn't update on history.pushState

Everything works as expected is just that the address bar doesn't update on history.pushState. To reproduce click the links in the example bellow.

<!DOCTYPE html>
<html>

<head>
  <title>History</title>
</head>

<body>
  <a href="?s=a">a</a>
  <a href="?s=b">b</a>
  <a href="?s=c">c</a>
  <span id="current"></span>
  <script>
    document.querySelector('span').innerText = new URLSearchParams(location.search).get('s') || ''
    document.querySelectorAll('a').forEach(anchor => anchor.addEventListener('click', event => {
      event.preventDefault()
      history.pushState({}, '', event.target.getAttribute('href'))
      document.querySelector('span').innerText = new URLSearchParams(location.search).get('s') || ''
    }))
  </script>
</body>

</html>

Support for objectURLs created through window.URL.createObjectURL(blob)

First of all, great job and thank you!

Our site creates a lot of objectURLs for blobs that are fetched from APIs, to display those blob data (Images, Stylesheets, Markup, etc.). It invokes the browser to create them via calls to window.URL.createObjectURL(blob) and the resulting URL takes the form of
blob:https://www.yoursite.com/{UUID-here}.

Whilst it works without issue in Chrome, the below error is logged to the Debug Console of VS Code:

Failed to load resource: net::ERR_UNKNOWN_URL_SCHEME [blob:http://www.yoursite.com.au:8081/7ba1635a-4cdb-4af6-8702-f364909e3aa1]

Is there some configuration we are missing or is this support not yet available? If the latter, please consider this our +1 vote for it.

Thanks again.

v0.2.6 default browser undefined

Hi,
From the recent update 0.2.6 that introduced the custom location of Chrome, the extension default browser is not working. Downgrading to 0.2.5 makes the extension work again without changing anything else.

Details of the error

A popup error appears: "cannot read property 'remoteDebugPort' of undefined" when I run the configuration "launch".

launch.json

{
    // Use IntelliSense to learn about possible attributes.
    // Hover to view descriptions of existing attributes.
    // For more information, visit: https://go.microsoft.com/fwlink/?linkid=830387
    "version": "0.2.0",
    "configurations": [
        {
            "type": "browser-preview",
            "name": "Browser Preview: Attach",
            "request": "attach"
        },
        {
            "type": "browser-preview",
            "request": "launch",
            "name": "Browser Preview: Launch",
            "url": "http://localhost:4200",
            "webRoot": "${workspaceFolder}"
        }
    ]
}

My app is simply an angular app already running on port 4200.

Steps to reproduce the issue

Simply follow the instructions given on this guide https://medium.com/@MarkPieszak/debugging-angular-cli-inside-vscode-with-browser-preview-8dcc4b18ed64

System

auchenberg.vscode-browser-preview: 0.2.6
msjsdiag.debugger-for-chrome: 4.11.1
vscode: 1.30.2
chrome: 71.0.3578.98 installed through homebrew cask
os: Mac OSX 10.14.3

I have no idea on how to debug the extension, I can just confirm that it works using 0.2.5.

novice questio (need help)

i'm on windows. chrome 71.0.3578.98, vscode 1.30.2
i'm coding in VueJS.

I installed browser preview.

launch.json after adding configurations
{
// Use IntelliSense to learn about possible attributes.
// Hover to view descriptions of existing attributes.
// For more information, visit: https://go.microsoft.com/fwlink/?linkid=830387
"version": "0.2.0",
"configurations": [
{
"type": "chrome",
"request": "launch",
"name": "Launch Chrome",
"url": "http://localhost:8080",
"webRoot": "${workspaceFolder}"
},
{
"type": "browser-preview",
"name": "Browser Preview: Attach",
"request": "attach"
},
{
"type": "browser-preview",
"request": "launch",
"name": "Browser Preview: Launch",
"url": "http://localhost:3000"
}
]
}

once I press "browser preview" button on sidebar, window opens with "https://code.visualstudio.com/"
instead of my app.

once I press "debug" start debugging with "browser preview" selected, I see blank screen (localhost:3000/) and no app there.

though "debug " start debugging with "chrome" also give empty page.

may be that's because latest vue tends to run development server with "npm run serve" instead of "npm start"?

One event behind

Window 10

2 elements with click events attached
click first element - nothing happens
click second element - first element event initiated
click first element - second element event initiated

with css the same / 2 elements:hover
first:hover - nothing happens
second:hover - first element hover initiated
first:hover - second element hover initiated

To see what I mean look at this page in Google Chrome then in Browser Sync(hover and click on the squares) : https://jsbin.com/vepesuzasa/edit?html,output

<html>
<head>
<style>
div>div{
  width: 100px;
  height: 100px;
}
div>div:hover{
  opacity: 0.5;
}
</style>
</head>
<body>
<div style="display: flex">
  <div data-color=red style="background:red"></div>
  <div data-color=green style="background:green"></div>
  <div data-color=blue style="background:blue"></div>
</div>
<script>
document.querySelectorAll('div>div').forEach(item=>item.addEventListener('click',event=>document.querySelector('body').style.background=event.target.getAttribute('data-color')))
</script>
</body>
</html>

Rendering is off on resize

When you resize the panel, the preview seems to have a bit of trouble adjusting to the new panel size.

2019-01-15_14-56-39

Improve sluggish, low fps rendering

Scrolling is very sluggish on any web page (e.g. the startup vscode page). I just tried to go to YouTube and the videos were playing with low fps, perhaps around 10 or so... (I didn't do any scientific measuring).

Perhaps this is a known issue or known side effect of Chrome Headless?

I'm on a MacBook Air (11-inch, Early 2015) running macOS Mojave.

Support Chromium

This extension use under the hood the which-chrome module to get the path to the chrome bin.

This module is also able to get the path of chromium if installed.

Would you be open to a PR falling back to chromium if chrome is not present, or maybe through a setting?

This might be handy on Debian related systems where chromium is in the default repos but not chrome which need a bit more setup.

Thanks!

Unable to install.

I am getting an error "Unable to install because the extension 'auchenberg.vscode-browser-preview' compatible with current version '1.29.1' of VS Code is not found".

Spec :-
Code :- v1.29.1
OS:- Ubuntu 18.04.1

Feature: Inspect element -> open source file

This feature is new "inspect element" mode that allows you to Inspect an element in VS Code. When clicking instead of seeing the element in a DOM Explorer, you instead see the source file for the component that created the DOM element. Think of this as the DOM explorer for the Component-age, or a built-in React DevTools like experience in Browser Preview.

ezgif com-optimize (1)

Prototype is hacked together for React.js, and demo is showing a out of box create-react-app.

Actions:

  • Add inspect button to toolbar
  • Get position for DOM element
  • Resolve position into DOM element id
  • Add rendering of element highlighting in Canvas
  • Map DOM element ID to source position using https://github.com/auchenberg/element-to-source
  • Open file in VS Code

Supported frameworks

Powered by https://github.com/auchenberg/element-to-source/, and validated in

  • React / Create React App
  • React / Next.js
  • Svelte

Descriptions on debug configurations not correct

All I see on hover over configuration attributes in my launch.json file are tooltips like %chrome.webRoot.description% which I imagine is supposed to be a variable that is replaced with the actual description.

Support Previewing Static HTML Files

Extension version: 0.2.5
Environment: Windows 10 Pro x64, VS Code 1.30.2, Chrome 71.0.3578.98 (Official)

Request:

Support opening a preview window for basic *.html files.

Current behavior:

  1. Open a local HTML file
  2. F1 > Browser Preview: Open Preview
  3. Browser window displays VS Code homepage

Expected behavior:

  1. Open a local HTML file
  2. F1 > Browser Preview: Open Preview
  3. Browser window displays contents of the open HTML file
    • Changes saved to the HTML file cause the browser to refresh instantly

Recommend Projects

  • React photo React

    A declarative, efficient, and flexible JavaScript library for building user interfaces.

  • Vue.js photo Vue.js

    ๐Ÿ–– Vue.js is a progressive, incrementally-adoptable JavaScript framework for building UI on the web.

  • Typescript photo Typescript

    TypeScript is a superset of JavaScript that compiles to clean JavaScript output.

  • TensorFlow photo TensorFlow

    An Open Source Machine Learning Framework for Everyone

  • Django photo Django

    The Web framework for perfectionists with deadlines.

  • D3 photo D3

    Bring data to life with SVG, Canvas and HTML. ๐Ÿ“Š๐Ÿ“ˆ๐ŸŽ‰

Recommend Topics

  • javascript

    JavaScript (JS) is a lightweight interpreted programming language with first-class functions.

  • web

    Some thing interesting about web. New door for the world.

  • server

    A server is a program made to process requests and deliver data to clients.

  • Machine learning

    Machine learning is a way of modeling and interpreting data that allows a piece of software to respond intelligently.

  • Game

    Some thing interesting about game, make everyone happy.

Recommend Org

  • Facebook photo Facebook

    We are working to build community through open source technology. NB: members must have two-factor auth.

  • Microsoft photo Microsoft

    Open source projects and samples from Microsoft.

  • Google photo Google

    Google โค๏ธ Open Source for everyone.

  • D3 photo D3

    Data-Driven Documents codes.