This is the sixth project for freeCodeCamp's Data Visualization certificate.
Completed On: 09 August 2017
Build a CodePen.io app that is functionally similar to this: https://codepen.io/FreeCodeCamp/full/vGjLVZ.
Fulfill the below user stories. Use whichever libraries or APIs you need. Give it your own personal style.
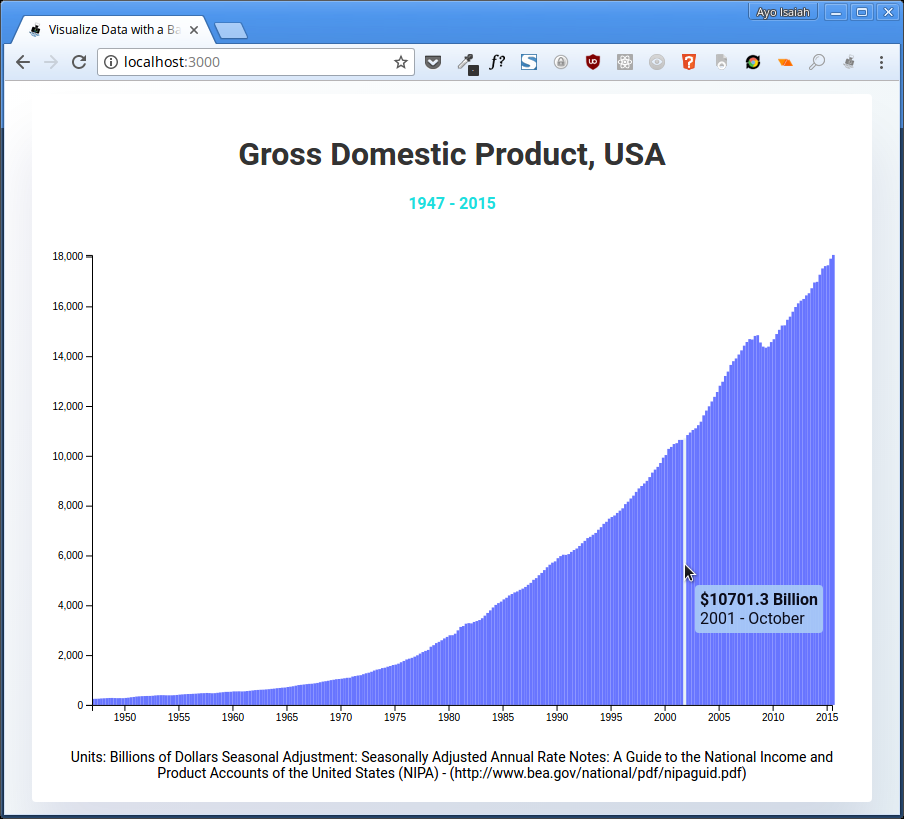
- I can see US Gross Domestic Product by quarter, over time.
- I can mouse over a bar and see a tooltip with the GDP amount and exact year and month that bar represents.
Hint: Here's a dataset you can use to build this: https://raw.githubusercontent.com/FreeCodeCamp/ProjectReferenceData/master/GDP-data.json
https://codepen.io/ayoisaiah/full/wqdJPd/