baidu / curve Goto Github PK
View Code? Open in Web Editor NEWAn Integrated Experimental Platform for time series data anomaly detection.
Home Page: http://curve.baidu.com
License: Apache License 2.0
An Integrated Experimental Platform for time series data anomaly detection.
Home Page: http://curve.baidu.com
License: Apache License 2.0
house.baidu.com


error message
deploy api... Collecting swagger-py-codegen==0.2.9 Collecting dpath (from swagger-py-codegen==0.2.9) Requirement already satisfied: six in ./venv/lib/python3.6/site-packages (from swagger-py-codegen==0.2.9) (1.11.0) Collecting PyYAML (from swagger-py-codegen==0.2.9) Requirement already satisfied: click in ./venv/lib/python3.6/site-packages (from swagger-py-codegen==0.2.9) (7.0) Requirement already satisfied: jinja2 in ./venv/lib/python3.6/site-packages (from swagger-py-codegen==0.2.9) (2.10) Requirement already satisfied: MarkupSafe>=0.23 in ./venv/lib/python3.6/site-packages (from jinja2->swagger-py-codegen==0.2.9) (1.0) Installing collected packages: dpath, PyYAML, swagger-py-codegen Successfully installed PyYAML-3.13 dpath-1.4.2 swagger-py-codegen-0.2.9 Traceback (most recent call last): File "xxx/Curve/venv/bin/swagger_py_codegen", line 11, in <module> sys.exit(generate()) File "xxx/Curve/venv/lib/python3.6/site-packages/click/core.py", line 764, in __call__ return self.main(*args, **kwargs) File "xxx/Curve/venv/lib/python3.6/site-packages/click/core.py", line 717, in main rv = self.invoke(ctx) File "xxx/Curve/venv/lib/python3.6/site-packages/click/core.py", line 956, in invoke return ctx.invoke(self.callback, **ctx.params) File "xxx/Curve/venv/lib/python3.6/site-packages/click/core.py", line 555, in invoke return callback(*args, **kwargs) TypeError: generate() got an unexpected keyword argument 'spec'
env:
python 3.6 / 2.7 (i have tried both of them)
ubuntu 18.04
node.js 10.13.0 (includes npm 6.4.1)
seems it occured when executed swagger_py_codegen --ui --spec -s doc/web_api.yaml api -p curve
Thanks a lot !
when I visit http://curve.baidu.com return , it return 500

按左键移动数据时,出现两次刷新的效果,第一次刷新结果为当前状态,第二次刷新结果为平移后的数据。
第一次刷新效果是否可以去掉
I try to upload a file and the original time interval is 1min, while the interval in Curve is 1s and the start time is 1970 ?

Hi - I have got the app running. But uploading a csv fails with the error
Error: Request failed with status code 500
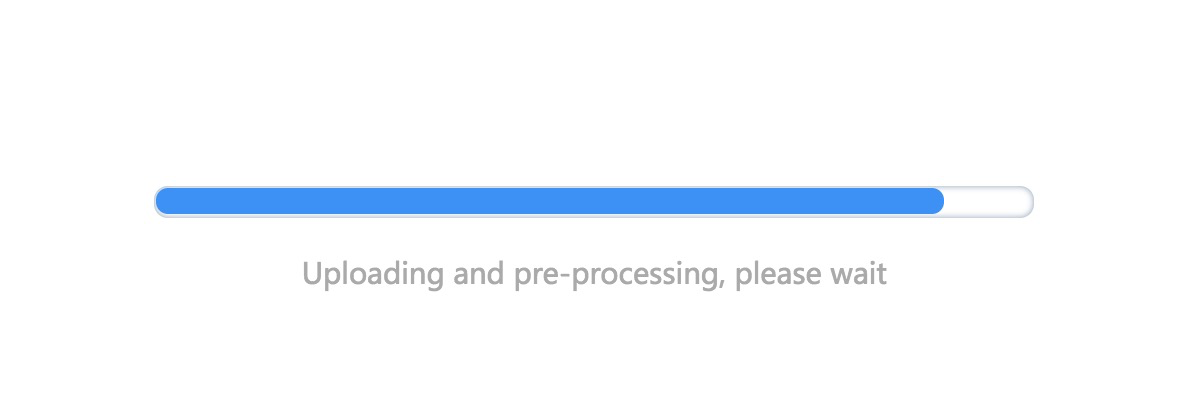
The page shows "Uploading and pre-processing, please wait.."


Hey guys,
May I ask whether it's possible to label on single point as an outlier? I've tried many ways like selecting relatively narrow range on the time series but it looks like minimum 2 points are labeled every time.
Was I doing something incorrectly?
Thanks for helping in advance.

upload csv file by required format, I don't know why it is wrong. Please help


The red interactive close button does not work
cancel the label, export, delete and some non-texted interactive functions are inactiveanomaly percent does not change according to the labelled curvesAfter updating to the new commit 84acec7, the web page could not be visited, which indicates: {"message": "The requested URL was not found on the server. If you entered the URL manually please check your spelling and try again."}

Why does it always being wait ?
The refresh, develop tools and other hot keys is blocked in chrome.
安装过程中出现fetchMetadata: sill install loadAllDepsIntoIdelTree -----一直在这个地方不懂

As the figure shows, I choose the time range is 3d, while the buttons of 7d and 14d do not work. That is to say, the time range can only be narrowed, not expanded. The only way to show the larger time range is reloading the data. Besides, it would be better if the selected time range button is highlighted.
@ldp12416
Curve seems to be naming the time series incorrectly, based on the first dotted element in the csv filename.
I uploaded a csv named stats.statsd.bad_lines_seen.20161110.ts.value.csv and the Curve web app presented it as stats.
I tested this further by uploading a file named stats.graphite-dev-2.vda.ioInProgress.baidu_curve.csv and was presented with the error:
stats upload failed...Can't upload file with the same name, please try again
I then renamed the file to stats-graphite-dev-2.vda.ioInProgress.baidu_curve.csv which did upload to Curve, but named the time series stats-graphite-dev-2
It would probably be better if Curve just named the time series based on the filename, excluding the .csv extension.
We may use multi-metric to describe the status of entity, anomalies are marked on all the metrics, this is a scene with multi-curves labeling.
ps. another scene, we may use multi-dimension statistics to describe the status of entities, anomalies are marked on one or more dimensions.
Hi all,
=============================================================
deploy venv...
New python executable in /home/ppt/jyy/Curve-master/venv/bin/python
Installing setuptools, pip...done.
/home/ppt/jyy/Curve-master/venv/bin/activate: 行 8: _OLD_VIRTUAL_PATH: 未绑定的变量
How to fix it ?
Thanks!
When data is labelled in the UI and exported it is only exported with a ,1 set on the labelled data in the csv, data that has not been labelled is left blank, for example:
timestamp,value,label
1478765820,0.0,
1478765880,0.0,
1478765940,0.0,
1478766000,0.0,1
1478766060,0.05,1
1478766120,0.0,
1478766180,0.0,
1478766240,0.0,
Due to the fact that the label column has been added, should all unlabelled data be labelled with ,0 rather than just ,?
This would reduce the requirement for the user to have to preprocess the exported csv or deal with NaNs in any upstream processing they did with the exported csv as all the label data would be present.
Buttons like cancel the label, export, delete, and some non-texted interactive functions are inactive, are these features implemented?
[2019-05-13 14:55:29,204] ERROR in app: Exception on /v1/datas [GET]
Traceback (most recent call last):
File "/Curve/venv/lib/python3.5/site-packages/flask/app.py", line 1813, in full_dispatch_request
rv = self.dispatch_request()
File "/Curve/venv/lib/python3.5/site-packages/flask/app.py", line 1799, in dispatch_request
return self.view_functionsrule.endpoint
File "/Curve/venv/lib/python3.5/site-packages/flask_restful/init.py", line 458, in wrapper
resp = resource(*args, **kwargs)
File "/Curve/venv/lib/python3.5/site-packages/flask/views.py", line 88, in view
return self.dispatch_request(*args, **kwargs)
File "/Curve/venv/lib/python3.5/site-packages/flask_restful/init.py", line 573, in dispatch_request
resp = meth(*args, **kwargs)
File "/Curve/api/curve/v1/validators.py", line 115, in wrapper
resp = view(*args, **kwargs)
File "/Curve/api/curve/v1/validators.py", line 106, in wrapper
return view(*args, **kwargs)
File "/Curve/api/curve/v1/api/datas.py", line 35, in get
return self.render(data=[data.view() for data in datas])
File "/Curve/api/curve/v1/api/datas.py", line 35, in
return self.render(data=[data.view() for data in datas])
File "/Curve/api/curve/v1/models/data_abstract.py", line 61, in view
'end': min(self.start_time + 86400, self.end_time) * 1000
TypeError: can't concat bytes to int`
After fixing many errors in the last PR. This is the error that has me stumped.
Looks like the start_time is not being decoded into an int properly. Please assist with pointers
I tried to alter the dialog.js code under dir /web/src/common/baseComponent. When I stop and restart, it still runs the code before change.
start Curve...
[uWSGI] getting INI configuration from uwsgi.ini
Curve started.
open("./log/uwsgi.log"): No such file or directory [core/logging.c line 288]
I am using python2.7.6 ubuntu14.04LTS
Clicking triple dots at the right side of the specific data in left side-bar, then clicking 'delete'. In the pop-up window, the red 'delete' button does not work.
Raise error :
Uncaught TypeError: this.props.showLoading is not a function at e.value (dialog.js:58) at Object.i (ReactErrorUtils.js:24) at a (EventPluginUtils.js:83) at Object.s [as executeDispatchesInOrder] (EventPluginUtils.js:106) at p (EventPluginHub.js:41) at m (EventPluginHub.js:52) at Array.forEach (<anonymous>) at i (forEachAccumulated.js:22) at Object.processEventQueue (EventPluginHub.js:252) at i (ReactEventEmitterMixin.js:15)
i want to try your system with a labeled csv file , but it just show can't "Curve upload failed ,Please try again ", so what is the problem ? and i want to modify your system with more Input Source(like TimeSeriesDatabase , are you guys welcome on this? if we are done , we will give the PR to you ) , hope that you can reply why the problem show and how to fix it .
lost means these curves are not labelled anomaly after refreshing.
When run the command "./control.sh start" to start the service, there exists the error message in the console. I want to know how to fix it or what environment should I install, thanks. Current environment is Mac OS 10.14.2, python 3.6.3, Node.js 6.4.1.
I find that if your computer installed Anoconda, the build process will report errors. The solution is delete the Anoconda folder, when the environment build is finished, then restore the Anoconda folder.
We need a doc for contributors, tips:
Some .csv data file upload failed. What are the specific requirements for uploading files? such as column names, etc.
i uploaded my test data, which uses the same format as sample 3th, but can't upload.
Hi, I am interested in your project. But it only can run on Linux os. I really want to know when the windows version will release?
"Module not found: Error: Can't resolve 'react-icons/lib/fa/search' in '/anaconda3/envs/python3/Curve/web/src/index/component'"
get local time zone in js
Hey, while uploading CSV the localhost:/8080 web is stuck as picture below:
My data is like
timestamp | value
1534521600 | 0.00
1534608000 | 0.00
1534694400 | 0.00
1534780800 | 1048.20
1534867200 | 0.00
1534953600 | 747.40
1535040000 | 14606.00
1535126400 | 7219.20
1535212800 | 150.40
1535299200 | 5228.00
1535385600 | 2450.40
1535472000 | 1101.40
1535558400 | 3808.60
can we create an infomation group? to talk about that?

The Anomaly percent does not change.

I use the sample_data_10000.csv file and export the labeled file.
sample_data_10000.csv.zip
A declarative, efficient, and flexible JavaScript library for building user interfaces.
🖖 Vue.js is a progressive, incrementally-adoptable JavaScript framework for building UI on the web.
TypeScript is a superset of JavaScript that compiles to clean JavaScript output.
An Open Source Machine Learning Framework for Everyone
The Web framework for perfectionists with deadlines.
A PHP framework for web artisans
Bring data to life with SVG, Canvas and HTML. 📊📈🎉
JavaScript (JS) is a lightweight interpreted programming language with first-class functions.
Some thing interesting about web. New door for the world.
A server is a program made to process requests and deliver data to clients.
Machine learning is a way of modeling and interpreting data that allows a piece of software to respond intelligently.
Some thing interesting about visualization, use data art
Some thing interesting about game, make everyone happy.
We are working to build community through open source technology. NB: members must have two-factor auth.
Open source projects and samples from Microsoft.
Google ❤️ Open Source for everyone.
Alibaba Open Source for everyone
Data-Driven Documents codes.
China tencent open source team.