Giter Site home page Giter Site logo

bcgov / wetlandmapr Goto Github PK

View Code? Open in Web Editor NEW
17.0 8.0 6.0 7.83 MB

Scripts, tools and example data for mapping wetland ecosystems using data driven R statistical methods like Random Forests and open source GIS

License: Apache License 2.0

R 100.00%
package mapping-wetland-ecosystems wetland-model raster rsaga saga-gis data-driven random-forests statistical-methods random-forest

wetlandmapr's Introduction

wetlandmapR

Lifecycle:Maturing R package for mapping wetland ecosystems using data driven R statistical methods like Random Forests and open source GIS.

Introduction

This package (in development) provides tools for running the ModelMap::model.build and ModelMap::model.mapmake R functions, specifically for modeling and mapping wetland ecosystems. Additional functions help generate the necessary input training data and raster look up table inputs.

Wetland models can be run using area of interest polygons, restricting output to specific drainage basins, for example.

wetlandmapR depends on RSAGA for some raster processing. RSAGA depends on SAGA GIS being installed and accessible on your computer. Please see the RSAGA documentation for instructions on how to do this. Optionally, if the user wishes to attribute upstream basin statistics to provided pour points GRASS-GIS version 7.6.0 or higher must also be installed in addition to the rgrass7 R package.

Functions

create_dem_products

Creates raster derivatives (products) from an input Digital Elevation Model (DEM) using SAGA-GIS.

stack_rasters

Aligns input raster(s) to a target raster so that extent, cell size, and cell origin are the same, returning a RasterStack object.

grid_values_at_sp

Adds cell values from a Raster object as attributes to a SpatialPoints object.

wetland_model

This function runs ModelMap::model.build to build a wetland model using training data attributed with predictor values.

wetland_map

This function runs ModelMap::model.mapmake to generate raster prediction surfaces using model output from wetland_model.

raster_to_clean_polygon

This function reads in classified raster values and creates polygons from contiguous cell values, these polygons are then simplified.

set_grass_env

This function initializes a GRASS-GIS environment using the rgrass7 package in order to calculate upstream basin statistics of user provided pour points of interest.

run_basin_stats

This function assumes set_grass_env has been called. This function attributes upstream basin statistics calculated from provided input raster layers for specified pour point locations.

Installation

Get the latest version from GitHub with:

devtools::install_github("bcgov/wetlandmapR")

Or with Docker

Download a Docker image based on rocker/geospatial:3.6.3 with all the required dependencies and packages pre-installed with:

docker pull huntgdok/wetlandmapr:latest

The image can then be run by passing the command:

docker run -e PASSWORD=URPassword -p 8787:8787 --rm huntgdok/wetlandmapr:latest 

Where URPassword is any password of your choice, and username rstudio. The running container can be viewed by passing localhost to your browser. Be sure to copy all outputs locally before exiting as all data will be lost.

Examples

See the example vignette which describes wetlandmapR_example how to use the functions in this package together for mapping wetlands.

wetlandmapr's People

Contributors

bevingtona avatar dfilatow avatar gharvey-bc avatar huntergleason avatar repo-mountie[bot] avatar sicasley avatar

Stargazers

 avatar  avatar  avatar  avatar  avatar  avatar  avatar  avatar  avatar  avatar  avatar  avatar  avatar  avatar  avatar  avatar  avatar

Watchers

 avatar  avatar  avatar  avatar  avatar  avatar  avatar  avatar

wetlandmapr's Issues

Add missing topics

TL;DR

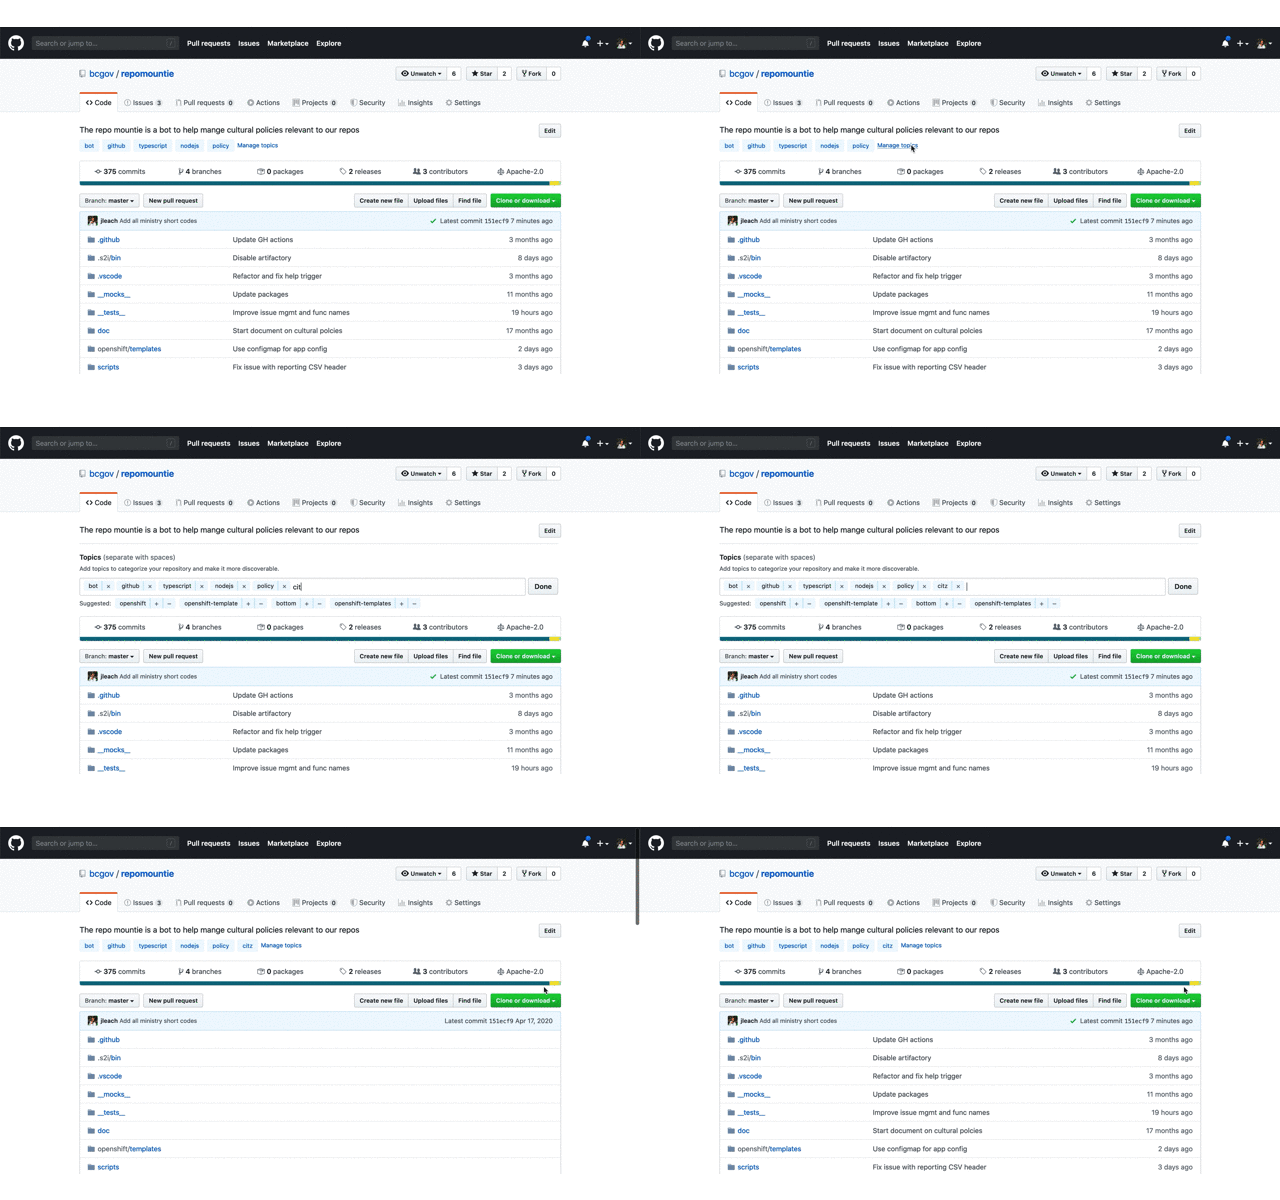
Topics greatly improve the discoverability of repos; please add the short code from the table below to the topics of your repo so that ministries can use GitHub's search to find out what repos belong to them and other visitors can find useful content (and reuse it!).

Why Topic

In short order we'll add our 800th repo. This large number clearly demonstrates the success of using GitHub and our Open Source initiative. This huge success means its critical that we work to make our content as discoverable as possible; Through discoverability, we promote code reuse across a large decentralized organization like the Government of British Columbia as well as allow ministries to find the repos they own.

What to do

Below is a table of abbreviation a.k.a short codes for each ministry; they're the ones used in all @gov.bc.ca email addresses. Please add the short codes of the ministry or organization that "owns" this repo as a topic.

add a topic

That's in, you're done!!!

How to use

Once topics are added, you can use them in GitHub's search. For example, enter something like org:bcgov topic:citz to find all the repos that belong to Citizens' Services. You can refine this search by adding key words specific to a subject you're interested in. To learn more about searching through repos check out GitHub's doc on searching.

Pro Tip ๐Ÿค“

  • If your org is not in the list below, or the table contains errors, please create an issue here.

  • While you're doing this, add additional topics that would help someone searching for "something". These can be the language used javascript or R; something like opendata or data for data only repos; or any other key words that are useful.

  • Add a meaningful description to your repo. This is hugely valuable to people looking through our repositories.

  • If your application is live, add the production URL.

Ministry Short Codes

Short Code Organization Name
AEST Advanced Education, Skills & Training
AGRI Agriculture
ALC Agriculture Land Commission
AG Attorney General
MCF Children & Family Development
CITZ Citizens' Services
DBC Destination BC
EMBC Emergency Management BC
EAO Environmental Assessment Office
EDUC Education
EMPR Energy, Mines & Petroleum Resources
ENV Environment & Climate Change Strategy
FIN Finance
FLNR Forests, Lands, Natural Resource Operations & Rural Development
HLTH Health
FLNR Indigenous Relations & Reconciliation
JEDC Jobs, Economic Development & Competitiveness
LBR Labour Policy & Legislation
LDB BC Liquor Distribution Branch
MMHA Mental Health & Addictions
MAH Municipal Affairs & Housing
BCPC Pension Corporation
PSA Public Safety & Solicitor General & Emergency B.C.
SDPR Social Development & Poverty Reduction
TCA Tourism, Arts & Culture
TRAN Transportation & Infrastructure

NOTE See an error or omission? Please create an issue here to get it remedied.

Save model output summary to file

OOB error gets displayed on screen when running wetland_model(), but there is no lasting record of this. In addition to saving diagnostics (#11), it would be useful to save a summary of the model output - which includes OOB error - to file for reference. This can be achieved by running

> print(model.out)

To save this output to file, for example:

> sink("./output/20190703-130403/20190703-130403_model_results.txt")
> print(model.out)
> sink()

Look at incorporating this as part of wetland_model().

Add a vignette

I think wetlandmapR_example.R could be used as the basis for a vignette.

It would be good to also include example analysis of the model diagnostics (OOB, CMX etc).

Change nodata values to -9999

# TO DO:
# Need to output nodata values as -9999
# ...

na.value in ModelMap::model.mapmake defaults to -9999 (value that indicates NA in the predictor rasters), therefore input rasters should be prepared with a common value for nodata - makes sense to use -9999.

Write model inputs to log file

  • Maybe add a new function to do this...
  • Could use the model_building_arguments.txt file (output from ModelMap::model.build) to extract parameter values and write them to a log file.
  • This log file could then be used to re-run a particular model by referencing input parameters from the log.
  • Model runs should append to log file, so it maintains a record of historical runs.

Output/save model diagnostics data

# TO DO:
# Save diagnostic values (section commented out below) to an output csv?
# Which values to save?
# Write diagnostic values to same log.csv as model params. Append to existing
# file so that multiple model runs can be recorded and compared.
# ...

Model diagnostics could be output to standalone file(s) in the model output folder, or they could be saved in the log file (issue #6), along with the model input params - may make it easier to compare different model runs?

create_dem_products error

the create_dem_products seems to be working up to the point it tries to create TPI. Then I get this warning and the process gets hung. when I stop it says a child process is not responding.
Warning messages:
1: In .local(x, filename, ...) : all cell values are NA
2: In system(command, intern = intern, show.output.on.console = show.output.on.console, :
running command '"C:/OSGeo4W64/apps/saga-ltr/saga_cmd.exe" -f=q ta_morphometry 18 -DEM "C:/Users/dfilatow/Documents/R/test/ELEV.sgrd" -TPI "C:/Users/dfilatow/Documents/R/test/TPI.sgrd"' had status 99

It's Been a While Since This Repository has Been Updated

This issue is a kind reminder that your repository has been inactive for 180 days. Some repositories are maintained in accordance with business requirements that infrequently change thus appearing inactive, and some repositories are inactive because they are unmaintained.

To help differentiate products that are unmaintained from products that do not require frequent maintenance, repomountie will open an issue whenever a repository has not been updated in 180 days.

  • If this product is being actively maintained, please close this issue.
  • If this repository isn't being actively maintained anymore, please archive this repository. Also, for bonus points, please add a dormant or retired life cycle badge.

Thank you for your help ensuring effective governance of our open-source ecosystem!

reclass model output

consider what the model should output and what the analysis.
Use the lookup table key table outputted from the model.
add code to reclass model 3-category output to 1=upland, 2=wetland, 3=water

Add pilot test data package

@dfilatow and Gillian to provide pilot test data. This can then be added to the package and the examples (in function docs and wetlandmapR_example.R) updated to use this data.

It's Been a While Since This Repository has Been Updated

This issue is a kind reminder that your repository has been inactive for 181 days. Some repositories are maintained in accordance with business requirements that infrequently change thus appearing inactive, and some repositories are inactive because they are unmaintained.

To help differentiate products that are unmaintained from products that do not require frequent maintenance, repomountie will open an issue whenever a repository has not been updated in 180 days.

  • If this product is being actively maintained, please close this issue.
  • If this repository isn't being actively maintained anymore, please archive this repository. Also, for bonus points, please add a dormant or retired life cycle badge.

Thank you for your help ensuring effective governance of our open-source ecosystem!

It's Been a While Since This Repository has Been Updated

This issue is a kind reminder that your repository has been inactive for 180 days. Some repositories are maintained in accordance with business requirements that infrequently change thus appearing inactive, and some repositories are inactive because they are unmaintained.

To help differentiate products that are unmaintained from products that do not require frequent maintenance, repomountie will open an issue whenever a repository has not been updated in 180 days.

  • If this product is being actively maintained, please close this issue.
  • If this repository isn't being actively maintained anymore, please archive this repository. Also, for bonus points, please add a dormant or retired life cycle badge.

Thank you for your help ensuring effective governance of our open-source ecosystem!

Add SAGA image segmentation

Add SAGA image segmentation (unsupervised) method for generating polygons from which wetland model prediction category attributes can be added.

SAGA: object-based image segmentation

Set-up map codes and colours

Pre-define (?) map codes and colours to use in output prediction maps.

Map codes will depend on response targets used - which will vary between model runs and areas - so we could build a look up table to contain potential values.

Add project lifecycle badge

No Project Lifecycle Badge found in your readme!

Hello! I scanned your readme and could not find a project lifecycle badge. A project lifecycle badge will provide contributors to your project as well as other stakeholders (platform services, executive) insight into the lifecycle of your repository.

What is a Project Lifecycle Badge?

It is a simple image that neatly describes your project's stage in its lifecycle. More information can be found in the project lifecycle badges documentation.

What do I need to do?

I suggest you make a PR into your README.md and add a project lifecycle badge near the top where it is easy for your users to pick it up :). Once it is merged feel free to close this issue. I will not open up a new one :)

Output prediction map

I think this should be a new function, so it can be used on previous model runs (rather than including as part of wetland_map function).

Requires map codes and colours to be defined ( #12 ) or provided manually as input to function.

Recommend Projects

  • React photo React

    A declarative, efficient, and flexible JavaScript library for building user interfaces.

  • Vue.js photo Vue.js

    ๐Ÿ–– Vue.js is a progressive, incrementally-adoptable JavaScript framework for building UI on the web.

  • Typescript photo Typescript

    TypeScript is a superset of JavaScript that compiles to clean JavaScript output.

  • TensorFlow photo TensorFlow

    An Open Source Machine Learning Framework for Everyone

  • Django photo Django

    The Web framework for perfectionists with deadlines.

  • D3 photo D3

    Bring data to life with SVG, Canvas and HTML. ๐Ÿ“Š๐Ÿ“ˆ๐ŸŽ‰

Recommend Topics

  • javascript

    JavaScript (JS) is a lightweight interpreted programming language with first-class functions.

  • web

    Some thing interesting about web. New door for the world.

  • server

    A server is a program made to process requests and deliver data to clients.

  • Machine learning

    Machine learning is a way of modeling and interpreting data that allows a piece of software to respond intelligently.

  • Game

    Some thing interesting about game, make everyone happy.

Recommend Org

  • Facebook photo Facebook

    We are working to build community through open source technology. NB: members must have two-factor auth.

  • Microsoft photo Microsoft

    Open source projects and samples from Microsoft.

  • Google photo Google

    Google โค๏ธ Open Source for everyone.

  • D3 photo D3

    Data-Driven Documents codes.