


Visualize Erlang/Elixir Nodes On The Command Line base on recon. Document in detail.
- Provide a high-performance tool usable both in development and production settings.
- Focus on important and detailed information about real-time running system.
- Keep minimal consumption.
Erlang
%% rebar.config
{deps, [observer_cli]}
%% erlang.mk
dep_observer_cli = hex 1.4.2
Elixir
# mix.exs
   def deps do
     [{:observer_cli, "~> 1.4"}]
end%% rebar3 project
rebar3 shell
1> observer_cli:start().
%% mix project
iex -S mix
iex(1)> :observer_cli.start%% rebar3 project
rebar3 shell --name '[email protected]'
1> observer_cli:start('target@host', 'magic_cookie').
%% mix project
iex --name "[email protected]" -S mix
iex(1)> :observer_cli.start(:'target@host', :'magic_cookie')❗ ensure observer_cli application been loaded on target node.
- cd path/to/observer_cli/
rebar3 escriptizeto generate an escript executable containing the project's and its dependencies' BEAM files. Place script(_build/default/bin/observer_cli) anywhere in your path and useobserver_clicommand.observer_cli TARGETNODE [TARGETCOOKIE REFRESHMS]to monitor remote node.


If you need to customize some of your internal metrics and integrate it into observer_ci,
you only need to write a observer_cli_plugin behaviour in a few simple steps to get a nice presentation.
- Configure observer_cli,tell observer_cli how to find your plugin.
%% module       - Specific module implements plugin behavior. It's mandatory.
%% title        - Menu title. It's mandatory.
%% shortcut     - Switch plugin by shortcut. It's mandatory.
%% interval     - Refresh interval ms. It's optional. default is 1500ms.
%% sort_column  - Sort the sheet by this index. It's optional default is 2.

{plugins,
  [
    #{module => observer_cli_plug_behaviour1, title => "XPlug",
      interval => 1500, shortcut => "X", sort_column => 3},
    #{module => observer_cli_plug_behaviour2, title => "YPlug",
      interval => 1600, shortcut => "Y", sort_column => 3}
  ]
}

- Write observer_cli_plugin behaviour. observer_cli_plugin has 3 callbacks.
2.1 key value labels.
-callback kv_label() -> [Rows] when
    Rows :: #{
    key => string(), key_width => pos_integer(),
    value => string()|integer()|{byte, pos_integer()}, value_width => pos_integer()
    }.
for example:
kv_label() ->
    [
        [
            #{key => "XXX Ets Size", key_width => 20,
              value => ets:info(xxx,size), value_width => 10},
            #{key => "Pool1 Size", key_width => 15,
              value => application:get_env(app,pool1_size), value_width => 30},
            #{key => "XYZ1 Process Mem", key_width => 18,
              value => {byte, element(2, erlang:process_info(xyz1, memory))}, value_width => 16}
        ],
        [
            #{key => "YYY Ets Size", key_width => 20,
              value => ets:info(yyy,size), value_width => 10},
            #{key => "Pool2 Size", key_width => 15,
              value => application:get_env(app,pool2_size), value_width => 30},
            #{key => "XYZ2 Process Mem", key_width => 18,
              value => {byte, element(2, erlang:process_info(xyz2, memory))}, value_width => 16}
        ],
        [
            #{key => "ZZZ Ets Size", key_width => 20,
              value => ets:info(zzz,size), value_width => 10},
            #{key => "Pool3 Size", key_width => 15,
              value => application:get_env(app,pool3_size), value_width => 30},
            #{key => "XYZ3 Process Mem", key_width => 18,
              value => {byte, element(2, erlang:process_info(xyz3, memory))}, value_width => 16}
        ]
    ].
-callback sheet_header() -> [SheetHeader] when
    SheetHeader :: #{title => string(), width => pos_integer(), shortcut => string()}.
for example:
sheet_header() ->
    [
        #{title => "Pid", width => 25},
        #{title => "Status", width => 25},
        #{title => "Memory", width => 24, shortcut => "S"},
        #{title => "Reductions", width => 24, shortcut => "R"},
        #{title => "Message Queue Len", width => 25, shortcut => "Q"}
].-callback sheet_body() -> [SheetBody] when
SheetBody :: list().for example:
sheet_body() ->
    [begin
         [
             Pid,
             element(2, erlang:process_info(Pid, status)),
             element(2, erlang:process_info(Pid, memory)),
             element(2, erlang:process_info(Pid, reductions)),
             element(2, erlang:process_info(Pid, message_queue_len))
         ]
     end||Pid <- erlang:processes()
    ].
Support F/B to page up/down.


-
1.4.2
- hidden schedule process bar when core > 100.
-
1.4.1
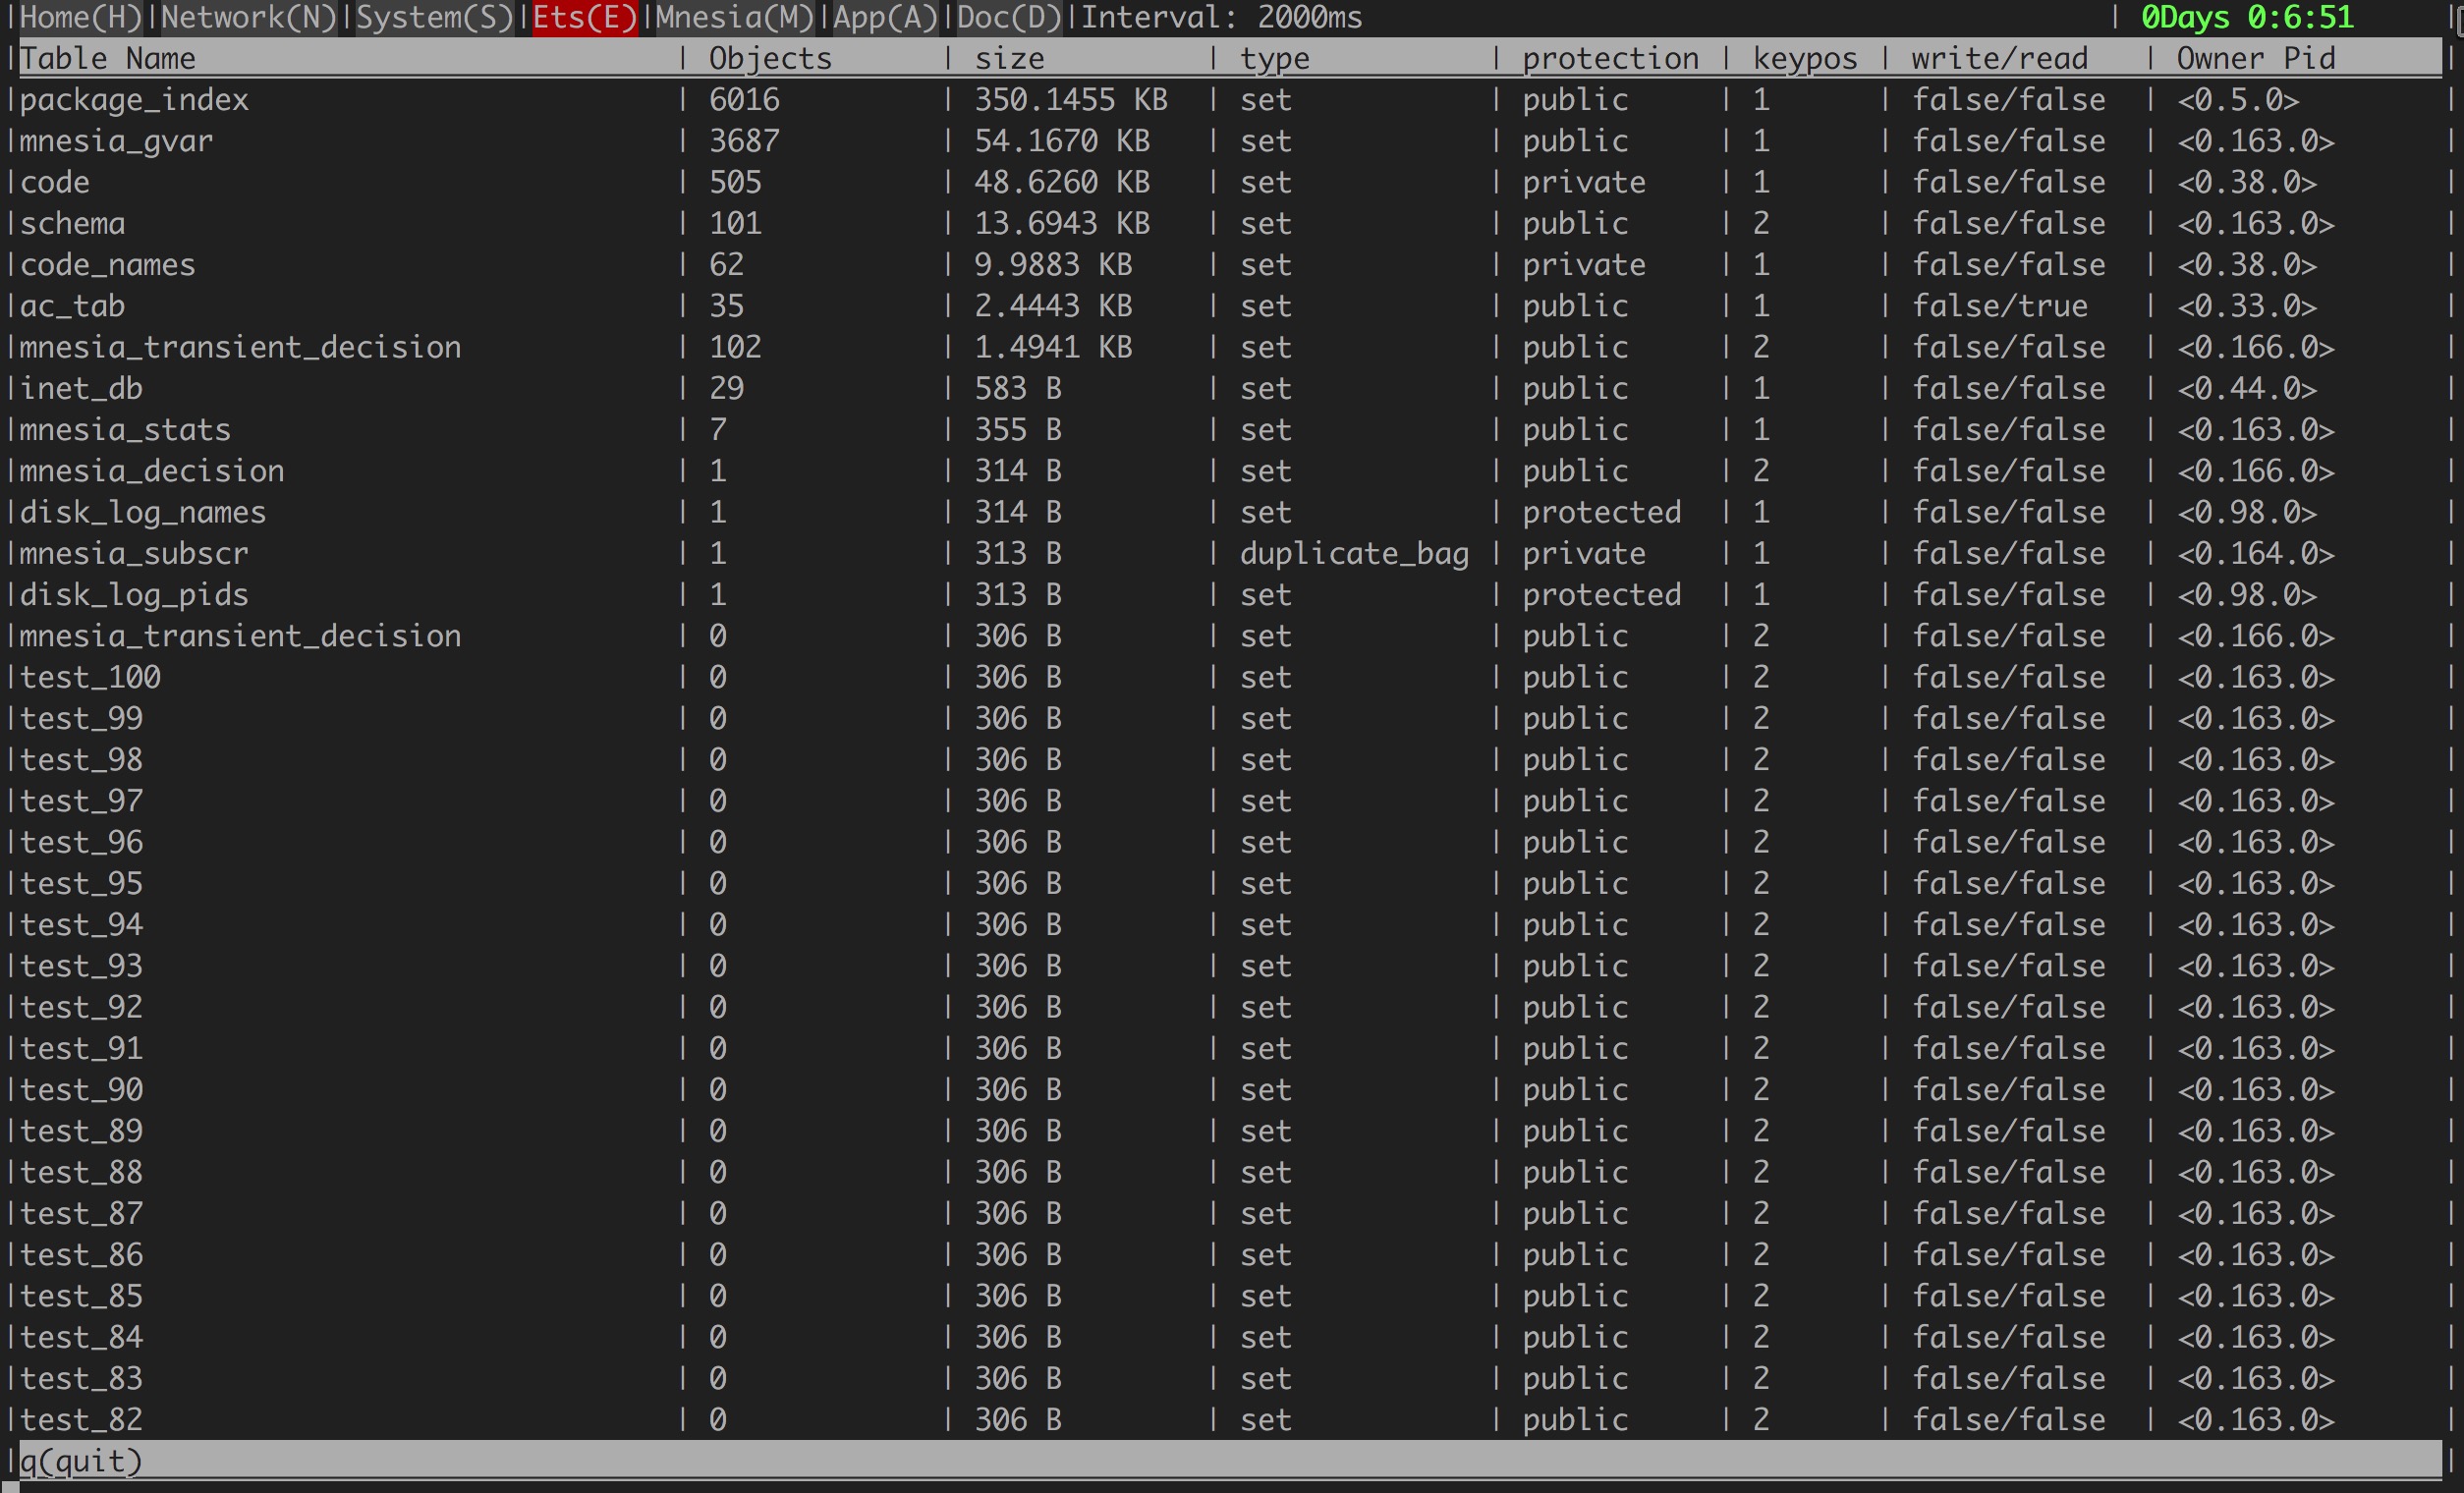
- Fixed ets view memory usage wrong.
- mnesia view memory usage According to bytes.
-
1.4.0
- Support write your own plugin.
-
1.3.4
- View(ets mnesia) support page down/up; support sort by memory or size.
- Fixed pause crash.
- Make refresh interval configurable.
-
1.3.3
- fixed io:format(Format,Args) Format not support iolist OTP R21
-
1.3.2
- Make sure all observer_cli process exit when quit.
- Upgrade recon to 2.3.6
-
1.3.1
- Add atom limit/count in home.
- Escript support short name and long name.
- Fixed store process not exit.
- Upgrade recon to 2.3.5
-
1.3.0
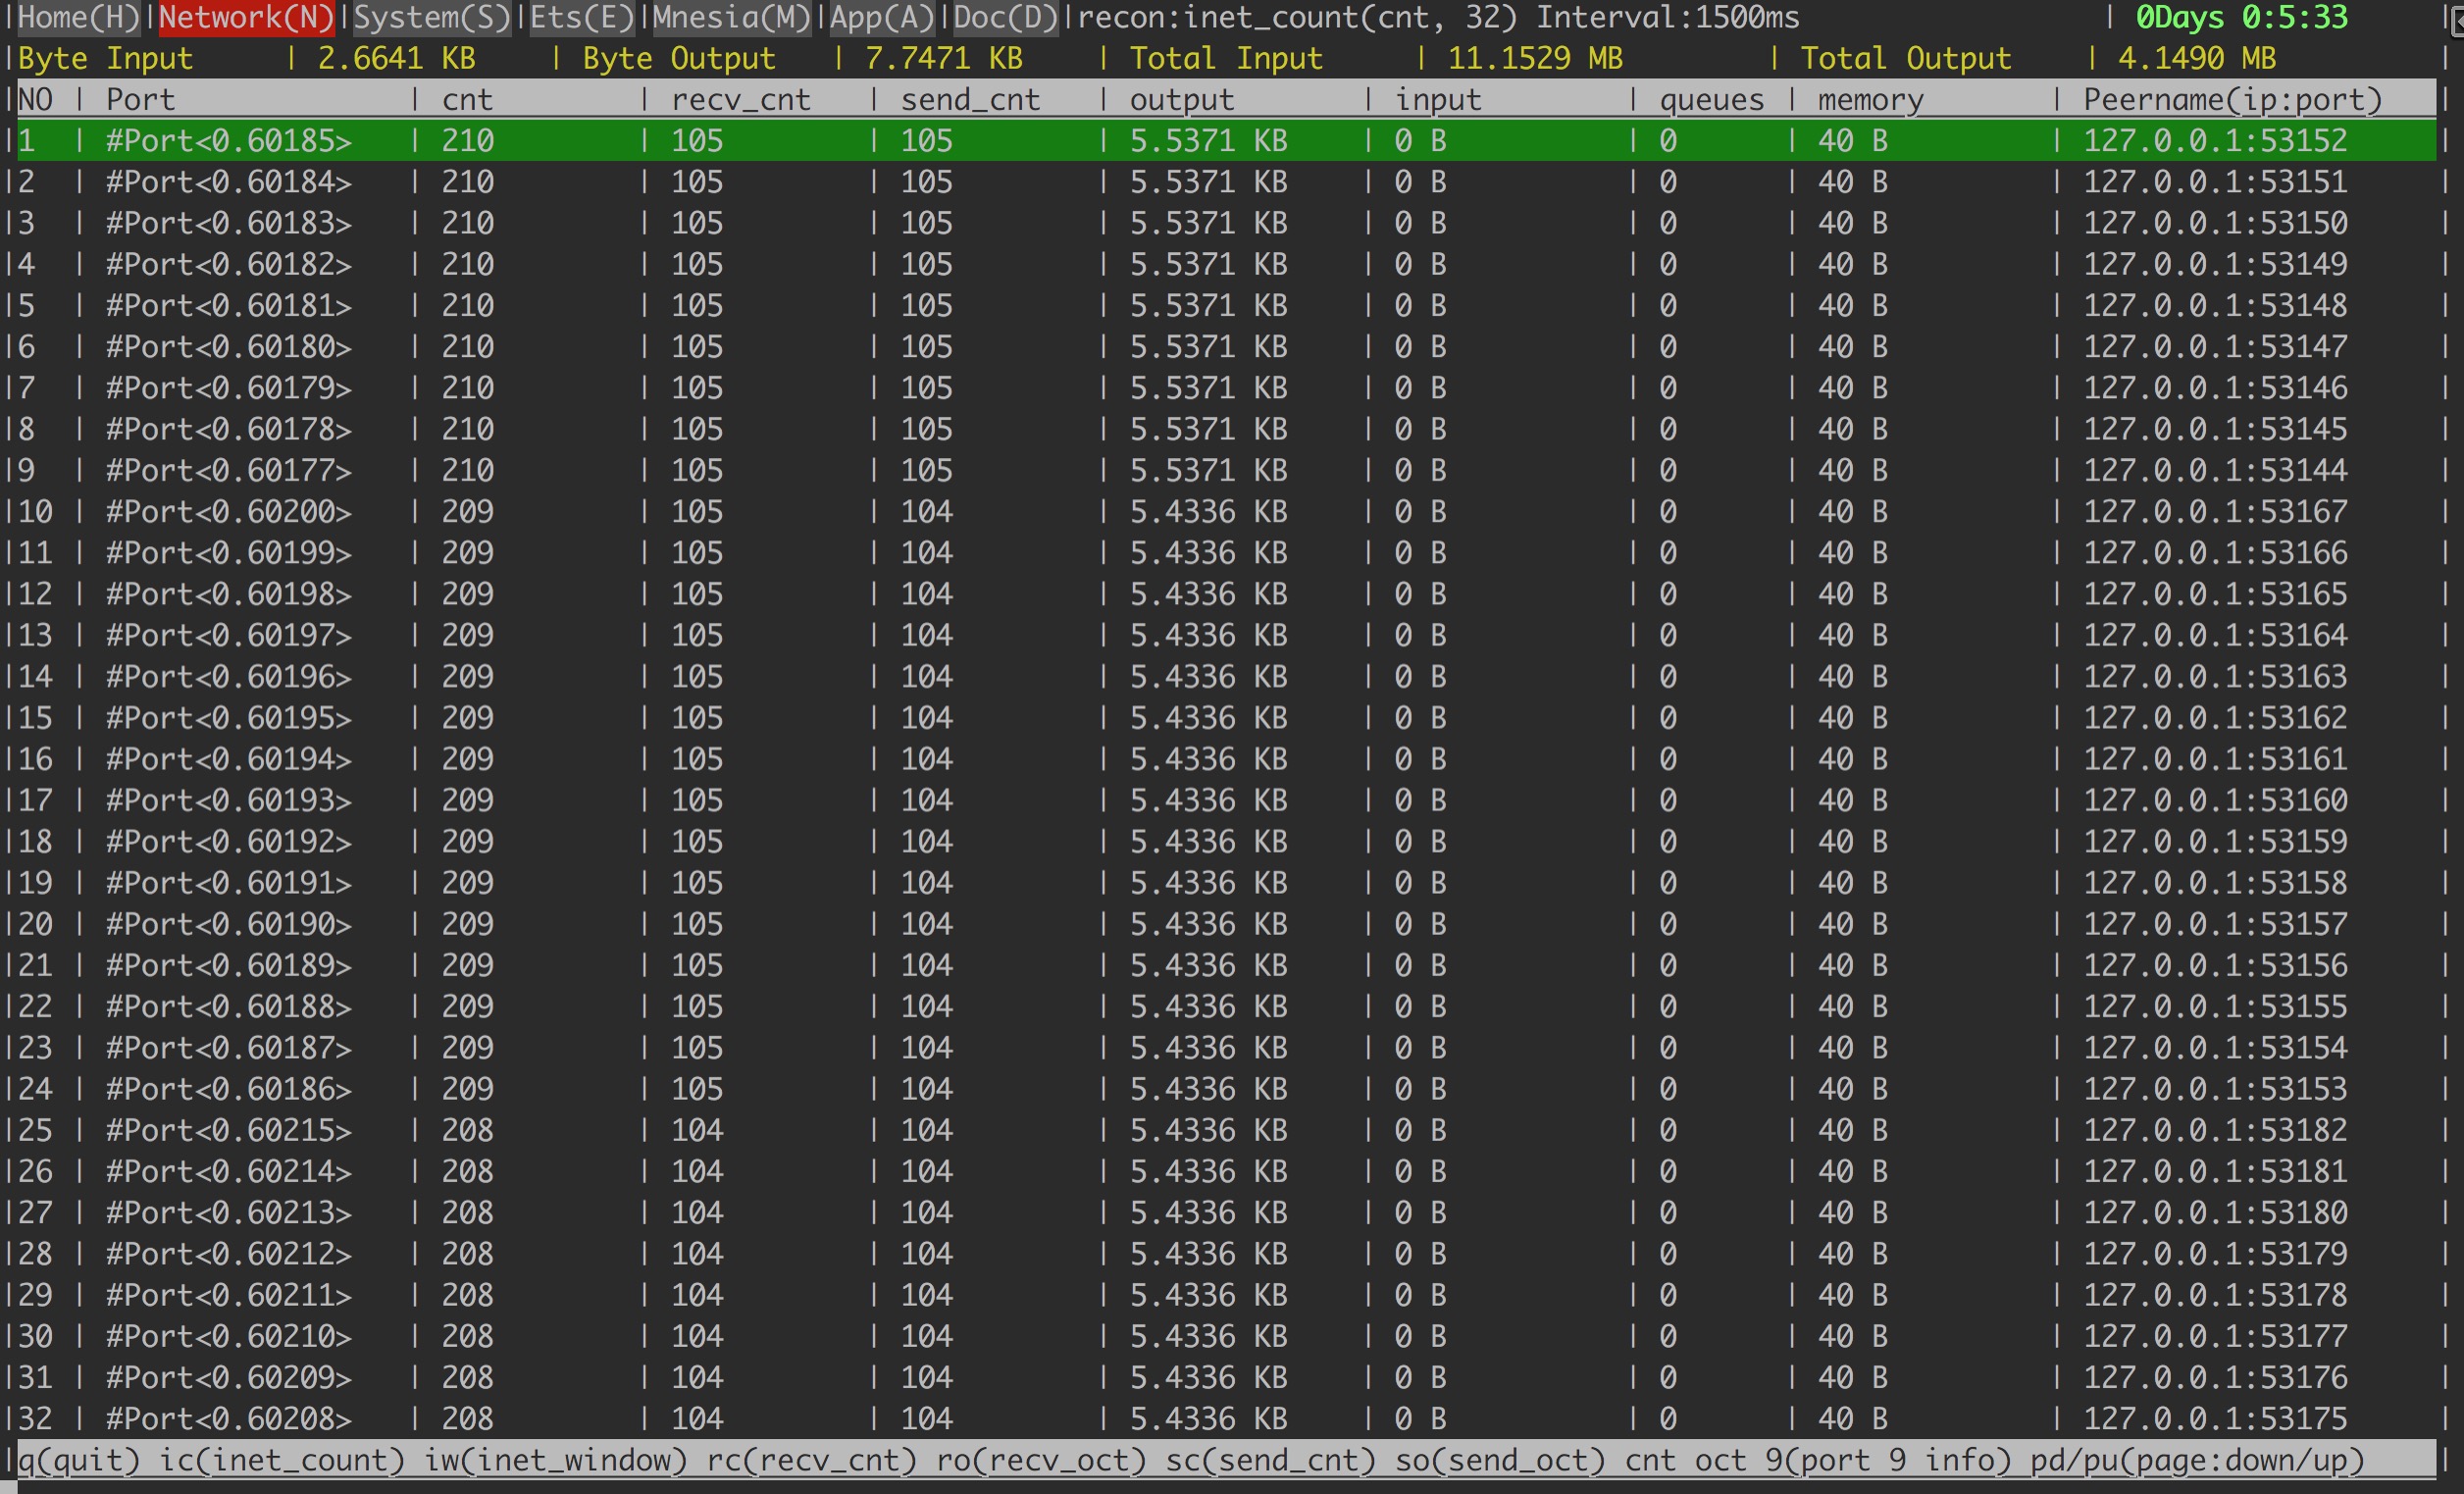
- Rewrite Network/Process view.
- Support PageDown/PageUp for top n list.
- Escript auto load observer_cli when it's not load on target node.
-
1.2.2
- fix schedule number >= 32 display wrong.
- improve memory(byte/kilobyte/megabyte/gigabyte) unit.
-
1.2.1
- fixed autosize not work.
- try best to make color adjust all platform.
-
1.2.0
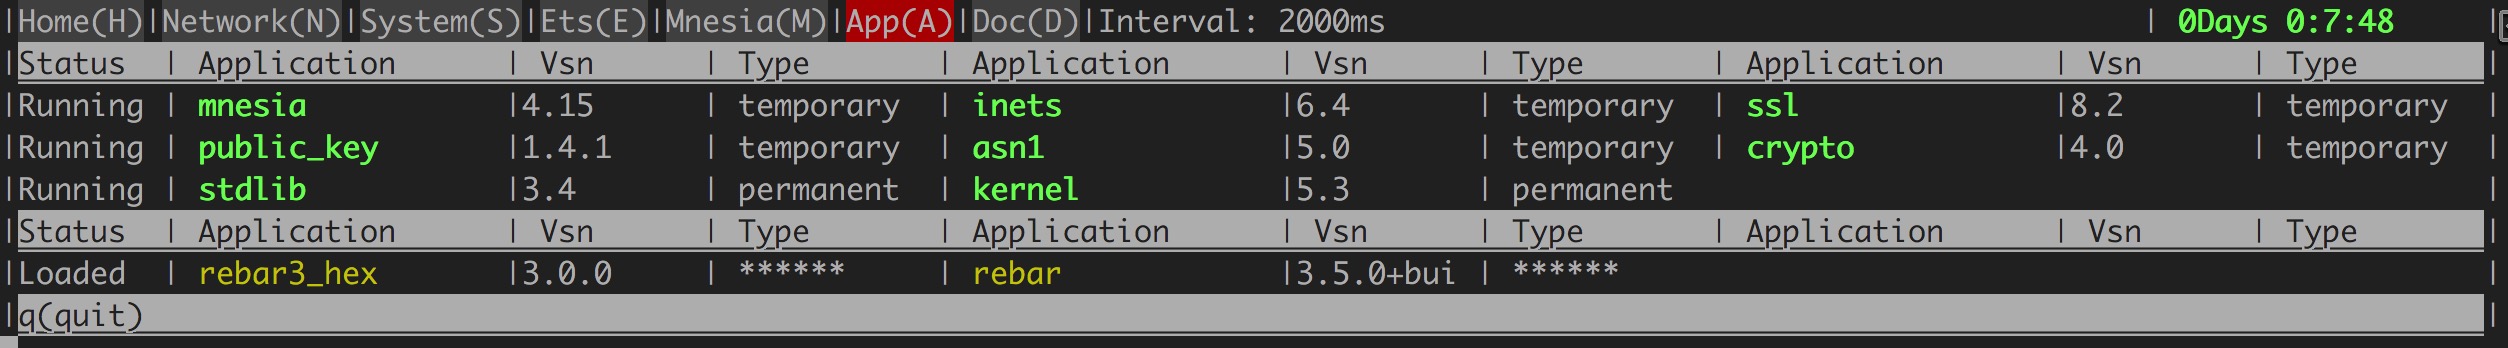
- add application GUI.
- Rearrange GUI and optimize render.
- Always automatically adapt to the window size.
-
1.1.0
- Support escript,
observer_cli <TARGETNODE> <COOKIE>
- Support escript,
-
1.0.9
- Upgrade rebar3 to 3.3.3 for publish hex repo.
 zhongwencool 💻 |
 Dimitrios Zorbas 💻 |
 taotao 💻 |
 Trevor Brown 💻 |
 Zaiming Shi 💻 |
|---|
See the LICENSE file for license rights and limitations (MIT).


