bittremieux / spectrum_utils Goto Github PK
View Code? Open in Web Editor NEWPython package for efficient mass spectrometry data processing and visualization
Home Page: https://spectrum-utils.readthedocs.io/
License: Apache License 2.0
Python package for efficient mass spectrometry data processing and visualization
Home Page: https://spectrum-utils.readthedocs.io/
License: Apache License 2.0
Hello,
I am trying to plot a mirror plot using the example provided in the spectrum_utils document (https://spectrum-utils.readthedocs.io/en/latest/plotting.html#mirror-plot). The "sus.MsmsSpectrum.from_usi(usi_bottom)", where it fetches the spectra throws the below error.
    spectrum_top = sus.MsmsSpectrum.from_usi(usi_top)
  File "C:\Users\new\AppData\Local\Programs\Python\Python310\lib\site-packages\spectrum_utils\spectrum.py", line 345, in from_usi
    raise ValueError(
ValueError: Unknown precursor m/z from USI. Specify the precursor m/z directly.
However, it works great when I execute the mirror plot function of pyteomics with 'spectrum_utils' backend.
Can you please solve this issue?
Here, I am trying to plot experimental and predicted spectra using the mirror plot. can I extend its application apart from USI?
Thanks,
Chinmaya
Hello,
I am currently playing around with the toolbox and its visualization capabilities - thank you!
I ran into a few smaller issues and wanted to report them here:
I installed spectrum_utils from git:
pip install git+https://github.com/bittremieux/spectrum_utils
One issue was that the rdkit dependency was missing:
conda install -c conda-forge rdkit
I ran into another issue regarding numba version 0.45.1 (due to the deprication of the "reflection list"):
/usr/local/miniconda3/envs/test_py37/lib/python3.7/site-packages/numba/ir_utils.py:1959: NumbaPendingDeprecationWarning:
Encountered the use of a type that is scheduled for deprecation: type 'reflected list' found for argument 'annotation_mz' of function '_get_peptide_fragment_annotation_map'.

For more information visit http://numba.pydata.org/numba-doc/latest/reference/deprecation.html#deprecation-of-reflection-for-list-and-set-types

File "../../../../../../usr/local/miniconda3/envs/test_py37/lib/python3.7/site-packages/spectrum_utils/spectrum.py", line 507:
@nb.njit
def _get_peptide_fragment_annotation_map(
^

  warnings.warn(NumbaPendingDeprecationWarning(msg, loc=loc))

Process finished with exit code 0
I "fixed" it by installing the numba version 0.42.1
pip install numba==0.42.1
Hi Wout,
Thanks for adding the PTM support and the notebook tutorial. I will see if I can script up some phospho peptide pictures over the weekend. How was the snow? It mostly missed us down here in sunny PDX.
Cheers,
Phil
Hello there!
I was using the package and noted an unexpected behavior, where setting the static modifications twice in the code (inadvertedly) made the mass offsets of an aminoacid to double instead of keeping the provided mass
Dummy example with plots:
https://colab.research.google.com/drive/1x913OBS6ieRPLY3H91cT_wopxGvCKdQy?usp=sharing
"Error" source in the code
spectrum_utils/spectrum_utils/spectrum.py
Lines 26 to 40 in c45c309
Expected behavior:
Setting twice the same static modifications for an amino acid would keep the first one, instead of doubling the offset of the mass
Possible solutions:
static_modification to decide how to handle those cases, whether the mass diff should over-write the current one or append to it.Potential code change:
def static_modification(amino_acid: str, mass_diff: float) -> None:
    """
    Globally modify the monoisotopic mass of an amino acid to set a static
    modification.
    Parameters
    ----------
    amino_acid : str
        The amino acid whose monoisotopic mass is modified.
    mass_diff : float
        The *mass difference* to be added to the amino acid's original
        monoisotopic mass.
    """
    global aa_mass
    ############## >>>> ADDITION <<<<<< ###############
    if _aa_mass[amino_acid] != aa_mass[amino_acid]:
        warnings.warn(f"Amino acid {amino_acid} already has a mass offset of {aa_mass[amino_acid] - _aa_mass[amino_acid]}, the provided mass of {mass_diff} will be added to that")
    ############## >>>>END OF ADDITION <<<<<< ###############

    aa_mass[amino_acid] += mass_diff
let me know what you think
Kindest wishes
Sebastian
While using annotate_proforma(), we noticed that several fragments have isotopic peaks, which are currently not annotated.
Hi Wout,
Are PTMs supported? I have some (variable) phospho (static) TMT peptides (also with variable Met oxidation and static C+57) to plot for an MCP submission. Thanks and Happy Holidays!
-Phil
Hello there!
It is me again!
I was wondering if you had a list of features in mind for the next release of the package.
I am interested in using the package for a project of mine and since I noticed there will be a fair amount of changes in the API
based on the current state of the master branch I was hoping to help that release get out of the way.
We could set up a milestone for V0.36 (maybe ...)
The prelim list I can think of is:
So .... Do you want to start a branch to get those out of the way? or if I have a contribution to get those out of the way should I PR against master?
Best!
Sebastian
Hi,
I am using spectrum_utils to annotate spectra from an mzML file. I've noticed that certain peaks are not annotated when the fragment_tol_mass/fragment_tol_mode are set to correctly identify them. I've pasted a DropBox link with my code, mzML file, and a Powerpoint file with two spectra displaying the issue. The base peak in the spectrum I've chosen is the peptides b7+ ion, which I've verified from the raw data is 2-3 ppm off of the theoretical mass. The peak isn't annotated when the fragment_tol_mass is set to 10 ppm. It is annotated, however, when the fragment_tol_mass is set to 20 ppm.
Thanks,
Geoff
https://www.dropbox.com/sh/feoss7jqra5fsil/AACoHcZ9umTJQ3OnF6hVxcfJa?dl=0
Hi,
Thanks for your great works, but can you give more examples to show the functions of your package? or could you please provide a demo mgf file?
Best wishes,
Ji
Hi,
I would like to have the precursor peak annotated as well in the plotted spectrum. If this is already possible, please tell me how and I am gone immediately, but it seems 'ion_types' can only be [abcxyz].
Is it possible to implement this? There seems to be already a functionality to detect the precursor peak based on the calculated mass and the tolerance, so I am hoping it would mostly be about the visualisation.
Anyways, thanks for the great work on this!
Jonas
sorry to bother you, its an amazing tools to visualize mass data, but i don't know how to use spectrum_utils to process mzml data imported by pymzml package. i'm not good at computer science. desperately need your help, thanks!
Don't crash when plotting spectra without peaks.
My peptide cannot be described with proforma.
Does anyone have an example script of how to annotate from a custom table of fragments in tabular format ie (name,mz)
import spectrum_utils.plot as sup
import spectrum_utils.spectrum as sus
import spectrum_utils.fragment_annotation as frg
import numpy as np


# Retrieve the spectrum by its USI.
identifier = "non-conventional peptide"
precursor_mz = 600
precursor_charge = 2
mz = np.array([160, 200, 300, 400, 500])
intensity = np.array([4, 5, 6, 7, 8])
retention_time = 3.02
spectrum = sus.MsmsSpectrum(identifier,precursor_mz,precursor_charge,mz,intensity,retention_time)

fragment1 = "200"
fragment1_label = "y1"

fig, ax = plt.subplots(figsize=(12, 6))
sup.spectrum(spectrum,grid=False, ax=ax)
ax.set_title(identifier, fontdict={"fontsize": "xx-large"})
ax.spines["right"].set_visible(False)
ax.spines["top"].set_visible(False)
plt.savefig("annot_fmt.png", dpi=300, bbox_inches="tight", transparent=True)
plt.show()```
Hi Wout,
Spectrum_utils is so powerful that I have completely switched to spectrum visualization using this tool. Spectrum_utils should be able to remove noise peaks, but I only see the function Msmsspectrum.filter_intensity(). I wonder if spectrum_utils can filter the peaks according to the signal to noise ratio? Is there any interest in adding this function?
Danyung
grid_b was deprecated in version >=3.7, causes an error.
I was able to fix by pinning matplotlib to version 3.6.3
Hi and thank you for the great package!
First time using it and it seems to have a problem annotating one of my spectra where the precursor charge is 1.
Code causing the problem: s.annotate_peptide_fragments(0.5, 'Da', ion_types='aby') (copied from docs)
Error:
ValueError                                Traceback (most recent call last)
<ipython-input-143-823c7e798d31> in <module>
----> 1 s.annotate_peptide_fragments(0.5, 'Da', ion_types='aby',)

/usr/lib/python3.8/site-packages/spectrum_utils/spectrum.py in annotate_peptide_fragments(self, fragment_tol_mass, fragment_tol_mode, ion_types, max_ion_charge, peak_assignment)
   1049             warnings.simplefilter('ignore', nb.NumbaPendingDeprecationWarning)
   1050             for annotation_i, fragment_i in\
-> 1051                     _get_peptide_fragment_annotation_map(
   1052                         self.mz, self.intensity,
   1053                         [fragment.calc_mz for fragment

ValueError: cannot compute fingerprint of empty list
The error goes away if I specify max_ion_charge=1. Perhaps it makes sense to make the default value be 1 if the precursor charge is 1.
The spectrum is:
{'identifier': 'MVQALSLGGG',
 'precursor_mz': 932.48697878668,
 'precursor_charge': 1,
 '_mz': array([190.08223, 231.11618, 303.1663 , 359.17474, 390.19833, 430.21185,
        503.28238, 543.29596, 574.3195 , 630.32794, 702.37805, 743.41205,
        800.4335 , 857.45496], dtype=float32),
 '_intensity': array([0.20990807, 0.28059167, 0.16901207, 0.6857932 , 0.2795136 ,
        1.        , 0.34787884, 0.676259  , 0.25297335, 0.6218561 ,
        0.23610453, 0.33881018, 0.3910684 , 0.22612093], dtype=float32),
 '_annotation': array([None, None, None, None, None, None, None, None, None, None, None,
        None, None, None], dtype=object),
 'retention_time': 78.90333557128906,
 'peptide': 'MVQALSLGGG',
 'modifications': {},
 'is_decoy': False}
Best regards,
Lev
Hi I checked the documentation but couldn't find information on how to add an N-term addition such as a TMT tag. TIA!
I wrote a script (attached) based on your tutorial example that attempts to plot an annotated spectrum. The script runs happily, but the spectrum has no annotation in the resulting plot. Can you let me know if I'm doing something wrong here?

The command line was
../../../bin/annotate_spectrum.py --mgf sample.mgf --scan 13542 --peptide EEEEEEEDGEEEEEEEEEEEEEEEEEEDEEEEEEEEEEEEEEEEEEEEEEEEEE --root sample
It seems that fastobo only offers wheels for Linux systems, making it a painful to install on a Mac. One solution is to contribute a MacOS build to fastobo, but is there another dependency that could work in its stead?
For example, here's the error I get when installing with pip:
ImportError: dlopen(/Users/wfondrie/mambaforge/lib/python3.10/site-packages/fastobo.cpython-310-darwin.so, 0x0002): tried: '/Users/wfondrie/mambaforge/lib/python3.10/site-packages/fastobo.cpython-310-darwin.so' (mach-o file, but is an incompatible architecture (have 'x86_64', need 'arm64')), '/System/Volumes/Preboot/Cryptexes/OS/Users/wfondrie/mambaforge/lib/python3.10/site-packages/fastobo.cpython-310-darwin.so' (no such file), '/Users/wfondrie/mambaforge/lib/python3.10/site-packages/fastobo.cpython-310-darwin.so' (mach-o file, but is an incompatible architecture (have 'x86_64', need 'arm64'))
Greetings,
I am a new user to your tool and also and newbie in python. Sorry for the trouble.
I am currently, trying to mirror two fragment ion spectrum for the same peptide (same modification, charge and RT) from two different .mgf files. Based on my low level knowledge in python coding language, what I can understanding from your sample script written for mirror plotting (script provided at the bottom for your reference) ------> The script will only enable mirror of fragment ion fragment to theoretical ion fragment profile of my peptide of interest. If my understanding is correct, by any chance will you be able to provide me with a script utilizing your tool to mirror two same fragment ion fragment from two different .mgf files?
Lastly, I would like to thank you in advance for your assistance with my query.
Regards, Ben
import matplotlib.pyplot as plt
import spectrum_utils.plot as sup
import spectrum_utils.spectrum as sus
from pyteomics import mgf
spectra = []
for spectrum_dict in mgf.read('spectra.mgf'):
if 'DLTDYLMK' in spectrum_dict['params']['title']:
identifier = spectrum_dict['params']['title']
precursor_mz = spectrum_dict['params']['pepmass'][0]
precursor_charge = spectrum_dict['params']['charge'][0]
mz = spectrum_dict['m/z array']
intensity = spectrum_dict['intensity array']
retention_time = float(spectrum_dict['params']['rtinseconds'])
peptide = 'DLTDYLMK'
modifications = {6: 15.994915}
    # Create the MS/MS spectrum.
    spectra.append(sus.MsmsSpectrum(identifier, precursor_mz,
                                    precursor_charge, mz, intensity,
                                    retention_time=retention_time,
                                    peptide=peptide,
                                    modifications=modifications)
                   .filter_intensity(0.01, 50)
                   .scale_intensity('root')
                   .annotate_peptide_fragments(0.5, 'Da', ion_types='aby'))
fig, ax = plt.subplots(figsize=(12, 6))
spectrum_top, spectrum_bottom = spectra
sup.mirror(spectrum_top, spectrum_bottom, ax=ax)
plt.show()
plt.close()
Properly encode a USI string using urllib.parse.quote_plus to ensure correct querying.
Hi Wout,
I was trying the example notebook and I got the below error message after reading in the spectrum - is there a dependency on latex somewhere to plot a spectrum?
A tip is to include the minimum version numbers - I had a slightly older version of thepyteomics package that did not include the get_mgf functionality you are using.
Cheers Justin
plot.spectrum(spec)

plt.show()
plt.close()
returned: FileNotFoundError: [Errno 2] No such file or directory: 'latex': 'latex'
When Numba 0.55 is officially available. (numba/issues/7562)
Hi Wout,
I recently added spectrum_utils plotting to MS²PIP (works great, thanks!). When running tests in GitHub Actions, I ran into the issue that RDKit is not installed using pip. Since RDKit is only used for molecule drawing, would you agree to make RDKit an optional dependency?
I would propose to put the rdkit imports in a try/except statement, and output a warning if the import fails. E.g. replace
spectrum_utils/spectrum_utils/plot.py
Lines 9 to 10 in 842de8b
with
try:
    from rdkit import Chem
    from rdkit.Chem import Draw
except ImportError:
    warnings.warn("RDKit could not be imported. Some spectrum_utils functionality related to molecule drawing might lead to a NameError.", category=ImportWarning)
If you agree, I can open a PR.
Hello,
Is there an option to annotate specific diagnostic ions (which are Immonium ions losing NH3). For example, Kacetyl it will be 126.09 m/z?
Thank you.
Hassan
Dear developers,
I am using spectrum_utils for visualization and love the package. I recently upgraded the version to 0.4.2 (I believe I was at 3.2).
I was wondering about the intended way to annotate mz fragments (without having a peptide sequence or any other structural annotation). I am using metabolomics data, mostly missing any form of annotation and would like to highlight specific peaks. The MsmsSpectrum function annotate_mz_fragment seems to be removed with the newer version. Prior to this, I was adding a tag to desired peaks, but never managed to highlight these by color. Is there an intended way of singling out peaks by their mz and color code them manually?
Thanks for putting so much work into keeping up the package :)
Currently an incorrect mass difference is used to find non-monoisotopic precursor peaks.
print(inspect.signature(spectrum.annotate_peptide_fragments))
Returns
(fragment_tol_mass: float, fragment_tol_mode: str, ion_types: str = 'by', max_ion_charge: Union[int, NoneType] = None, peak_assignment: str = 'most_intense') -> 'MsmsSpectrum'
Was this feature removed?
The GnpsBackend should use "https://metabolomics-usi.gnps2.org/proxi/v{version}/spectra?usi={usi}" now.
Noticed that appdirs is a depencency.
This has been deprecated for a time now: https://github.com/ActiveState/appdirs?tab=readme-ov-file in favor of platformdirs: https://pypi.org/project/platformdirs/
They both have the same API so the migration should be seamless. LMK if you want a PR for it.
Numba 0.46 doesn't support Python 3.8. See for example numba/numba#4712.
Example of failed unit test:
E       numba.errors.LoweringError: Failed in nopython mode pipeline (step: nopython mode backend)
E       Failed in nopython mode pipeline (step: analyzing bytecode)
E       list index out of range
E
E       File "../../../miniconda/envs/test/lib/python3.8/site-packages/spectrum_utils-0.3.2-py3.8.egg/spectrum_utils/spectrum.py", line 616:
E       <source missing, REPL/exec in use?>
E
E       [1] During: lowering "$76.14 = call $76.2($76.13, func=$76.2, args=[Var($76.13, /home/travis/miniconda/envs/test/lib/python3.8/site-packages/spectrum_utils-0.3.2-py3.8.egg/spectrum_utils/spectrum.py (616))], kws=(), vararg=None)" at /home/travis/miniconda/envs/test/lib/python3.8/site-packages/spectrum_utils-0.3.2-py3.8.egg/spectrum_utils/spectrum.py (616)
E
E       -------------------------------------------------------------------------------
E       This should not have happened, a problem has occurred in Numba's internals.
E       You are currently using Numba version 0.46.0.
E
E       Please report the error message and traceback, along with a minimal reproducer
E       at: https://github.com/numba/numba/issues/new
E
E       If more help is needed please feel free to speak to the Numba core developers
E       directly at: https://gitter.im/numba/numba
E
E       Thanks in advance for your help in improving Numba!
../../../miniconda/envs/test/lib/python3.8/site-packages/numba/six.py:669: LoweringError
As soon as a py3.8-version compatible Numba version (0.47) is available:
setup.py and the Bioconda recipe..travis.yml.Include code examples in the documentation on how to read spectra from peak files using various software packages (Pyteomics) and initializing MsmsSpectrum objects.
I am loading a spectrum by USI like this
usi = "mzspec:PXD031817:MSB19717Trypsin021915:scan:1930"
spectrum = spectrum_utils.spectrum.MsmsSpectrum.from_usi(usi)
but I get this error:
Traceback (most recent call last):
  File "./plot-annotated-spectrum.py", line 30, in <module>
    spectrum = spectrum_utils.spectrum.MsmsSpectrum.from_usi(usi)
  File "/net/noble/vol1/home/noble/miniconda3/envs/spectrum_utils/lib/python3.8\
/site-packages/spectrum_utils/spectrum.py", line 345, in from_usi
    raise ValueError(
ValueError: Unknown precursor m/z from USI. Specify the precursor m/z directly.
If I download the file and convert to MGF, that spectrum looks like this:
BEGIN IONS
TITLE=controllerType=0 controllerNumber=1 scan=1930
SCANS=1930
RTINSECONDS=769.87164
PEPMASS=384.879058837891
CHARGE=3+
101.0714035 1807.1617431641
110.0717926 183053.5468750000
111.0751266 8941.6181640625
112.0874252 1604.1121826172
...
It has the peptide mass and the charge. Why can't it figure out the m/z?
Not sure if its an option
spectrum_utils/spectrum_utils/spectrum.py
Lines 675 to 677 in 437acb7
This line makes it so that ... when passing a wrong mass mode ('da' instead of 'Da') in my case, it assumes it is ppm .... which makes a cutoff of 0.02 much too narrow in most use cases ... (took me a non-negligible amount of time to figure out why none of my peaks was getting annotated)
Would you mind adding checks such that there is a warning/error if a non-supported mass type is passed?
Hi, I would like to annotate a peak with structure as is shown in Figure 1.B in the paper but I am getting its SMILES string instead of the structure:

I am using the following code:
spectrum = sus.MsmsSpectrum(usi, precursor_mz, charge, mzs, intensities)\
           .annotate_molecule_fragment(precursor_smiles, precursor_mz, charge, 5, 'ppm')
spectrum_plot = sup.spectrum(spectrum)
Maybe it is the wrong way to do it, but I couldn't find an example or figure it out in the documentation.
Thanks!
M1 mac installation is not functional due to an upstream dependency.
It happens because the package (fastobo) does not provide an arm64 wheel, and it installs
the x86 version, which fails at runtime.
I am leaving here the solution I found that works. Will close it when it gets solved upstream
You need to build the wheel yourself, by using ....
python -m pip install --upgrade --force --no-binary=fastobo fastobo
and then everything magically works
When install in python 3.11, the following error occurs:
Preparing metadata (setup.py) ... error
  error: subprocess-exited-with-error

  × python setup.py egg_info did not run successfully.
  │ exit code: 1
  ╰─> [8 lines of output]
      Traceback (most recent call last):
        File "<string>", line 2, in <module>
        File "<pip-setuptools-caller>", line 34, in <module>
        File "/tmp/pip-install-glfat_q4/numba_5afd43df9d974845953722af212a915c/setup.py", line 51, in <module>
          _guard_py_ver()
        File "/tmp/pip-install-glfat_q4/numba_5afd43df9d974845953722af212a915c/setup.py", line 48, in _guard_py_ver
          raise RuntimeError(msg.format(cur_py, min_py, max_py))
      RuntimeError: Cannot install on Python version 3.11.0; only versions >=3.7,<3.11 are supported.
      [end of output]

  note: This error originates from a subprocess, and is likely not a problem with pip.
error: metadata-generation-failed

× Encountered error while generating package metadata.
╰─> See above for output.

note: This is an issue with the package mentioned above, not pip.
hint: See above for details.
Is it possible to modify the setup file to allow installation? Thanks.
[feature request]
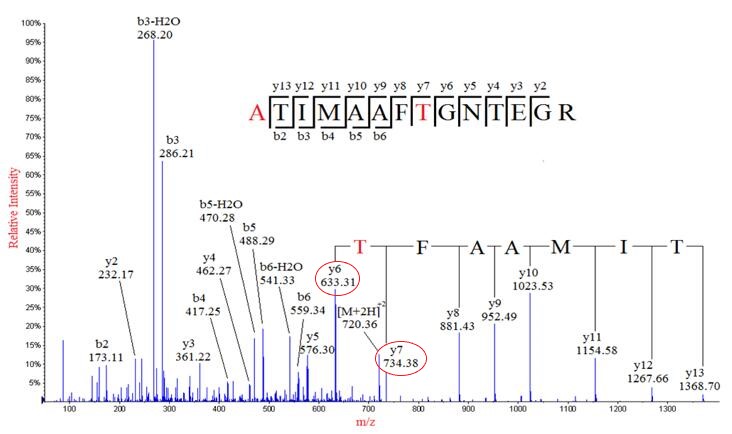
I was wondering if there is any desire to implement "adding the annotated ions on the peptide sequence string". "P]E]P]TIDEP[I[N[K" kind of deal ...
like it is show in the following image
(in addition it would be great to have precursor ion annotations, let me know if you would like to make a new issue for it/try to implement it)
my_spectrum_top.annotate_peptide_fragments(0.5, 'Da', ion_types='p')Thanks for the great package!
Sebastian
EDIT: Adding precursor ions to annotation is already supported!
Hi, thank you once again for this package. I am currently using it for some bulk annotations and, due to the rounding of ppm values to 1 decimal digit, I get very discrete values, which is not ideal for statistical analysis. Do you think it would be possible to enable more digits somehow?
I think this line is relevant:
spectrum_utils/spectrum_utils/spectrum.py
Line 736 in 826f770
Thank you!
Hi Wout,
This is an amazing tool to visualize annotated spectra, but i have a problem when running the tool with python. The error tells that i have no package containing 'annotate_proforma'. I have installed spectrum_utils using pip, and my python version is 3.11. Below is my python script and the error.
import matplotlib.pyplot as plt
import pyteomics.mgf
import spectrum_utils.spectrum as sus
import spectrum_utils.plot as sup
import numba as nb
import numpy as np

min_peaks = 10
min_mz, max_mz = 100, 1400
fragment_tol_mass, fragment_tol_mode = 0.02, "Da"
min_intensity = 0.05
max_num_peaks = 150

for spec_dict in pyteomics.mgf.read(r"F:\myb_mgf\log\1\LUMOS2_20220414_XP_MSH_4TI_Log_1_R1_HCDIT\LUMOS2_20220414_XP_MSH_4TI_Log_1_R1.26848.26848.3.0.mgf"):
    # Omit invalid spectra.
    peptide="VGCFR[Phospho]PPTVPAGTSR"
    if (
        len(spec_dict["m/z array"]) < min_peaks
        or "charge" not in spec_dict["params"]
    ):
        continue

    spectrum = sus.MsmsSpectrum(
        spec_dict["params"]["title"],
        spec_dict["params"]["pepmass"][0],
        spec_dict["params"]["charge"][0],
        spec_dict["m/z array"],
        spec_dict["intensity array"],
        float(spec_dict["params"]["rtinseconds"]),
    )._inner
    spectrum.annotate_proforma(peptide,fragment_tol_mass=0.5,fragment_tol_mode="Da",ion_types="by",neutral_losses={"H3PO4": -97.9769})

    fig, ax = plt.subplots(figsize=(12, 6))
    sup.spectrum(spectrum, grid=False, ax=ax)
    ax.set_title(peptide, fontdict={"fontsize": "xx-large"})
    ax.spines["right"].set_visible(False)
    ax.spines["top"].set_visible(False)
    plt.savefig("F:\neutral_losses_1.png", dpi=300, bbox_inches="tight", transparent=True)
    plt.close()

I'm not good at python and I desperately need your help!
Thanks in advance,
Danyung
I noticed that plotting does not work in certain versions of matplotlib...
Here is the traceback...
File .../virtualenvs/.../lib/python3.9/site-packages/spectrum_utils/plot.py:178, in spectrum(spec, color_ions, annot_fmt, annot_kws, mirror_intensity, grid, ax)
    176 ax.yaxis.set_minor_locator(mticker.AutoMinorLocator())
    177 if grid in (True, "both", "major"):
--> 178     ax.grid(b=True, which="major", color="#9E9E9E", linewidth=0.2)
    179 if grid in (True, "both", "minor"):
    180     ax.grid(b=True, which="minor", color="#9E9E9E", linewidth=0.2)
That leads to this line:
spectrum_utils/spectrum_utils/plot.py
Line 178 in 437acb7
And it breaks bebcause in matplotlib v3.5 that argument changed (to not have the b kwarg)
https://matplotlib.org/3.4.3/api/_as_gen/matplotlib.axes.Axes.grid.html
https://matplotlib.org/3.5.3/api/_as_gen/matplotlib.axes.Axes.grid.html
And since the version is not pinned, one can install either of them.
Line 30 in 437acb7
Solutions:
Op1 -> Pin the version requirement of matplotlib to ">=3.4.0,<3.5.0"
Op2 -> Pin a newer version and stop using the b argument.
LMK what you think
Best!
Sebastian
Hello,
I tried to draw a spectrum with neutral losses but I get the error from the title. The following works fine:
spectrum.annotate_peptide_fragments(fragment_tol_mass, fragment_tol_mode, ion_types='aby')
but this breaks:
spectrum.annotate_peptide_fragments(fragment_tol_mass, fragment_tol_mode, ion_types='aby', neutral_losses={'NH3': -17.026549, 'H2O': -18.010565})
I can't find a method definition for annotate_peptide_fragments anywhere in this repo, is it from a different package?
Thank you!
Mention in the documentation that pyteomics.cythonize can be installed separately to speed up mass calculations.
Hi Wout - when installing spectrum_utils using conda with
conda install -c bioconda spectrum_utils
as suggested here, I noted that RDkit didn't install automatically, as advertised on the page. I had to manually
conda install -c conda-forge rdkit
to get spectrum_utils to work.
Hope this helps.
This might be subsumed into #18 as that should be part of the spec.
Currently, as a user, I fake this by replacing all X's with G and modify the gapped mass value as a faked PTM on the G.
A declarative, efficient, and flexible JavaScript library for building user interfaces.
🖖 Vue.js is a progressive, incrementally-adoptable JavaScript framework for building UI on the web.
TypeScript is a superset of JavaScript that compiles to clean JavaScript output.
An Open Source Machine Learning Framework for Everyone
The Web framework for perfectionists with deadlines.
A PHP framework for web artisans
Bring data to life with SVG, Canvas and HTML. 📊📈🎉
JavaScript (JS) is a lightweight interpreted programming language with first-class functions.
Some thing interesting about web. New door for the world.
A server is a program made to process requests and deliver data to clients.
Machine learning is a way of modeling and interpreting data that allows a piece of software to respond intelligently.
Some thing interesting about visualization, use data art
Some thing interesting about game, make everyone happy.
We are working to build community through open source technology. NB: members must have two-factor auth.
Open source projects and samples from Microsoft.
Google ❤️ Open Source for everyone.
Alibaba Open Source for everyone
Data-Driven Documents codes.
China tencent open source team.