![]()


![]()
Memray is a memory profiler for Python. It can track memory allocations in Python code, in native extension modules, and in the Python interpreter itself. It can generate several different types of reports to help you analyze the captured memory usage data. While commonly used as a CLI tool, it can also be used as a library to perform more fine-grained profiling tasks.
Notable features:
- 🕵️♀️ Traces every function call so it can accurately represent the call stack, unlike sampling profilers.
- ℭ Also handles native calls in C/C++ libraries so the entire call stack is present in the results.
- 🏎 Blazing fast! Profiling slows the application only slightly. Tracking native code is somewhat slower, but this can be enabled or disabled on demand.
- 📈 It can generate various reports about the collected memory usage data, like flame graphs.
- 🧵 Works with Python threads.
- 👽🧵 Works with native-threads (e.g. C++ threads in C extensions).
Memray can help with the following problems:
- Analyze allocations in applications to help discover the cause of high memory usage.
- Find memory leaks.
- Find hotspots in code that cause a lot of allocations.
Note Memray only works on Linux and MacOS, and cannot be installed on other platforms.

We are constantly looking for feedback from our awesome community ❤️. If you have used Memray to solve a problem, profile an application, find a memory leak or anything else, please let us know! We would love to hear about your experience and how Memray helped you.
Please, consider writing your story in the Success Stories discussion page.
It really makes a difference!
Memray requires Python 3.7+ and can be easily installed using most common Python packaging tools. We recommend installing the latest stable release from PyPI with pip:
python3 -m pip install memrayNotice that Memray contains a C extension so releases are distributed as binary wheels as well as the source code. If a binary wheel is not available for your system (Linux x86/x64 or macOS), you'll need to ensure that all the dependencies are satisfied on the system where you are doing the installation.
If you wish to build Memray from source you need the following binary dependencies in your system:
- libunwind (for Linux)
- liblz4
Check your package manager on how to install these dependencies (for example apt-get install libunwind-dev liblz4-dev in Debian-based systems
or brew install lz4 in MacOS). Note that you may need to teach the compiler where to find the header and library files of the dependencies. For
example, in MacOS with brew you may need to run:
export CFLAGS="-I$(brew --prefix lz4)/include" LDFLAGS="-L$(brew --prefix lz4)/lib -Wl,-rpath,$(brew --prefix lz4)/lib"before installing memray. Check the documentation of your package manager to know the location of the header and library
files for more detailed information.
If you are building on MacOS, you will also need to set the deployment target.
export MACOSX_DEPLOYMENT_TARGET=10.14Once you have the binary dependencies installed, you can clone the repository and follow with the normal building process:
git clone [email protected]:bloomberg/memray.git memray
cd memray
python3 -m venv ../memray-env/  # just an example, put this wherever you want
source ../memray-env/bin/activate
python3 -m pip install --upgrade pip
python3 -m pip install -e . -r requirements-test.txt -r requirements-extra.txt
This will install Memray in the virtual environment in development mode (the -e of the last pip install command).
If you plan to contribute back, you should install the pre-commit hooks:
pre-commit installThis will ensure that your contribution passes our linting checks.
You can find the latest documentation available here.
There are many ways to use Memray. The easiest way is to use it as a command line tool to run your script, application, or library.
usage: memray [-h] [-v] {run,flamegraph,table,live,tree,parse,summary,stats} ...

Memory profiler for Python applications

Run `memray run` to generate a memory profile report, then use a reporter command
such as `memray flamegraph` or `memray table` to convert the results into HTML.

Example:

    $ python3 -m memray run -o output.bin my_script.py
    $ python3 -m memray flamegraph output.bin

positional arguments:
  {run,flamegraph,table,live,tree,parse,summary,stats}
                        Mode of operation
    run                 Run the specified application and track memory usage
    flamegraph          Generate an HTML flame graph for peak memory usage
    table               Generate an HTML table with all records in the peak memory usage
    live                Remotely monitor allocations in a text-based interface
    tree                Generate a tree view in the terminal for peak memory usage
    parse               Debug a results file by parsing and printing each record in it
    summary             Generate a terminal-based summary report of the functions that allocate most memory
    stats               Generate high level stats of the memory usage in the terminal

optional arguments:
  -h, --help            Show this help message and exit
  -v, --verbose         Increase verbosity. Option is additive and can be specified up to 3 times
  -V, --version         Displays the current version of Memray

Please submit feedback, ideas, and bug reports by filing a new issue at https://github.com/bloomberg/memray/issues
To use Memray over a script or a single python file you can use:
python3 -m memray run my_script.pyIf you normally run your application with python3 -m my_module, you can use the -m flag with memray run:
python3 -m memray run -m my_moduleYou can also invoke Memray as a command line tool without having to use -m to invoke it as a module:
memray run my_script.py
memray run -m my_module
The output will be a binary file (like memray-my_script.2369.bin) that you can analyze in different ways. One way is to use the memray flamegraph command to generate a flame graph:
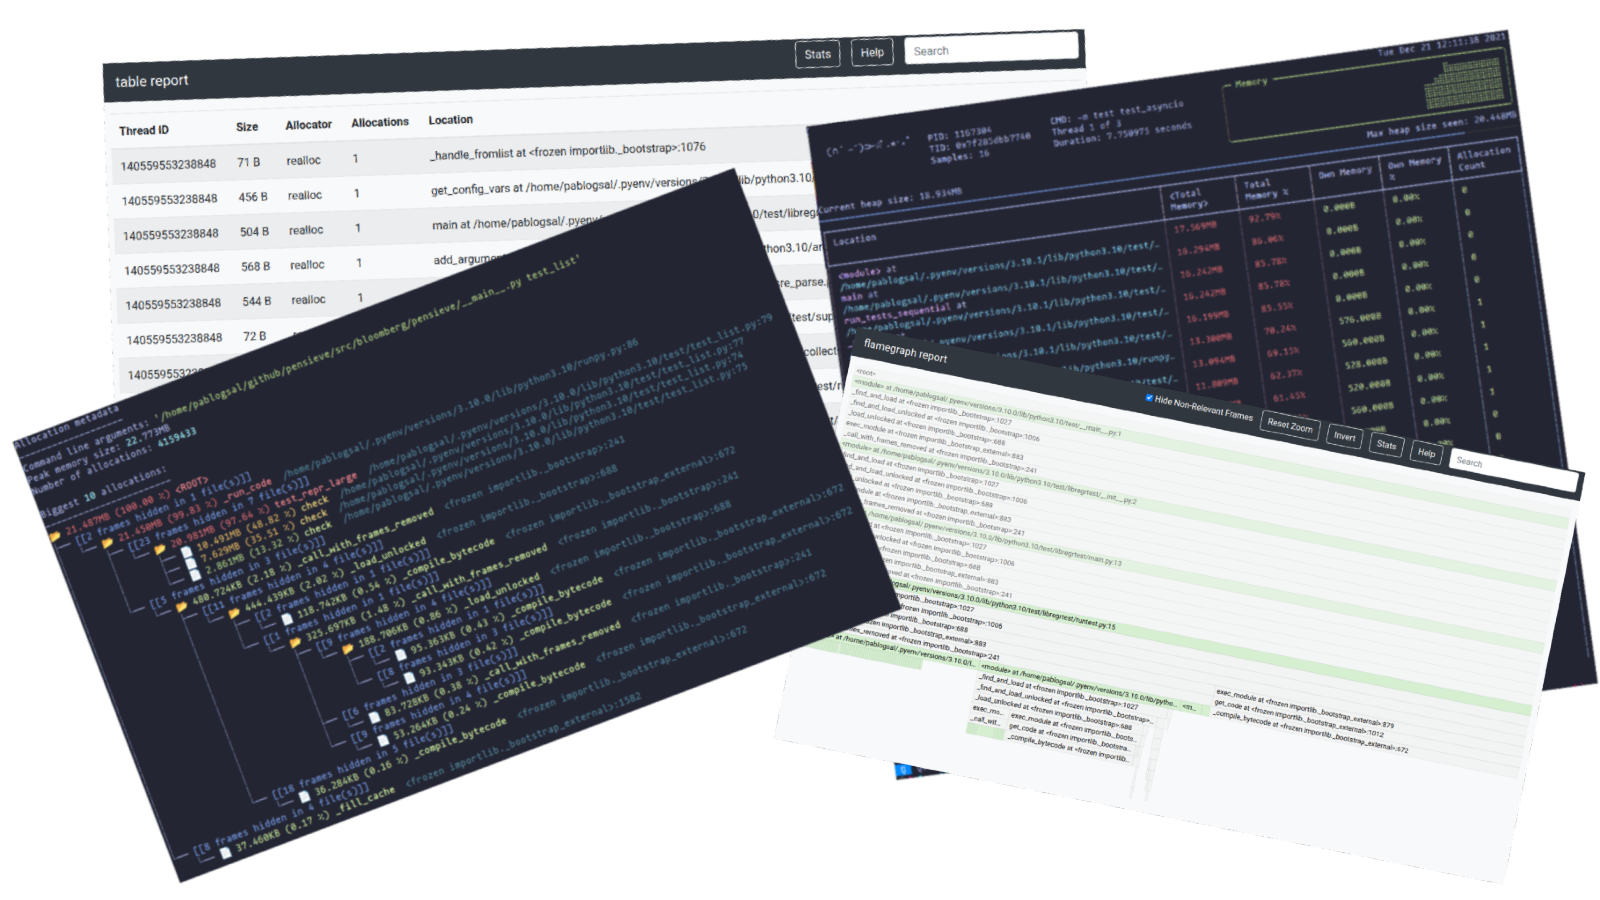
memray flamegraph my_script.2369.binThis will produce an HTML file with a flame graph of the memory usage that you can inspect with your favorite browser. There are multiple other reporters that you can use to generate other types of reports, some of them generating terminal-based output and some of them generating HTML files. Here is an example of a Memray flamegraph:

If you want an easy and convenient way to use memray in your test suite, you can consider using pytest-memray. Once installed, this pytest plugin allows you to simply add --memray to the command line invocation:
pytest --memray tests/And will automatically get a report like this:
python3 -m pytest tests --memray
=============================================================================================================================== test session starts ================================================================================================================================
platform linux -- Python 3.8.10, pytest-6.2.4, py-1.10.0, pluggy-0.13.1
rootdir: /mypackage, configfile: pytest.ini
plugins: cov-2.12.0, memray-0.1.0
collected 21 items

tests/test_package.py .....................                                                                                                                                                                                                                      [100%]


================================================================================================================================= MEMRAY REPORT ==================================================================================================================================
Allocations results for tests/test_package.py::some_test_that_allocates

	 📦 Total memory allocated: 24.4MiB
	 📏 Total allocations: 33929
	 📊 Histogram of allocation sizes: |▂   █    |
	 🥇 Biggest allocating functions:
		- parse:/opt/bb/lib/python3.8/ast.py:47 -> 3.0MiB
		- parse:/opt/bb/lib/python3.8/ast.py:47 -> 2.3MiB
		- _visit:/opt/bb/lib/python3.8/site-packages/astroid/transforms.py:62 -> 576.0KiB
		- parse:/opt/bb/lib/python3.8/ast.py:47 -> 517.6KiB
		- __init__:/opt/bb/lib/python3.8/site-packages/astroid/node_classes.py:1353 -> 512.0KiB
You can also use some of the included markers to make tests fail if the execution of said test allocates more memory than allowed:
@pytest.mark.limit_memory("24 MB")
def test_foobar():
    # do some stuff that allocates memory
To learn more on how the plugin can be used and configured check out the plugin documentation.
Memray supports tracking native C/C++ functions as well as Python functions. This can be especially useful when profiling applications that have C extensions (such as numpy or pandas) as this gives a holistic vision of how much memory is allocated by the extension and how much is allocated by Python itself.
To activate native tracking, you need to provide the --native argument when using the run subcommand:
memray run --native my_script.pyThis will automatically add native information to the result file and it will be automatically used by any reporter (such the flamegraph or table reporters). This means that instead of seeing this in the flamegraphs:
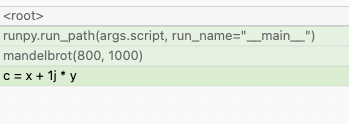
You will now be able to see what's happening inside the Python calls:

Reporters display native frames in a different color than Python frames. They can also be distinguished by looking at the file location in a frame (Python frames will generally be generated from files with a .py extension while native frames will be generated from files with extensions like .c, .cpp or .h).
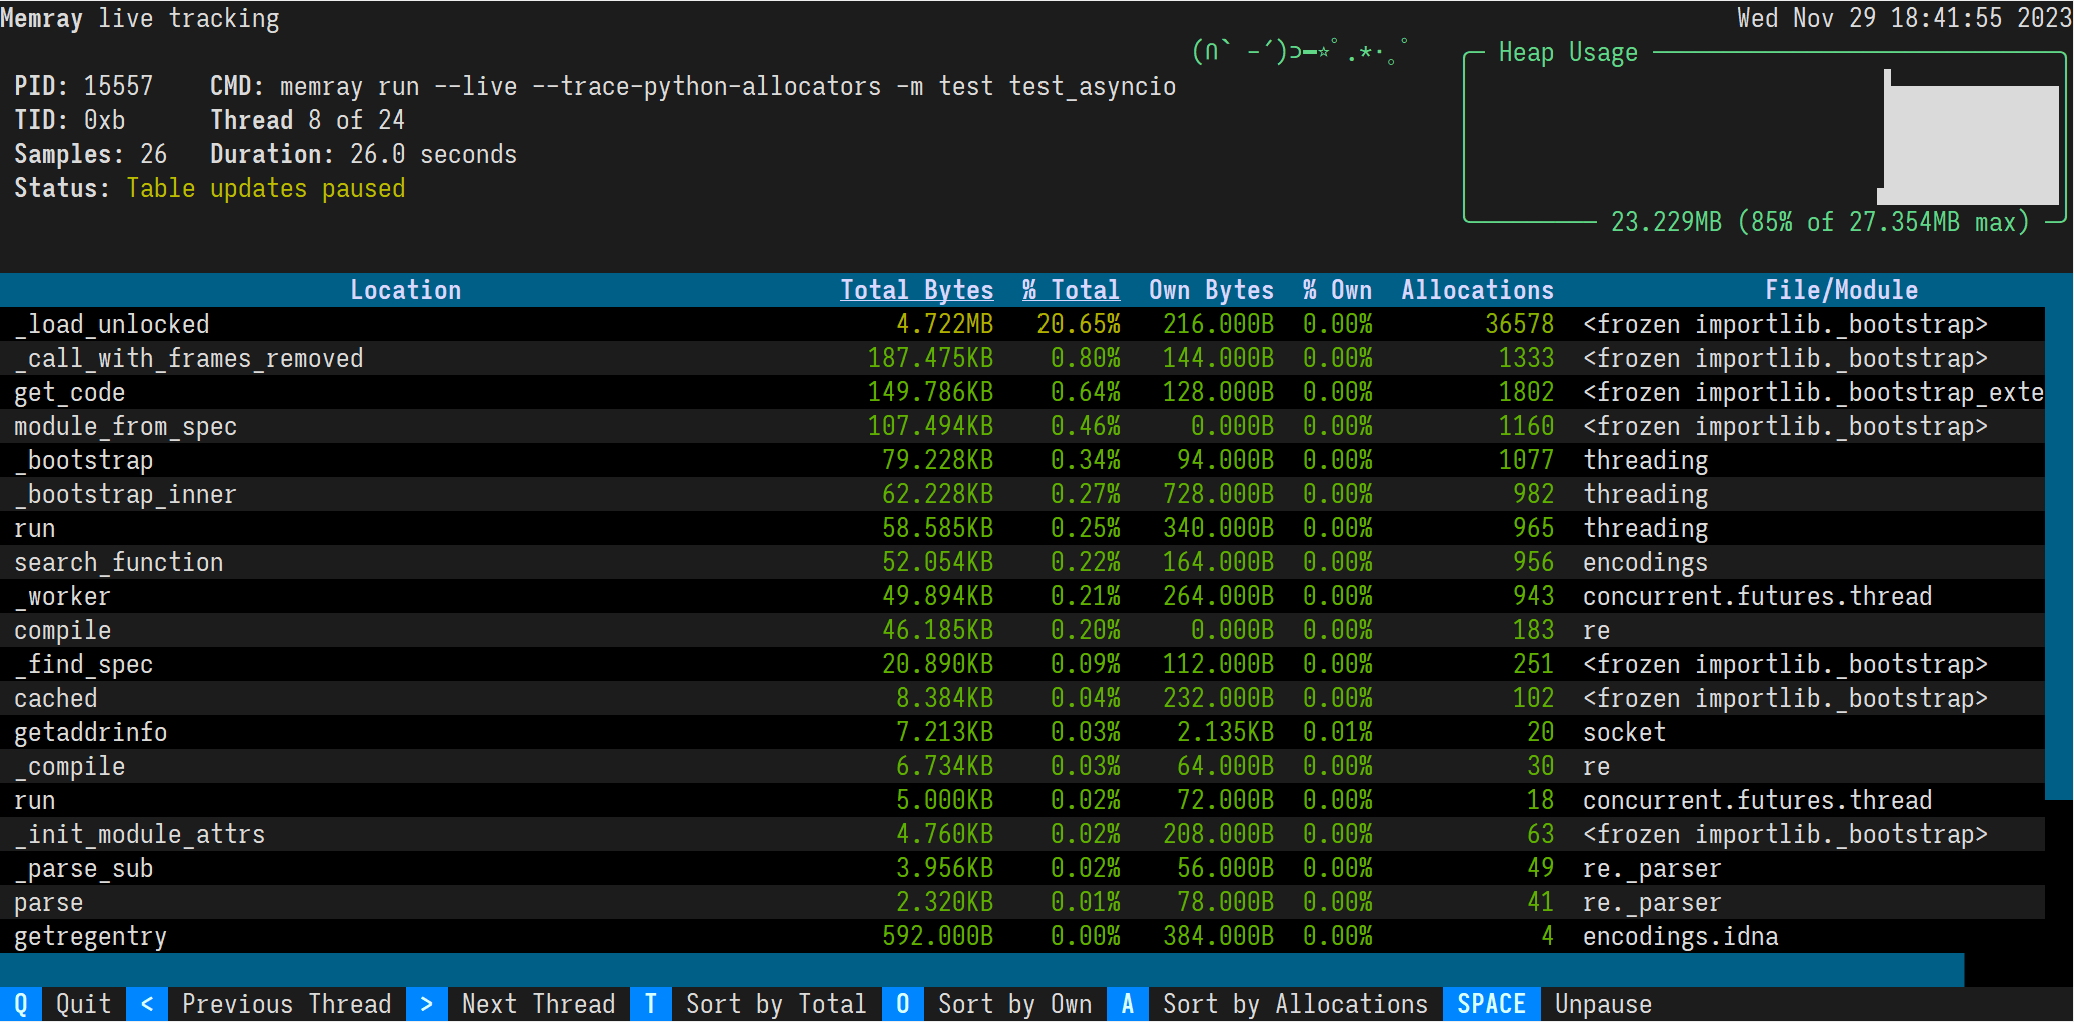
Memray's live mode runs a script or a module in a terminal-based interface that allows you to interactively inspect its memory usage while it runs. This is useful for debugging scripts or modules that take a long time to run or that exhibit multiple complex memory patterns. You can use the --live option to run the script or module in live mode:
memray run --live my_script.pyor if you want to execute a module:
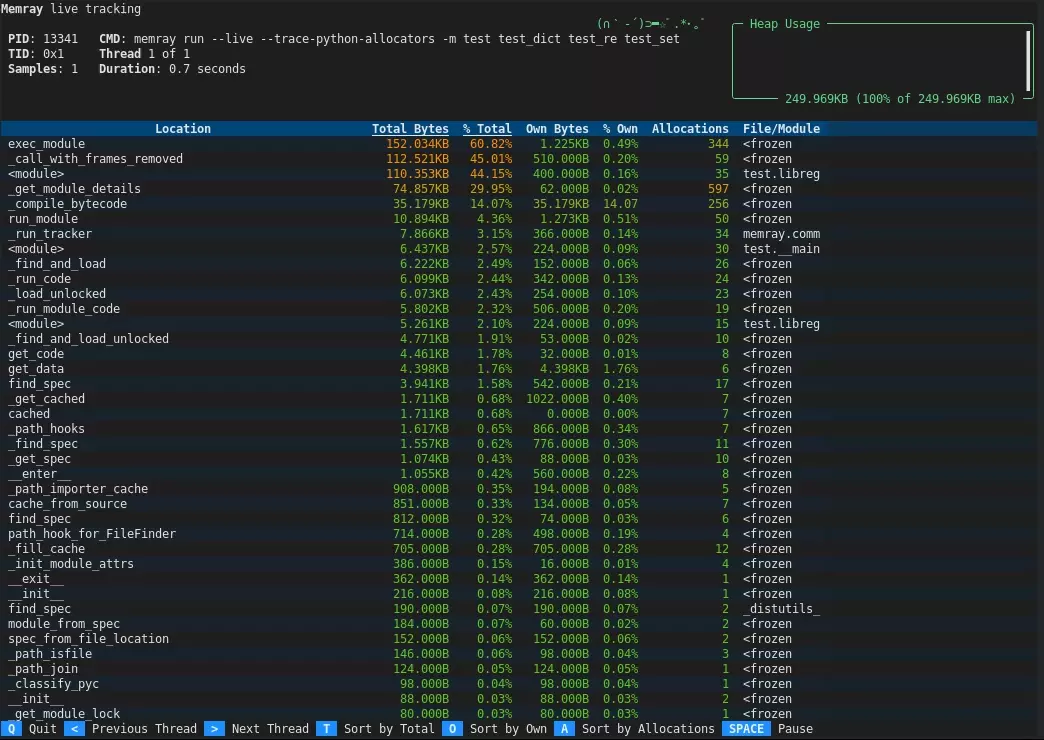
memray run --live -m my_moduleThis will show the following TUI interface in your terminal:
The results are displayed in descending order of total memory allocated by a function and the subfunctions called by it. You can change the ordering with the following keyboard shortcuts:
-
t (default): Sort by total memory
-
o: Sort by own memory
-
a: Sort by allocation count
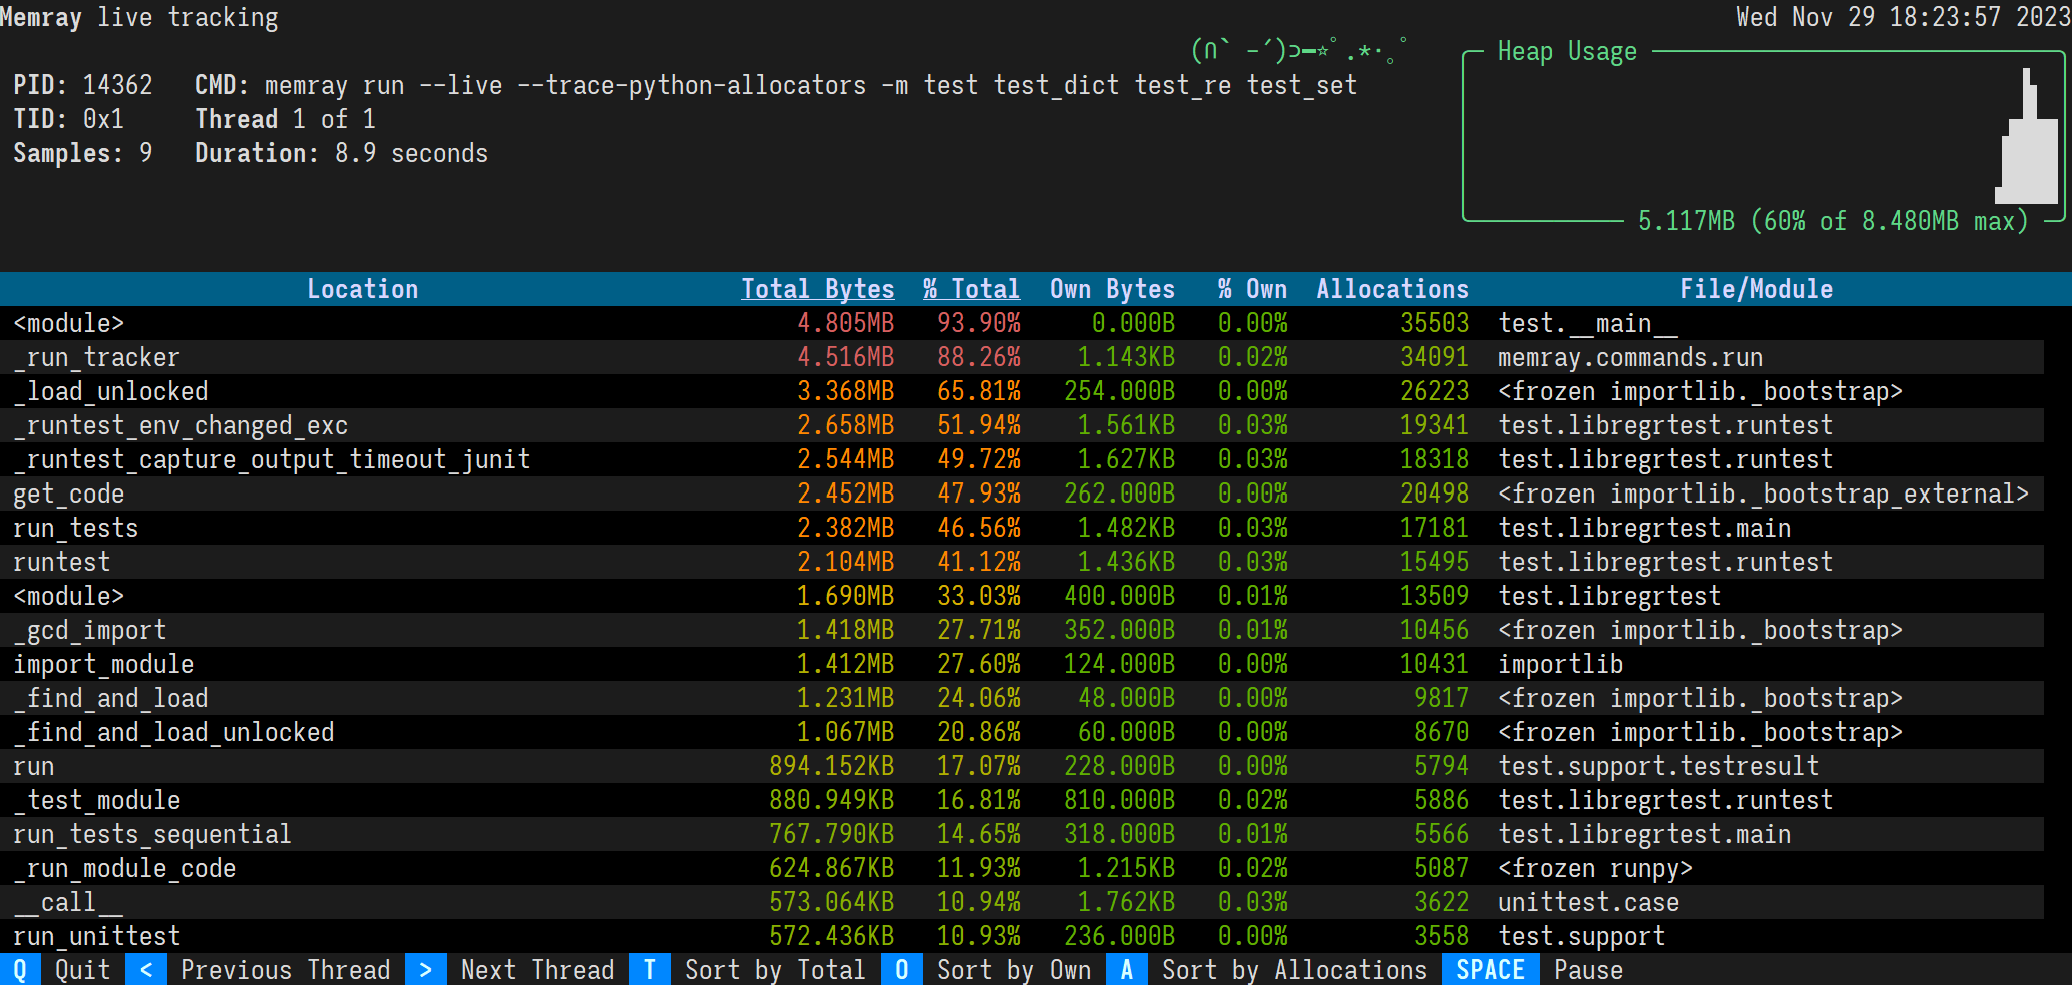
In most terminals you can also click the "Sort by Total", "Sort by Own", and "Sort by Allocations" buttons on the footer.
The sorted column's heading is underlined.
By default, the live command will present the main thread of the program. You can look at different threads of the program by pressing the greater than and less than keys, < and >. In most terminals you can also click the "Previous Thread" and "Next Thread" buttons on the footer.
In addition to tracking Python processes from a CLI using memray run, it is also possible to programmatically enable tracking within a running Python program.
import memray

with memray.Tracker("output_file.bin"):
    print("Allocations will be tracked until the with block ends")
For details, see the API documentation.
Memray is Apache-2.0 licensed, as found in the LICENSE file.
This project has adopted a Code of Conduct. If you have any concerns about the Code, or behavior that you have experienced in the project, please contact us at [email protected].
If you believe you have identified a security vulnerability in this project, please send an email to the project team at [email protected], detailing the suspected issue and any methods you've found to reproduce it.
Please do NOT open an issue in the GitHub repository, as we'd prefer to keep vulnerability reports private until we've had an opportunity to review and address them.
We welcome your contributions to help us improve and extend this project!
Below you will find some basic steps required to be able to contribute to the project. If you have any questions about this process or any other aspect of contributing to a Bloomberg open source project, feel free to send an email to [email protected] and we'll get your questions answered as quickly as we can.
Since this project is distributed under the terms of an open source license, contributions that you make are licensed under the same terms. In order for us to be able to accept your contributions, we will need explicit confirmation from you that you are able and willing to provide them under these terms, and the mechanism we use to do this is called a Developer's Certificate of Origin (DCO). This is very similar to the process used by the Linux kernel, Samba, and many other major open source projects.
To participate under these terms, all that you must do is include a line like the following as the last line of the commit message for each commit in your contribution:
Signed-Off-By: Random J. Developer <[email protected]>
The simplest way to accomplish this is to add -s or --signoff to your git commit command.
You must use your real name (sorry, no pseudonyms, and no anonymous contributions).
- Create an Issue, select 'Feature Request', and explain the proposed change.
- Follow the guidelines in the issue template presented to you.
- Submit the Issue.
- Submit a Pull Request and link it to the Issue by including "#" in the Pull Request summary.


![dependabot[bot] avatar](https://avatars.githubusercontent.com/in/29110?v=4 "dependabot[bot]")