From an origin to a destination:
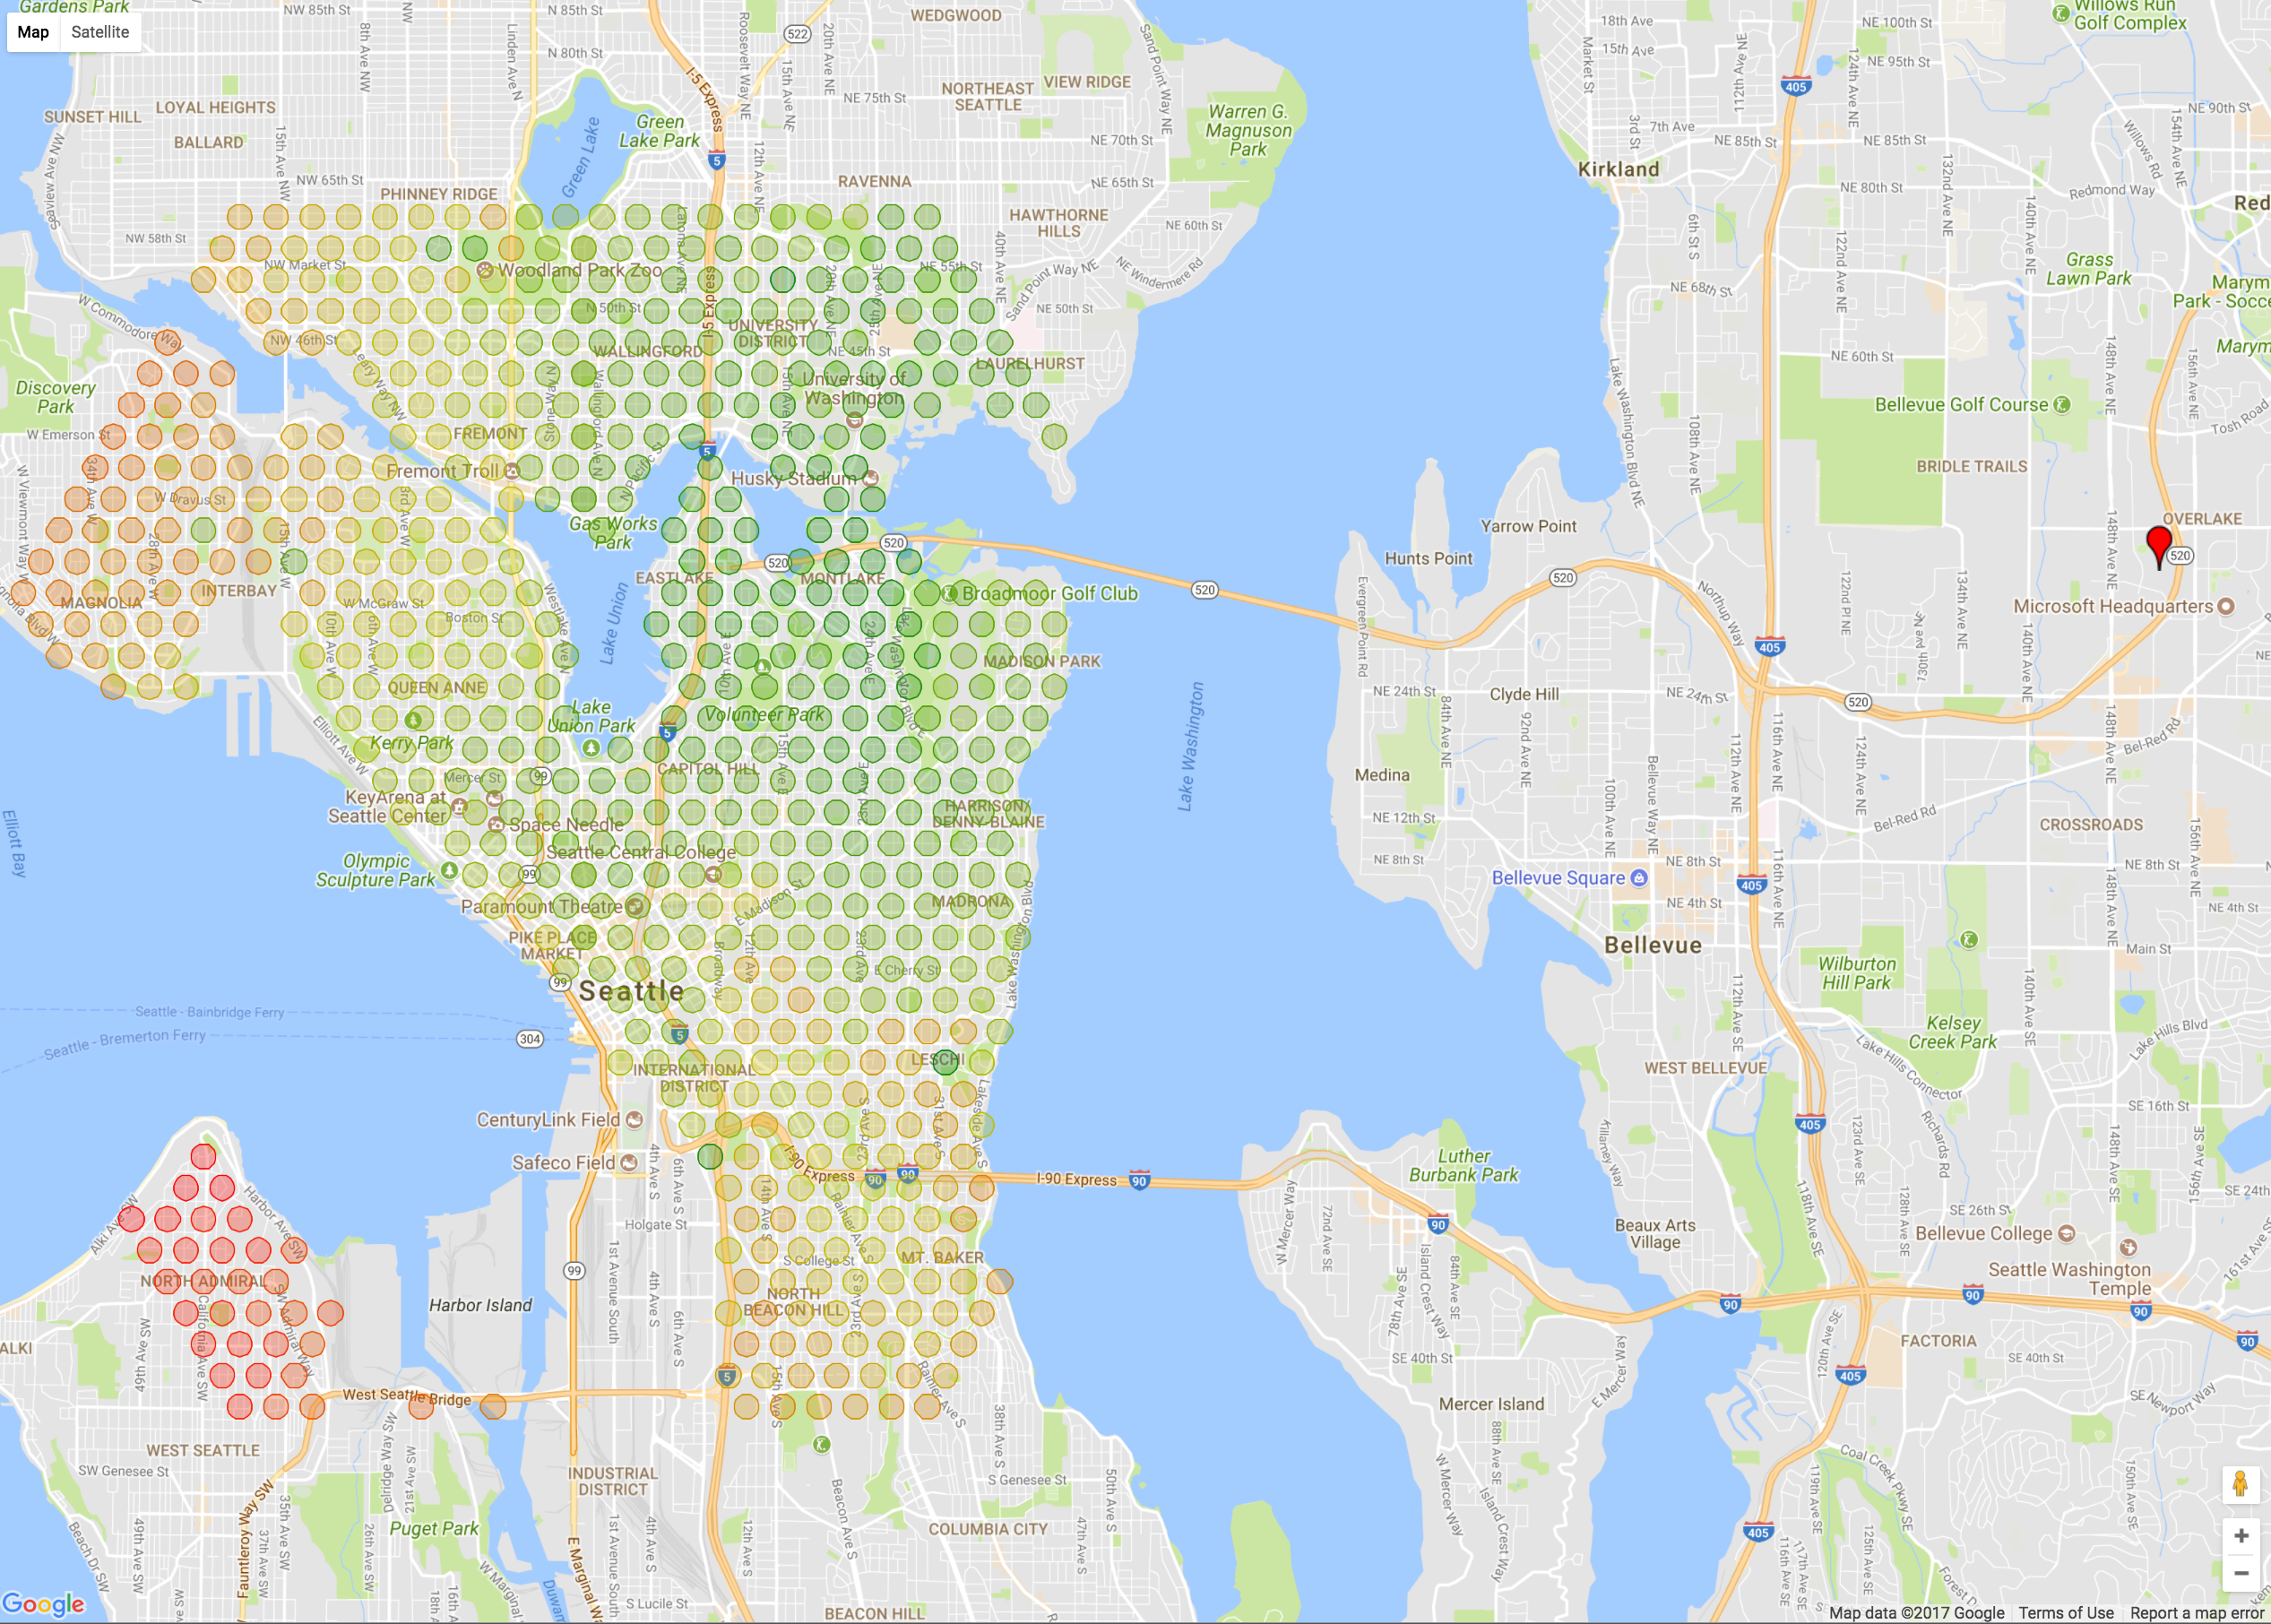 Fares surrounding a certain location:

- Python 2.7
pip(comes with Python 2.7.9 and later)virtualenv- Helps with managing python dependencies
> pip install virtualenv- Google developer account and an Google Maps API key
- Visit https://developers.google.com/console and log in with a Google Account
- Select one of your existing projects, or create a new project.
- Enable the API(s) you want to use.
The python client lib for Google maps that we use supports
- Geocoding API (currently used)
- Elevation API (currently used)
- Directions API
- Distance Matrix API
- Geolocation API
- Places API
- Roads API
- Time Zone API
- Create an API key and copy it into a local file called
APIKEYS.txt. This file is in.gitignorebut make sure you never share this file.
- Create a new
virtualenv. The below command will create a folderenvthat contains everythingvirtualenvneeds to manage your dependencies.
> virtualenv env- Activate the virtualenv.
Note the different commands for windows and linux.
Also if you didn't name your folder
envas shown above you'll need to replaceenvbelow with your chosen folder name.
# on Windows
> env/Scripts/activate
# on unix
> source env/bin/activate- Restore python package dependencies:
> pip install -r requirements.txt- The app is currently hard coded with values, but you can run it with:
> python main.py
Get data --> visualize data
Microsoft office locations:
- Redmond
- Bellevue
- Seattle
From each office, we want to visualize how Uber's fares change within a certain radius. Perhaps we'll see price spikes at points of interest (POIs)... Perhaps we'll see a nice gradient... It'd also be interesting to see how the fares change over time, if they change at all.
That said, here's the flow of information: Coordinate points of addresses -> Get fare estimate from origin to address -> visualize fares on a map. Here's our data sources:
- Addresses - From list of coordinates, remove those that don't correspond to a valid address.
- From origin to every lat lng pair, call Uber API to get a fare estimate.
Plot [lat, lng, fare] on a map.
Pretty straightforward!

