Giter Site home page Giter Site logo

braindynamicslab / dyneusr Goto Github PK

View Code? Open in Web Editor NEW
44.0 8.0 15.0 24.87 MB

Dynamical Neuroimaging Spatiotemporal Representations (DyNeuSR)

Home Page: https://braindynamicslab.github.io/dyneusr

License: BSD 3-Clause Clear License

Python 49.74% HTML 48.53% Singularity 1.73%
brain-dynamics topological-data-analysis neuroimaging brain-networks mapper-algorithm visualization

dyneusr's Introduction

Dynamical Neuroimaging Spatiotemporal Representations

https://www.singularity-hub.org/static/img/hosted-singularity--hub-%23e32929.svg

DyNeuSR is a Python visualization library for topological representations of neuroimaging data.

DyNeuSR was designed specifically for working with shape graphs produced by the Mapper algorithm from topological data analysis (TDA), as described in the papers "Generating dynamical neuroimaging spatiotemporal representations (DyNeuSR) using topological data analysis" (Geniesse et al., 2019) and "Towards a new approach to reveal dynamical organization of the brain using topological data analysis" (Saggar et al., 2018). Check out this blog post for more about the initial work that inspired the development of DyNeuSR.

Developed with neuroimaging data analysis in mind, DyNeuSR connects existing implementations of Mapper (e.g. KeplerMapper) with network analysis tools (e.g. NetworkX) and other neuroimaging data visualization libraries (e.g. Nilearn) and provides a high-level interface for interacting with and manipulating shape graph representations of neuroimaging data and relating these representations back to neurophysiology.

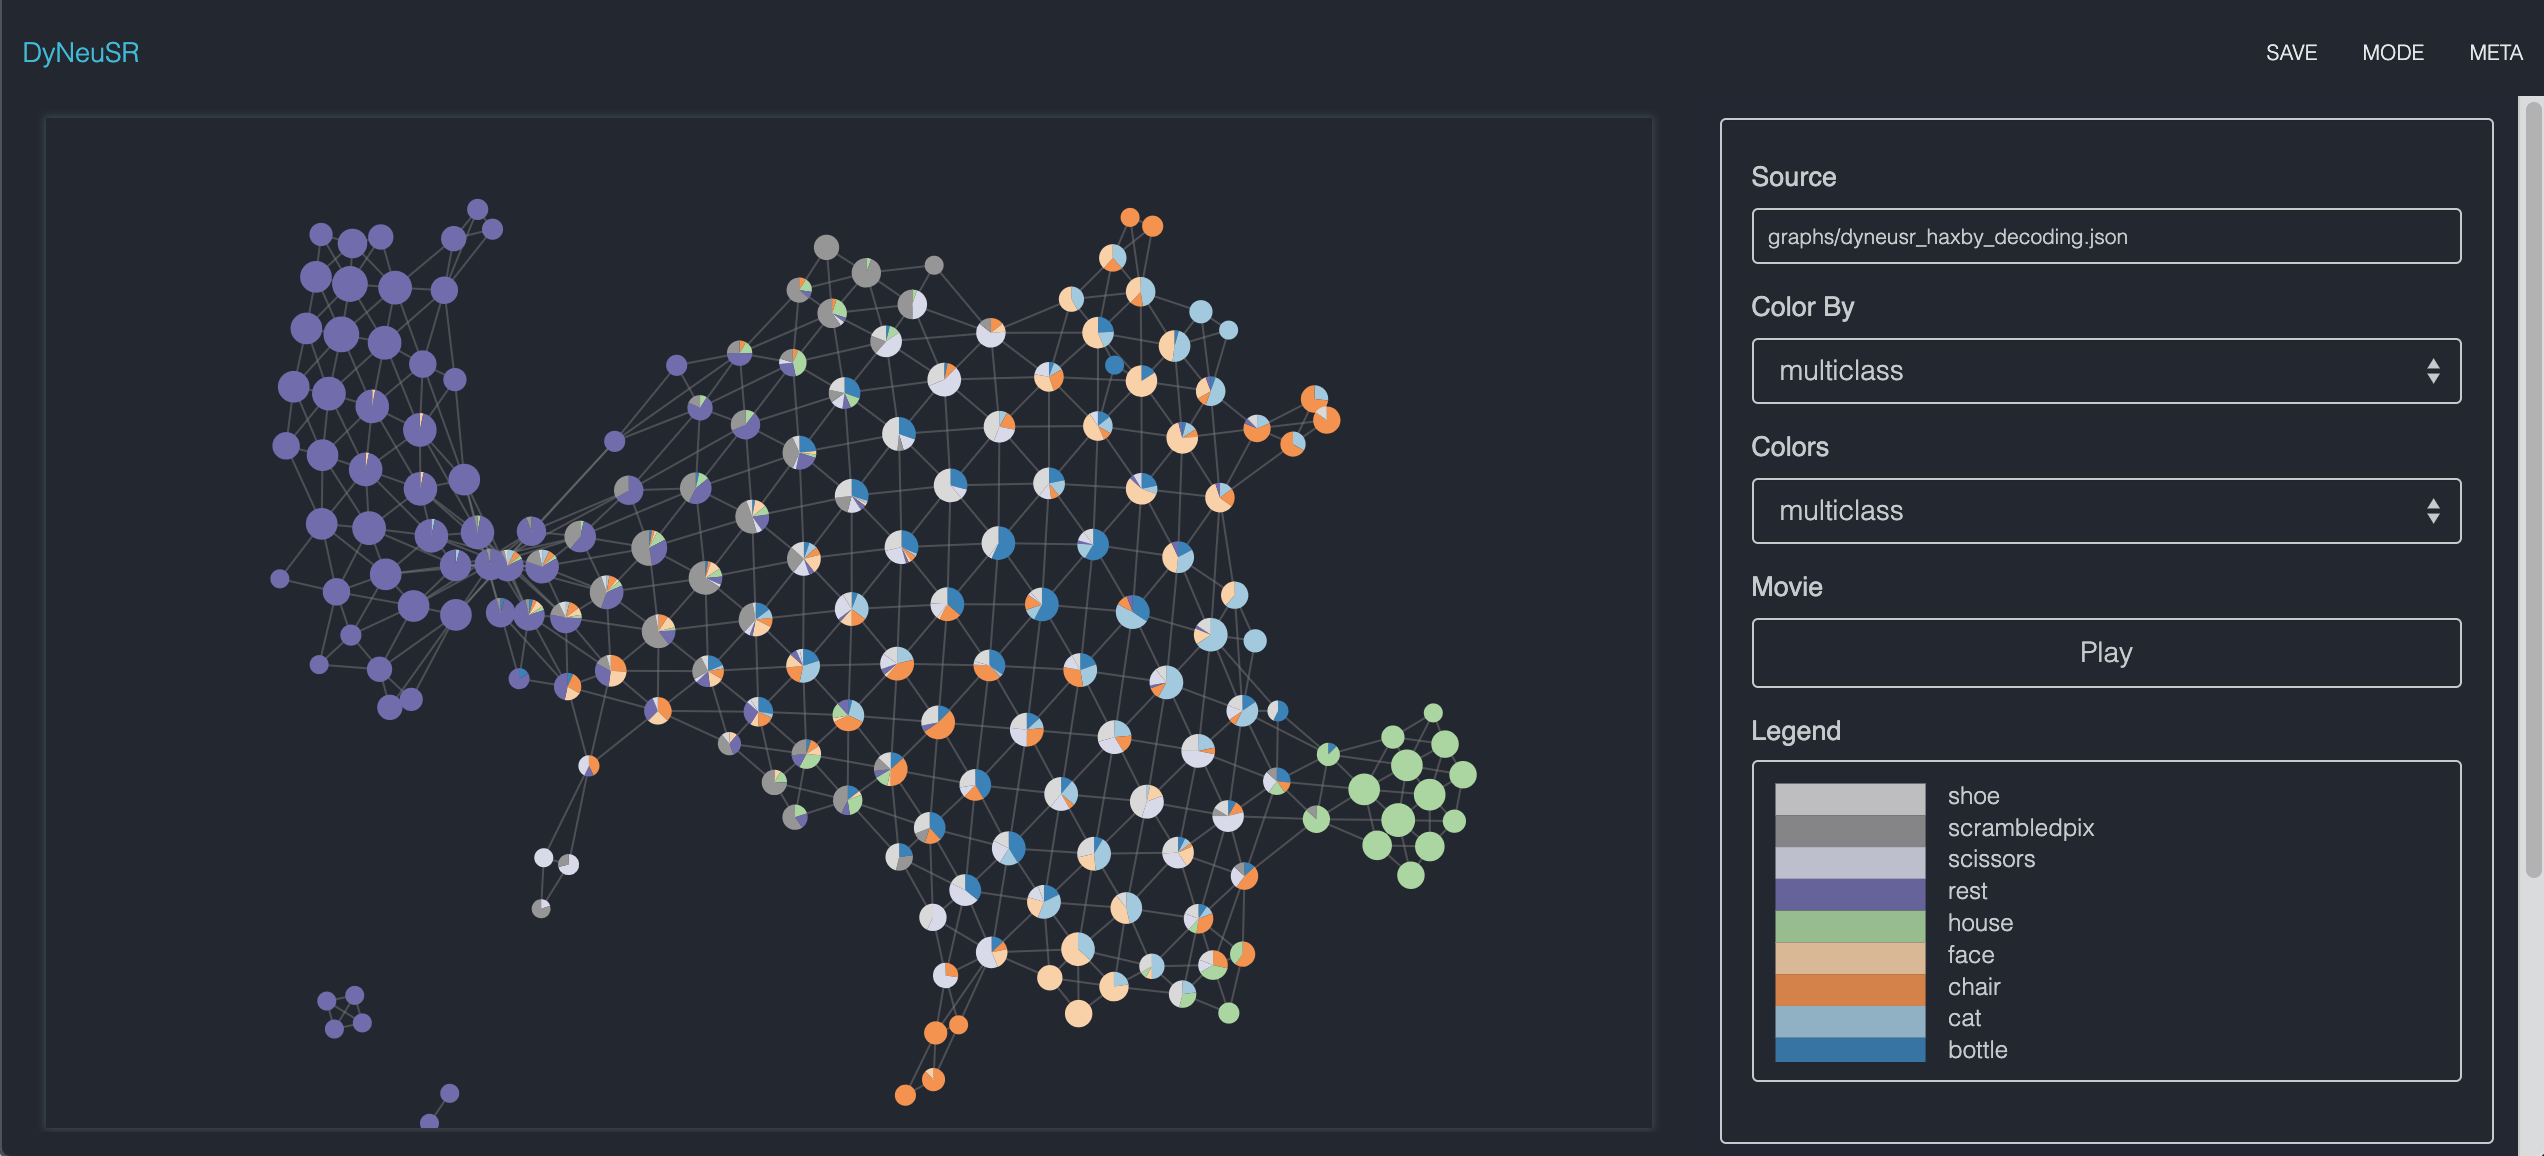
DyNeuSR also provides an interactive web interface for visualizing and exploring shape graphs. To see this visual interface in action, check out the demos.

Demos

Related Projects

  • DyNeuSR Fire is a new project that provides a command line interface for DyNeuSR. It wraps kmapper and dyneusr into a single pipeline, and uses the Python Fire library to automatically generate a simple command line interface that accepts several important options and allows users to customize this pipeline. For more information about DyNeuSR Fire, check out the docs.

References

If you find DyNeuSR useful, please consider citing:

Geniesse, C., Sporns, O., Petri, G., & Saggar, M. (2019). Generating dynamical neuroimaging spatiotemporal representations (DyNeuSR) using topological data analysis. Network Neuroscience. Advance publication. doi:10.1162/netn_a_00093

For more information about the Mapper approach, please see:

Saggar, M., Sporns, O., Gonzalez-Castillo, J., Bandettini, P.A., Carlsson, G., Glover, G., & Reiss, A.L. (2018). Towards a new approach to reveal dynamical organization of the brain using topological data analysis. Nature Communications, 9(1). doi:10.1038/s41467-018-03664-4

API Usage & Examples

DyNeuSR provides a Python API for working with and visualizing shape graphs generated by Mapper. This repository includes several examples that introduce DyNeuSR's API and highlight different aspects of analysis with DyNeuSR. For more detailed tutorials, check out dyneusr-notebooks.

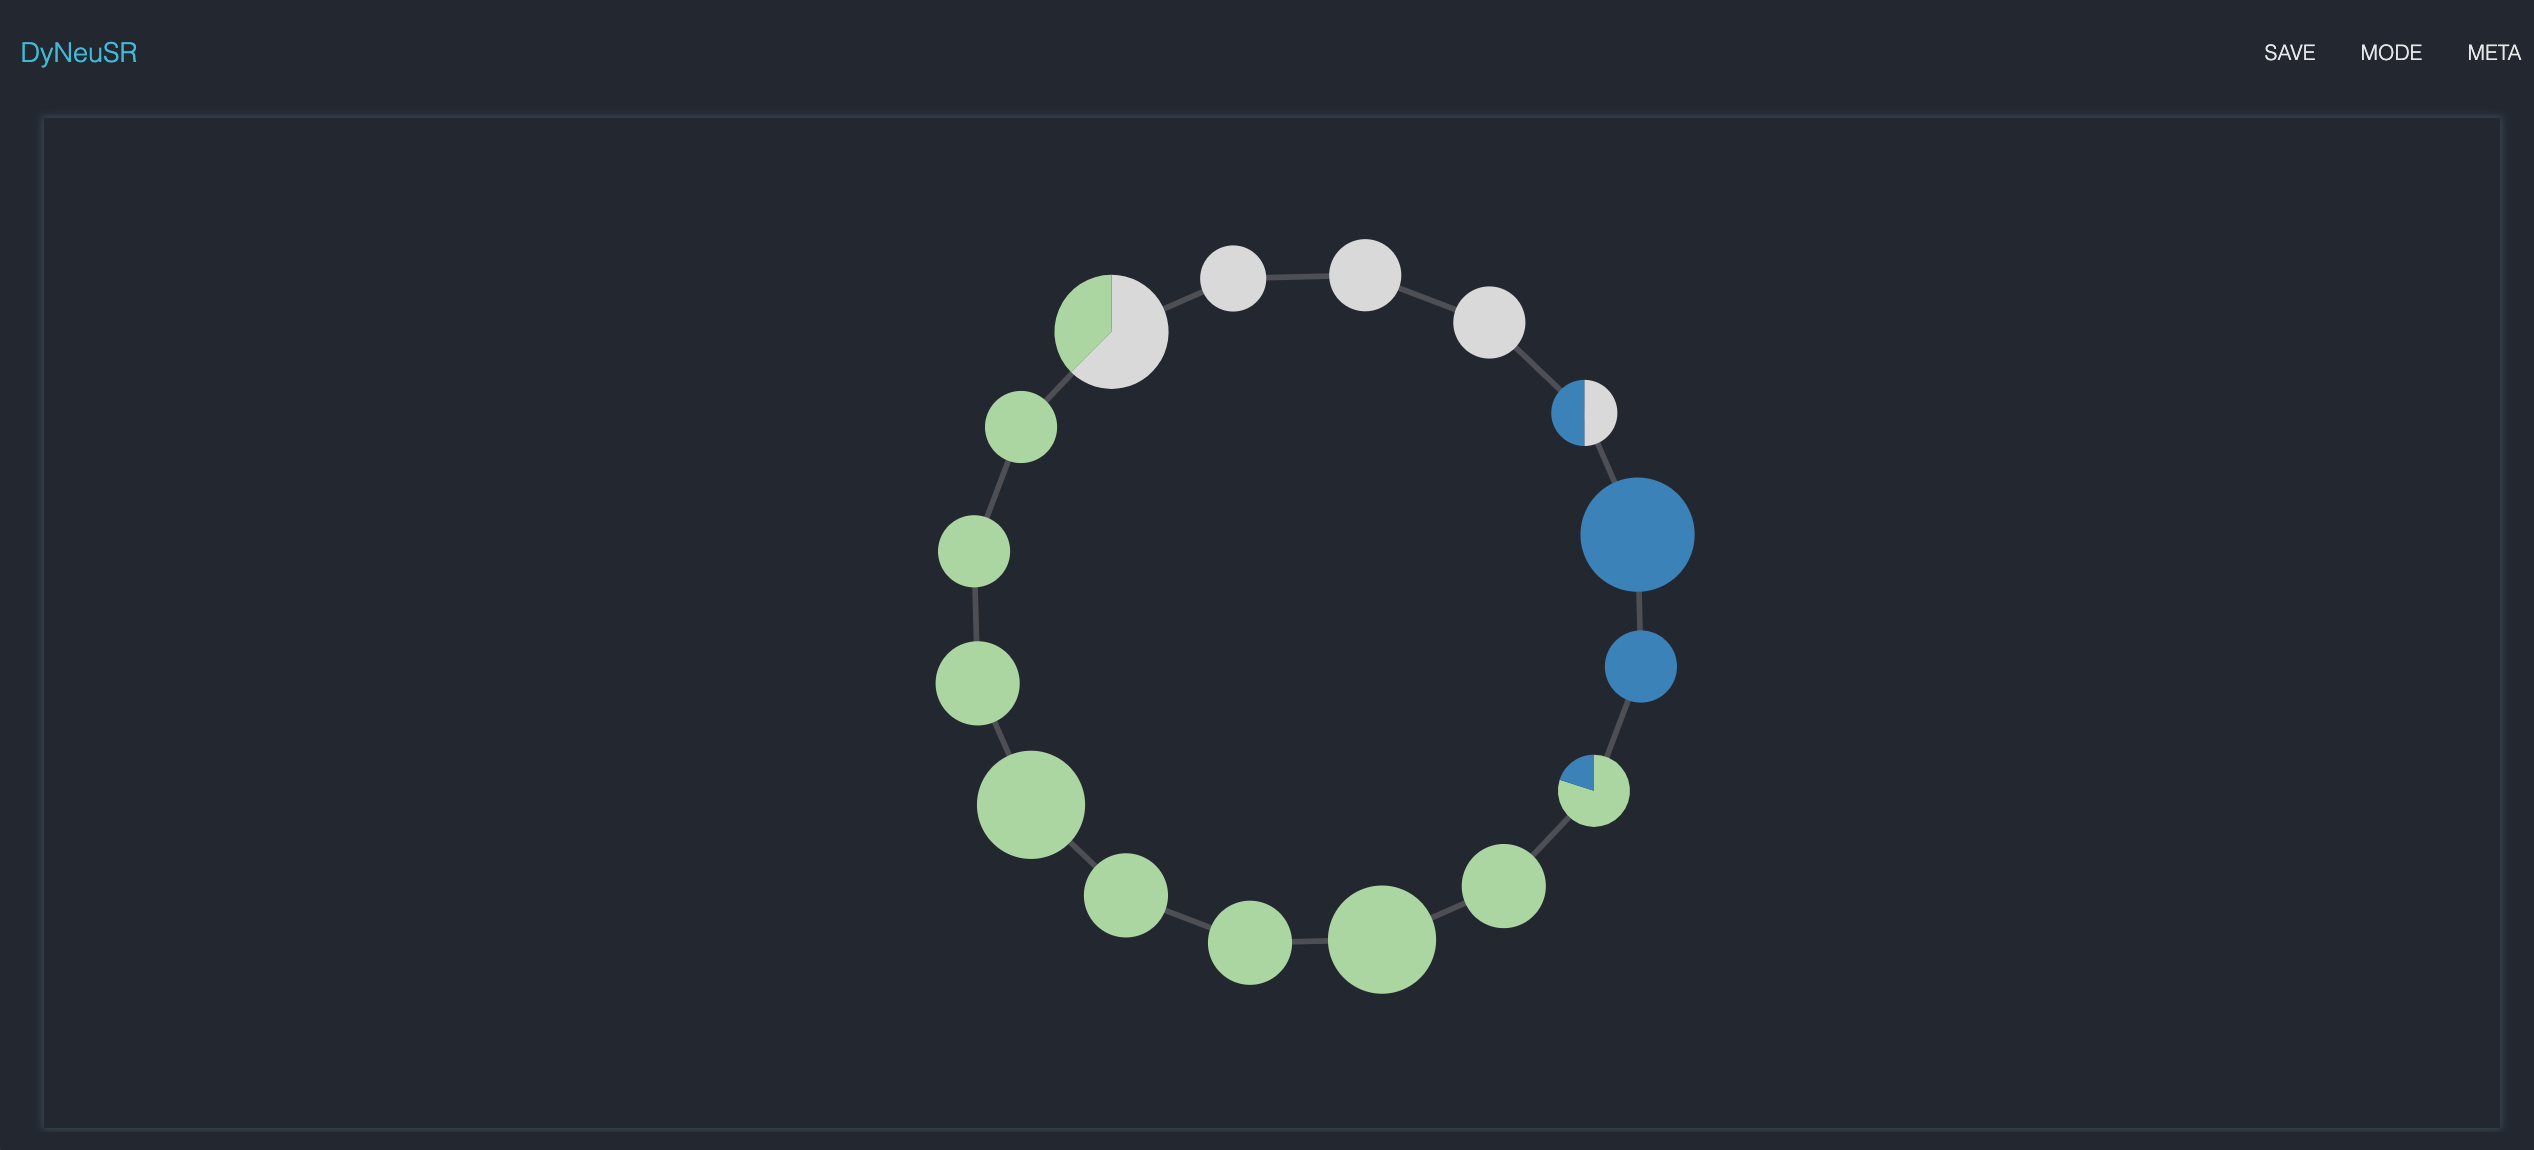
Shape Graph Visualization (trefoil knot)

from dyneusr import DyNeuGraph
from dyneusr.datasets import make_trefoil
from dyneusr.tools import visualize_mapper_stages
from kmapper import KeplerMapper

# Generate synthetic dataset
dataset = make_trefoil(size=100)
X = dataset.data
y = dataset.target

# Generate shape graph using KeplerMapper
mapper = KeplerMapper(verbose=1)
lens = mapper.fit_transform(X, projection=[0])
graph = mapper.map(lens, X, nr_cubes=6, overlap_perc=0.2)

# Visualize the shape graph using DyNeuSR's DyNeuGraph                          
dG = DyNeuGraph(G=graph, y=y)
dG.visualize('dyneusr_output.html')

Mapper Parameter Comparison (trefoil knot)

# Define projections to compare
projections = ([0], [0,1], [1,2], [0, 2])

# Compare different sets of columns as lenses
for projection in projections:

	# Generate shape graph using KeplerMapper
	mapper = KeplerMapper(verbose=1)
	lens = mapper.fit_transform(X, projection=projection)
	graph = mapper.map(lens, X, nr_cubes=4, overlap_perc=0.3)

	# Visualize the stages of Mapper
	fig, axes = visualize_mapper_stages(
		dataset, lens=lens, graph=graph, cover=mapper.cover, 
		layout="spectral")
		

Neuroimaging Applications (haxby decoding)

import numpy as np 
import pandas as pd

from nilearn.datasets import fetch_haxby
from nilearn.input_data import NiftiMasker

from kmapper import KeplerMapper, Cover
from sklearn.manifold import TSNE
from sklearn.cluster import DBSCAN

# Fetch dataset, extract time-series from ventral temporal (VT) mask
dataset = fetch_haxby()
masker = NiftiMasker(
    dataset.mask_vt[0], 
    standardize=True, detrend=True, smoothing_fwhm=4.0,
    low_pass=0.09, high_pass=0.008, t_r=2.5,
    memory="nilearn_cache")
X = masker.fit_transform(dataset.func[0])

# Encode labels as integers
df = pd.read_csv(dataset.session_target[0], sep=" ")
target, labels = pd.factorize(df.labels.values)
y = pd.DataFrame({l:(target==i).astype(int) for i,l in enumerate(labels)})

# Generate shape graph using KeplerMapper
mapper = KeplerMapper(verbose=1)
lens = mapper.fit_transform(X, projection=TSNE(2))
graph = mapper.map(lens, X, cover=Cover(20, 0.5), clusterer=DBSCAN(eps=20.))

# Visualize the shape graph using DyNeuSR's DyNeuGraph                          
dG = DyNeuGraph(G=graph, y=y)
dG.visualize('dyneusr_output.html')

Setup

Dependencies

Required Python Packages

For a full list of packages and required versions, see requirements.txt and requirements-versions.txt.

Install with PIP

To install with pip:

pip install dyneusr

To install from source:

git clone https://github.com/braindynamicslab/dyneusr.git
cd dyneusr

pip install -r requirements.txt
pip install -e .

pytest

Install with Conda

If your default environment is Python 2, we recommend that you install dyneusr in a separate Python 3 environment. You can find more information about creating a separate environment for Python 3 here.

If you don't have conda, or if you are new to scientific python, we recommend that you download the Anaconda scientific python distribution.

To create a new conda environment and install from source:

conda create -n dyneusr python=3.6
conda activate dyneusr

git clone https://github.com/braindynamicslab/dyneusr.git
cd dyneusr

conda install --file requirements-conda.txt
pip install -e .

pytest

This creates a new conda environment dyneusr and installs in it the dependencies that are needed. To access it, use the conda activate dyneusr command (if your conda version >= 4.4) and use source activate dyneusr command (if your conda version < 4.4).

Run in a Singularity Container

To run dyneusr in a Singularity container, for use on clusters where you do not have root access for example, first install singularity. Then, you can use the following command:

singularity run shub://braindynamicslab/dyneusr
source activate neuro

This will download and run a singularity container from singularity-hub running centos 7 with dyneusr, jupyter, and all dependencies. It will also activate the conda environement neuro where these are installed. For more information on how to use singularity, see the documentation. The singularity recipe for this file was built with neurodocker

Support

Please feel free to report any issues, request new features, or propose improvements. You can also contact Caleb Geniesse at geniesse [at] stanford [dot] edu.

If you contribute to DyNeuSR, please feel free to add your name to the list of contributors.

Citation

Geniesse, C., Sporns, O., Petri, G., & Saggar, M. (2019). Generating dynamical neuroimaging spatiotemporal representations (DyNeuSR) using topological data analysis. Network Neuroscience. Advance publication. doi:10.1162/netn_a_00093

dyneusr's People

Contributors

calebgeniesse avatar dependabot[bot] avatar dhasegan avatar jodahoney avatar jsmentch avatar kristiandroste avatar rdoublea avatar

Stargazers

 avatar  avatar  avatar  avatar  avatar  avatar  avatar  avatar  avatar  avatar  avatar  avatar  avatar  avatar  avatar  avatar  avatar  avatar  avatar  avatar  avatar  avatar  avatar  avatar  avatar  avatar  avatar  avatar  avatar  avatar  avatar  avatar  avatar  avatar  avatar  avatar  avatar  avatar  avatar  avatar  avatar  avatar  avatar  avatar

Watchers

 avatar  avatar  avatar  avatar  avatar  avatar  avatar  avatar

dyneusr's Issues

Problem importing dyneusr; matplotlib TkAgg backend

I've been trying to install dyneusr on a singularity image and cannot import it in python. I seem to be having an issue with matplotlib backend TkAgg. I installed using pip after installing the dependencies and this is on debian stretch. Have you come across this problem or know a possible solution? Thanks!

I have tried restarting the kernel and importing before anything else. I've also tried downgrading to matplotlib 3.0.3. These were the only solutions I could find online.

Here is the error I receive after trying to import dyneusr:

Traceback (most recent call last):
  File "<stdin>", line 1, in <module>
  File "/opt/miniconda-latest/envs/neuro/lib/python3.7/site-packages/dyneusr/__init__.py", line 18, in <module>
    from . import tools
  File "/opt/miniconda-latest/envs/neuro/lib/python3.7/site-packages/dyneusr/tools/__init__.py", line 8, in <module>
    from . import mixture
  File "/opt/miniconda-latest/envs/neuro/lib/python3.7/site-packages/dyneusr/tools/mixture.py", line 23, in <module>
    mpl.use('TkAgg', warn=False)
  File "/opt/miniconda-latest/envs/neuro/lib/python3.7/site-packages/matplotlib/__init__.py", line 1391, in use
    switch_backend(name)
  File "/opt/miniconda-latest/envs/neuro/lib/python3.7/site-packages/matplotlib/pyplot.py", line 222, in switch_backend
    newbackend, required_framework, current_framework))
ImportError: Cannot load backend 'TkAgg' which requires the 'tk' interactive framework, as 'headless' is currently running

docker app

Create docker app to make it easier to install/run dyneusr (e.g. on clusters)

TODO:

  • setup docker script (see this how-to)
  • add integration test
  • update documentation

deprecated import from sklearn

In trefoil.py and wrappers.py, one tries to import Bunch from sklearn.datasets.base, which has been moved to sklearn.utils.

Saving a shape graph in the HTML file as SVG automatically

Could anyone tell me how to save the shape graph annotated by my custom configuration/layout as SVG from the HTML file generated by DyNeuSR, without manually clicking any HTML links (SAVE/MODE/META)?

I'm currently investigating effects of the hyperparameters (e.g., R, G and parameters for dbscan) on the shape graphs, and that's why I have to generate a lot of graph images with different parameter settings automatically in my Python code.

Kepler Mapper returns an empty graph

See PR 24 for reports relating to an issue with kmapper. Several different reported errors were found to be due to an empty graph being returned by kmapper. These errors were only observed in 02_haxby_fmri.ipynb, a notebook in DyNeuSR Notebooks repository. See below for more notes taken from PR 24, which has since been merged for other reasons.

DyNeuGraph error due to networkx changes

Hello,

I am implementing some example code from your website. It seems that it is throwing an error, because the networkx package was updated to use to_numpy_array() instead of to_numpy_matrix(). However, simply making this syntax change in the relevant dyneusr utility script does not fix the problem, as the error chain continues. I am going to try to use an older version of networkx for now, but I wanted to let you know about this in case you are able to update the source code with a fix. Thanks!

Example code with error message:

from dyneusr import DyNeuGraph
from dyneusr.datasets import make_trefoil
from dyneusr.tools import visualize_mapper_stages

import numpy as np 
import pandas as pd

from nilearn.datasets import fetch_haxby
from nilearn.input_data import NiftiMasker

from kmapper import KeplerMapper, Cover
from sklearn.manifold import TSNE
from sklearn.cluster import DBSCAN

# Fetch dataset, extract time-series from ventral temporal (VT) mask
dataset = fetch_haxby()
masker = NiftiMasker(
    dataset.mask_vt[0], 
    standardize=True, detrend=True, smoothing_fwhm=4.0,
    low_pass=0.09, high_pass=0.008, t_r=2.5,
    memory="nilearn_cache")
X = masker.fit_transform(dataset.func[0])

# Encode labels as integers
df = pd.read_csv(dataset.session_target[0], sep=" ")
target, labels = pd.factorize(df.labels.values)
y = pd.DataFrame({l:(target==i).astype(int) for i,l in enumerate(labels)})

# Generate shape graph using KeplerMapper
mapper = KeplerMapper(verbose=1)
lens = mapper.fit_transform(X, projection=TSNE(2))
graph = mapper.map(lens, X, cover=Cover(20, 0.5), clusterer=DBSCAN(eps=20.))

# Visualize the shape graph using DyNeuSR's DyNeuGraph                          
dG = DyNeuGraph(G=graph, y=y)
dG.visualize('dyneusr_output.html')

---------------------------------------------------------------------------
AttributeError                            Traceback (most recent call last)
Untitled-1.ipynb Cell 1 line 3
     [32](vscode-notebook-cell:Untitled-1.ipynb?jupyter-notebook#W0sdW50aXRsZWQ%3D?line=31) graph = mapper.map(lens, X, cover=Cover(20, 0.5), clusterer=DBSCAN(eps=20.))
     [34](vscode-notebook-cell:Untitled-1.ipynb?jupyter-notebook#W0sdW50aXRsZWQ%3D?line=33) # Visualize the shape graph using DyNeuSR's DyNeuGraph                          
---> [35](vscode-notebook-cell:Untitled-1.ipynb?jupyter-notebook#W0sdW50aXRsZWQ%3D?line=34) dG = DyNeuGraph(G=graph, y=y)
     [36](vscode-notebook-cell:Untitled-1.ipynb?jupyter-notebook#W0sdW50aXRsZWQ%3D?line=35) dG.visualize('dyneusr_output.html')

File [c:\Users\Ernest\miniconda3\envs\pyif\Lib\site-packages\dyneusr\core.py:50](file:///C:/Users/Ernest/miniconda3/envs/pyif/Lib/site-packages/dyneusr/core.py:50), in DyNeuGraph.__init__(self, **params)
     [28](file:///C:/Users/Ernest/miniconda3/envs/pyif/Lib/site-packages/dyneusr/core.py:28) """ DyNeuGraph
     [29](file:///C:/Users/Ernest/miniconda3/envs/pyif/Lib/site-packages/dyneusr/core.py:29) 
     [30](file:///C:/Users/Ernest/miniconda3/envs/pyif/Lib/site-packages/dyneusr/core.py:30) Parameters
   (...)
     [47](file:///C:/Users/Ernest/miniconda3/envs/pyif/Lib/site-packages/dyneusr/core.py:47)     dyneuG.visualize()
     [48](file:///C:/Users/Ernest/miniconda3/envs/pyif/Lib/site-packages/dyneusr/core.py:48) """
     [49](file:///C:/Users/Ernest/miniconda3/envs/pyif/Lib/site-packages/dyneusr/core.py:49) self.cache_ = dict(params)
---> [50](file:///C:/Users/Ernest/miniconda3/envs/pyif/Lib/site-packages/dyneusr/core.py:50) self.fit(**params)

File [c:\Users\Ernest\miniconda3\envs\pyif\Lib\site-packages\dyneusr\core.py:106](file:///C:/Users/Ernest/miniconda3/envs/pyif/Lib/site-packages/dyneusr/core.py:106), in DyNeuGraph.fit(self, G, X, y, node_data, edge_data, G_data, **kwargs)
    [104](file:///C:/Users/Ernest/miniconda3/envs/pyif/Lib/site-packages/dyneusr/core.py:104) # process graph
    [105](file:///C:/Users/Ernest/miniconda3/envs/pyif/Lib/site-packages/dyneusr/core.py:105) G = tools.process_graph(G, meta=y, **kwargs)
--> [106](file:///C:/Users/Ernest/miniconda3/envs/pyif/Lib/site-packages/dyneusr/core.py:106) A, M, TCM = tools.extract_matrices(G, index=data_ids)
    [108](file:///C:/Users/Ernest/miniconda3/envs/pyif/Lib/site-packages/dyneusr/core.py:108) # create graph from TCM
    [109](file:///C:/Users/Ernest/miniconda3/envs/pyif/Lib/site-packages/dyneusr/core.py:109) if G_data is True:
...
--> [420](file:///C:/Users/Ernest/miniconda3/envs/pyif/Lib/site-packages/dyneusr/tools/graph_utils.py:420) A = nx.to_numpy_matrix(G).A  # node x node
    [421](file:///C:/Users/Ernest/miniconda3/envs/pyif/Lib/site-packages/dyneusr/tools/graph_utils.py:421) M = np.zeros((nTR, A.shape[0]))    #   TR x node
    [422](file:///C:/Users/Ernest/miniconda3/envs/pyif/Lib/site-packages/dyneusr/tools/graph_utils.py:422) T = np.zeros((nTR, nTR))

AttributeError: module 'networkx' has no attribute 'to_numpy_matrix'
Output is truncated. View as a [scrollable element](command:cellOutput.enableScrolling?7372d79f-d26c-4711-8e36-38f0ab3ed62d) or open in a [text editor](command:workbench.action.openLargeOutput?7372d79f-d26c-4711-8e36-38f0ab3ed62d). Adjust cell output [settings](command:workbench.action.openSettings?%5B%22%40tag%3AnotebookOutputLayout%22%5D)...

Recommend Projects

  • React photo React

    A declarative, efficient, and flexible JavaScript library for building user interfaces.

  • Vue.js photo Vue.js

    ๐Ÿ–– Vue.js is a progressive, incrementally-adoptable JavaScript framework for building UI on the web.

  • Typescript photo Typescript

    TypeScript is a superset of JavaScript that compiles to clean JavaScript output.

  • TensorFlow photo TensorFlow

    An Open Source Machine Learning Framework for Everyone

  • Django photo Django

    The Web framework for perfectionists with deadlines.

  • D3 photo D3

    Bring data to life with SVG, Canvas and HTML. ๐Ÿ“Š๐Ÿ“ˆ๐ŸŽ‰

Recommend Topics

  • javascript

    JavaScript (JS) is a lightweight interpreted programming language with first-class functions.

  • web

    Some thing interesting about web. New door for the world.

  • server

    A server is a program made to process requests and deliver data to clients.

  • Machine learning

    Machine learning is a way of modeling and interpreting data that allows a piece of software to respond intelligently.

  • Game

    Some thing interesting about game, make everyone happy.

Recommend Org

  • Facebook photo Facebook

    We are working to build community through open source technology. NB: members must have two-factor auth.

  • Microsoft photo Microsoft

    Open source projects and samples from Microsoft.

  • Google photo Google

    Google โค๏ธ Open Source for everyone.

  • D3 photo D3

    Data-Driven Documents codes.