A library (or a module/package) is a pre-written piece of software that you can re-use rather than having to write that functionality yourself. So instead of having to write the code from scratch to plot a bar chart, you can just call the Matplotlib library instead.
In this lesson, we will look at some of the key libraries used in Python for data science.
You will be able to:
- Understand and be able to explain what a library is and why is it important
- Understand and explain the purpose of the key data science libraries in Python (Numpy, Pandas, Seaborn, Matplotlib, SciPy, Scikit-learn, StatsModels, TensorFlow and Keras
One of the key requirements for a data scientist is to be able to convert data into an easy to process format. Data, represented inside a computer may become too large to be processed efficiently by Pythons native lists and dictionaries and using Python's built in methods. The following libraries add scientific computation abilities to Python for working efficiently with larger data sets.
In Python, the most fundamental package used for scientific computation is NumPy (Numerical Python). It provides lots of useful functionality for mathematical operations on vectors and matrices in Python. Matrix computation is the primary strength of NumPy.

The library provides these mathematical operations using the NumPy array data type, which enhances performance and speeds up execution when compared to Python's default methods and data types. It contains among other things:
- A powerful N-dimensional array object
- Sophisticated (broadcasting) functions
- Tools for integrating C/C++ and Fortran code
- Useful linear algebra, Fourier transform, and random number capabilities
- Besides its obvious scientific uses, NumPy can also be used as an efficient multi-dimensional container of generic data. Arbitrary data-types can be defined. This allows NumPy to seamlessly and speedily integrate with a wide variety of databases.
Numpy is also used as a foundation for other more advanced libraries as we shall see below.
In the data science domain, Python’s SciPy Stack ( a collection of software specifically designed for scientific computing ) is used heavily for conducting scientific experiments. The SciPy library is as integral part of this stack.

SciPy is a library of software for engineering and science applications and contains functions for linear algebra, optimization, integration, and statistics.
The functionality of the SciPy library is built on top of NumPy, and its data structures make heavy use of NumPy. It provides efficient numerical computational routines and comes packaged with a number of specific submodules. Following are a few modules from this library which are very commonly applied to data science experiments.
- stats: statistical functions
- linalg: linear algebra routines
- fftpack: Discrete Fourier Transform algorithms
- signal: signal processing tools
- optimize: optimization algorithms including linear programming
Statsmodels is a library for Python that enables its users to conduct data exploration via the use of various methods of estimation of statistical models and performing statistical assertions and analysis.
One of the many useful features it provides is a comprehensive set of descriptive statistics. The library provides insights when diagnosing issues with with linear regression models, generalized linear models, discrete choice models, robust linear models, and time series analysis models with various estimators.
The library also provides extensive plotting functions that are designed specifically for statistical analysis and are optimized for good performance with large data sets.
Pandas is a Python package designed to do work with “relational” data and helps replicates the functionality of relation databases in a simple and intuitive way. Pandas is a great tool for data wrangling. It is designed for quick and easy data cleansing, manipulation, aggregation, and visualization.
There are two main data structures in the library:
- “Series” — one-dimensional
- “Data Frames” - two-dimensional
These data types can be manipulated in a number of ways for analytical needs. Hereare a few ways in which pandas may come in handy:
- Easily delete and add columns from DataFrame
- Convert data structures to DataFrame objects
- Handle missing data and outliers
- Powerful grouping and aggregation functionality
- Offers visualization functionality under the hood to plot complex statistical visualizations on the go
- The data structures in Pandas are highly compatible with most of other libraries.
Data visualization is one of the most common . tasks that data scientists have to perform. Traditionally, drawing visualizations would involve providing pixel level details and complex mathematical functions to create the plots. Luckily, Python has good library support for data visualization from plotting routine visualizations in matplotlib, to developing graphical dashboards in Plotly and Bokeh. In this course, we will cover following graphical packages.
Matplotlib is another SciPy Stack package and a library that is tailored for the generation of simple and powerful visualizations. It is a sophisticated package which is making Python (with the help of NumPy, SciPy, and Pandas) an industry standard analytics tool.
Matplotlib is a flexible plotting library for creating interactive 2D and 3D plots that can also be saved as manuscript-quality figures. The API in many ways reflects that of MATLAB, easing transition of MATLAB users to Python. Many examples, along with the source code to re-create them, are available in the matplotlib gallery. With a bit of effort you can make just about any visualizations:
Line plots
Scatter plots
Bar charts and Histograms
Pie charts
Stem plots
Contour plots
Quiver plots
Spectrograms
There are also facilities for creating labels, grids, legends, and many other formatting entities with Matplotlib. Basically, everything is customizable.
The library, however, is pretty low-level which means that you will need to write more code to for advanced visualizations and will generally need more effort.
Seaborn is complimentary to Matplotlib and it specifically targets statistical data visualizations, which maybe more time-consuming to implement using Matplotlib. Seaborn extends the functionality of Matplotlib and that’s why it can address the two biggest issues of working with Matplotlib - the Quality of plots and Parameter defaults.
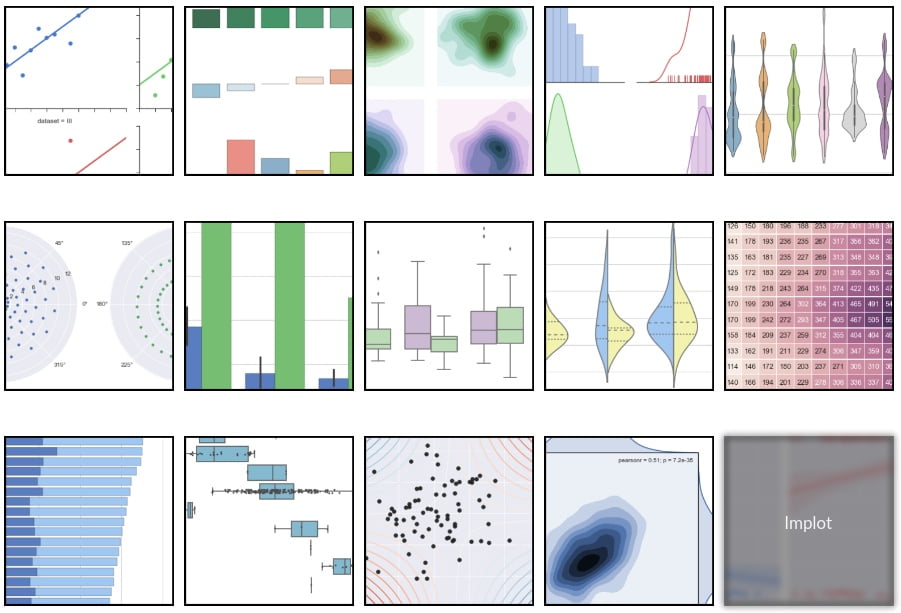
If matplotlib “tries to make easy things easy and hard things possible”, seaborn tries to make a well-defined set of hard things easy too.
As Seaborn compliments and extends Matplotlib. If you know Matplotlib, you’ll already have most of Seaborn down. your plots with seaborn will be more attractive, need less time to create and will reveal more information.
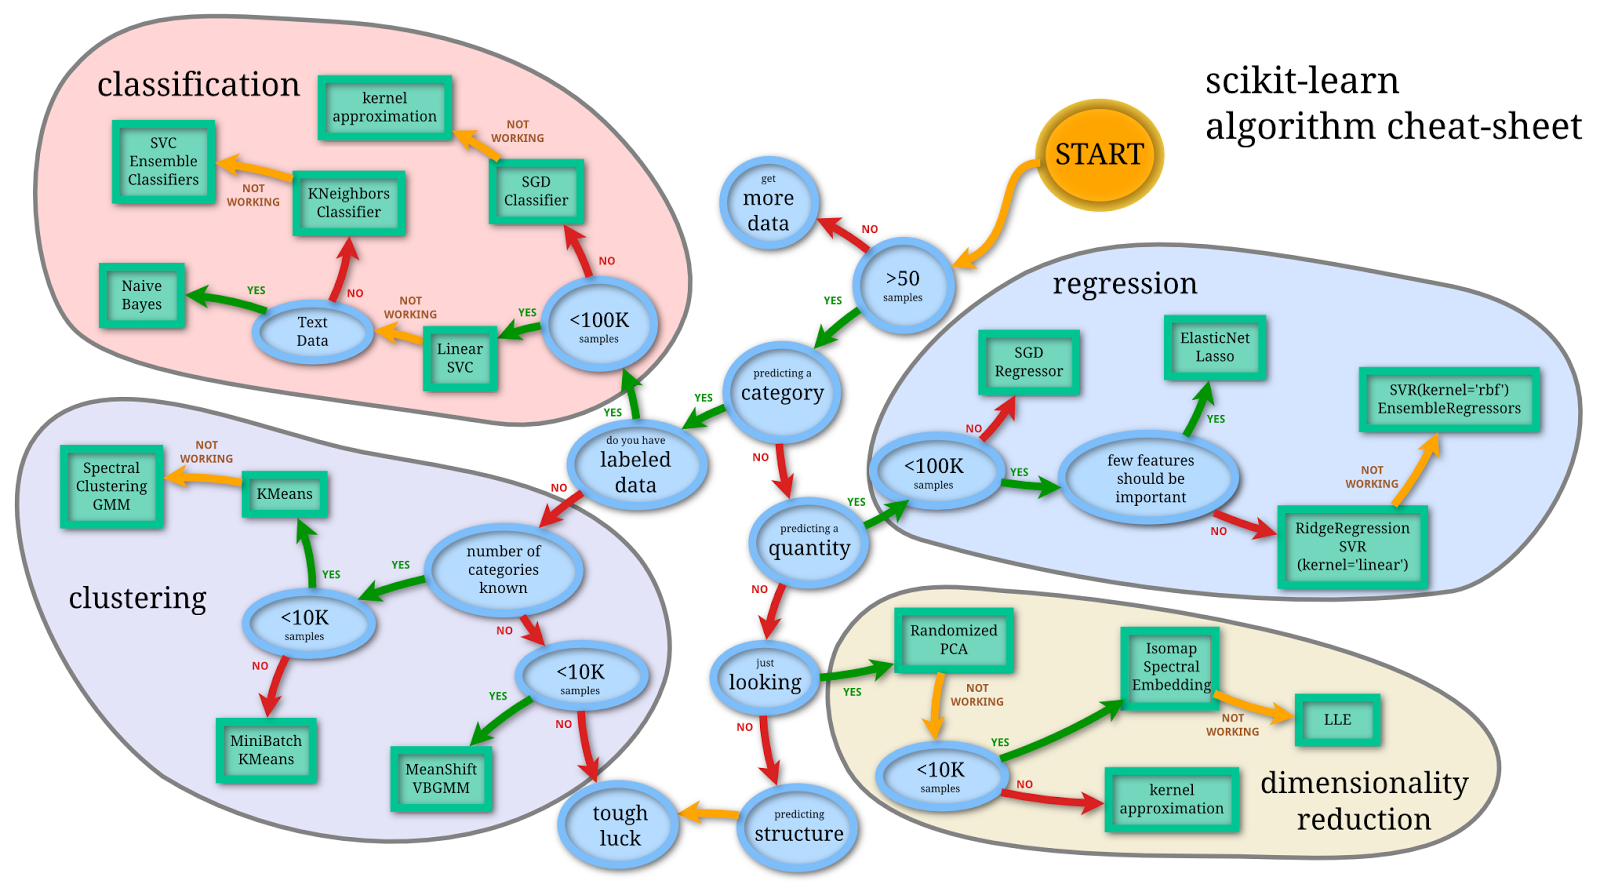
Scikits provide Scientific "kits" on top of SciPy Stack. These are designed to add specific functionality to SciPy like image processing and machine learning facilitation. For machine learning, one of the most heavily used package is scikit-learn. The package makes heavy use of its mathematical operations to model and test complex computational algorithms.
Scikit-learn (sometimes abbreviated to sklearn) offers a consistent interface to common Machine Learning (ML) algorithms, making it simple to bring ML into production systems. The library combines quality code and good documentation, ease of use and high performance and has become industry standard for machine learning with Python. The image below highlights the key machine learning algorithms that come packaged with sklearn for problems in classification, regression, clustering and dimensionality reduction.
For Deep Learning, one of the most popular and convenient libraries for Python is Keras, which builds on top of TensorFlow.
Developed by a team of ML experts at Google, TensorFlow is an open-source library of data flow graph computations, which are fine tuned for heavy duty Machine Learning. TensorFlow was designed to meet the performance requirements of Google for training Deep Neural Networks in order to analyze visual and textual data. However, TensorFlow isn’t limited to scientific use - it is general enough to use in a variety of real-world application.

The key feature of TensorFlow is its multi-layered nodes system that enables quick training of artificial neural networks on big data. This is the library that powers Google’s voice recognition and object recognition in real time.
Keras is an open-source library for building Neural Networks with a high-level of interface abstraction. The Keras library is written in Python so python developers find it much easier to start coding for deep networks in Keras, than Tensorflow, which demands a deeper understanding of graph computation. Keras is much more minimalistic and straightforward while still being highly extensibile. Under the hood, It can use either Theano (another deep learning library) or TensorFlow.

Keras is really eased to get started with and for quick prototyping. It is highly modular and extendable. Notwithstanding its ease, simplicity, and high-level orientation, Keras is still deep and powerful enough for serious modeling. In the deep learning section of our course, we shall introduce you to Keras to help you deep dive into deep neural networks.
A big part of your journey as a data scientist will be building comfort and familiarity with the key Python data science libraries that we're outlined in this lesson. As the course progresses you'll get plenty of hands on experience with each one of them!


