Britecharts-react is a React wrapper for the Britecharts charting library.


 |
 |
 |
|---|---|---|
 |
 |
|
 |
Import components from Britecharts-React:
//ES6 import syntax
import { StackedArea } from 'britecharts-react';

//CommonJS require syntax
const { StackedArea } = require('britecharts-react');
Britecharts-React components are used just like any other stateless React component. You will pass in some props, and it would render a chart:
<StackedArea
    data={stackedAreaData.with2Sources()}
    width={600}
    height={400}
/>Each component's API will be a reflection of Britecharts charts and their APIs. That way, if we need to render a bar chart, we will first check the bar chart's API in the main project API reference page. You can read more about the approach here
From there, we will proceed to pass each of the configurations through the usual props as we do in React projects:
<Bar
    data={barData.with2Entries()}
    width={400}
    isHorizontal={true}
    margin={marginObject}
>
The complete set of components is in progress; the following components are currently implemented and available for use:
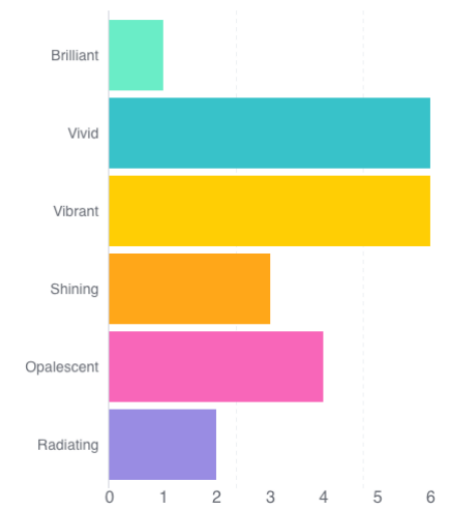
- Bar charts (API)
- Bullet charts (API)
- Grouped Bar charts (API)
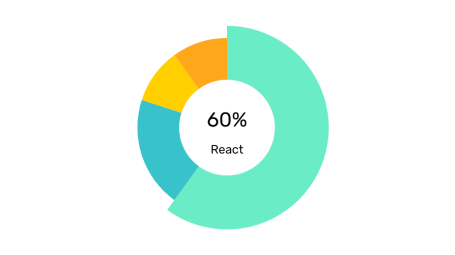
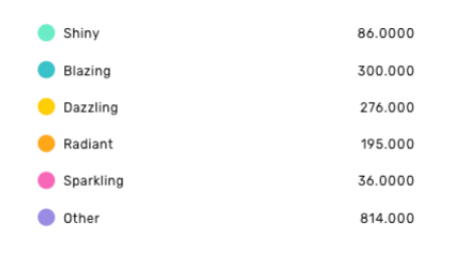
- Donut charts (API)
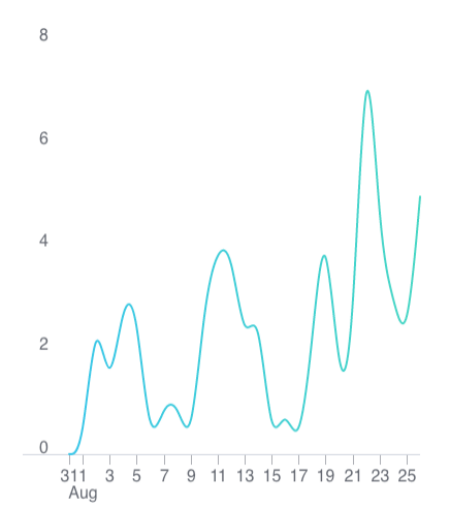
- Line charts (API)
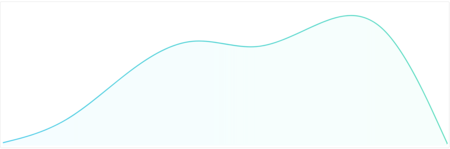
- Sparkline charts (API)
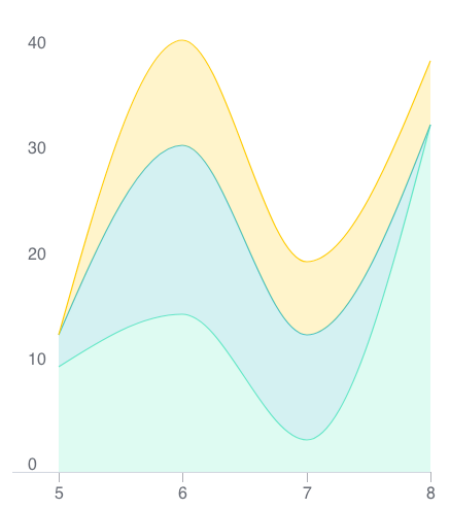
- Stacked Area charts (API)
- Stacked Bar charts (API)
- Tooltips (API)
- Step charts (API)
- Legends (API)
The following components haven't been migrated yet from Britecharts:
- Brush charts
- Heatmaps
- Mini Tooltips
- Scatter Plots
If you need to use one of the missing charts, check out our how-to guide for creating new charts.
Britecharts-React is available as an NPM module or through CDN links (in different formats or a bundle).
You can also use individual bundles in UMD format (dist/umd/), CommonJS format (lib/cjs), and tree-shaking-enabling ES2015 modules (lib/esm) to add to your bundle. You can see more on our test project.
Developers also need to load the stylesheets located in dist/britecharts-react.min.css to style the charts correctly.
We are accepting PRs for creating wrappers for Britecharts components. Check our contributing guide, drop by the #britecharts channel in the d3 slack, or create an issue if you want to know more.
For this project, we have followed the approach called ‘Mapping Lifecycle methods’ based on Nicholas Hery's article. We want to recognize all the contributors in the parent project Britecharts.
Copyright 2017 Eventbrite
Licensed under the Apache License, Version 2.0 (the “License”); you may not use this file except in compliance with the License. You may obtain a copy of the License at
https://www.apache.org/licenses/LICENSE-2.0
Unless required by applicable law or agreed to in writing, software distributed under the License is distributed on an “AS IS” BASIS, WITHOUT WARRANTIES OR CONDITIONS OF ANY KIND, either express or implied. See the License for the specific language governing permissions and limitations under the License.
Read more in the license document.
Thanks goes to these wonderful people (emoji key):
 David Gómez 💻 🤔 🚧 👀 |
This project follows the all-contributors specification. Contributions of any kind welcome!

![allcontributors[bot] avatar](https://avatars.githubusercontent.com/in/23186?v=4 "allcontributors[bot]")


![dependabot[bot] avatar](https://avatars.githubusercontent.com/in/29110?v=4 "dependabot[bot]")


