Giter Site home page Giter Site logo

btd / rollup-plugin-visualizer Goto Github PK

View Code? Open in Web Editor NEW
1.7K 6.0 55.0 8.56 MB

๐Ÿ“ˆโš–๏ธ Visuallize your bundle

License: MIT License

JavaScript 6.20% SCSS 1.87% TypeScript 91.93%
rollup rollup-plugin visualization bundle hacktoberfest rollup-plugin-visualizer chart

rollup-plugin-visualizer's Introduction

Rollup Plugin Visualizer

NPM Version Node.js CI

Visualize and analyze your Rollup bundle to see which modules are taking up space.

Screenshots

pic

Installation

npm install --save-dev rollup-plugin-visualizer

or via yarn:

yarn add --dev rollup-plugin-visualizer

Usage

Import

// es
import { visualizer } from "rollup-plugin-visualizer";
// or
// cjs
const { visualizer } = require("rollup-plugin-visualizer");

Usage with rollup (rollup.config.js)

module.exports = {
  plugins: [
    // put it the last one
    visualizer(),
  ],
};

Usage with vite (vite.config.js)

module.exports = {
  plugins: [visualizer()],
};

Usage with vite TypeScript (vite.config.ts)

import { defineConfig, type PluginOption } from 'vite'
export default defineConfig({
  plugins: [visualizer() as PluginOption],
})

Usage with SvelteKit (vite.config.js)

const config = {
  plugins: [
    visualizer({
      emitFile: true,
      filename: "stats.html",
    }),
  ],
};

export default config;

You will find 2/3 files in .svelte-kit/output dir named stats.html (see vite logs for file locations) . You can use this snippet as a starting point and change props/path. You can also generate 3 json files and combine them to one with cli util.

How to use generated files

Blue color used to to mark project-own files. This could be: written by you files or generated by build tool files.

Green color used to mark your dependencies.

Internally it just checks if file id prefix is node_modules.

All charts refresh layout on window resize.

Sunburst

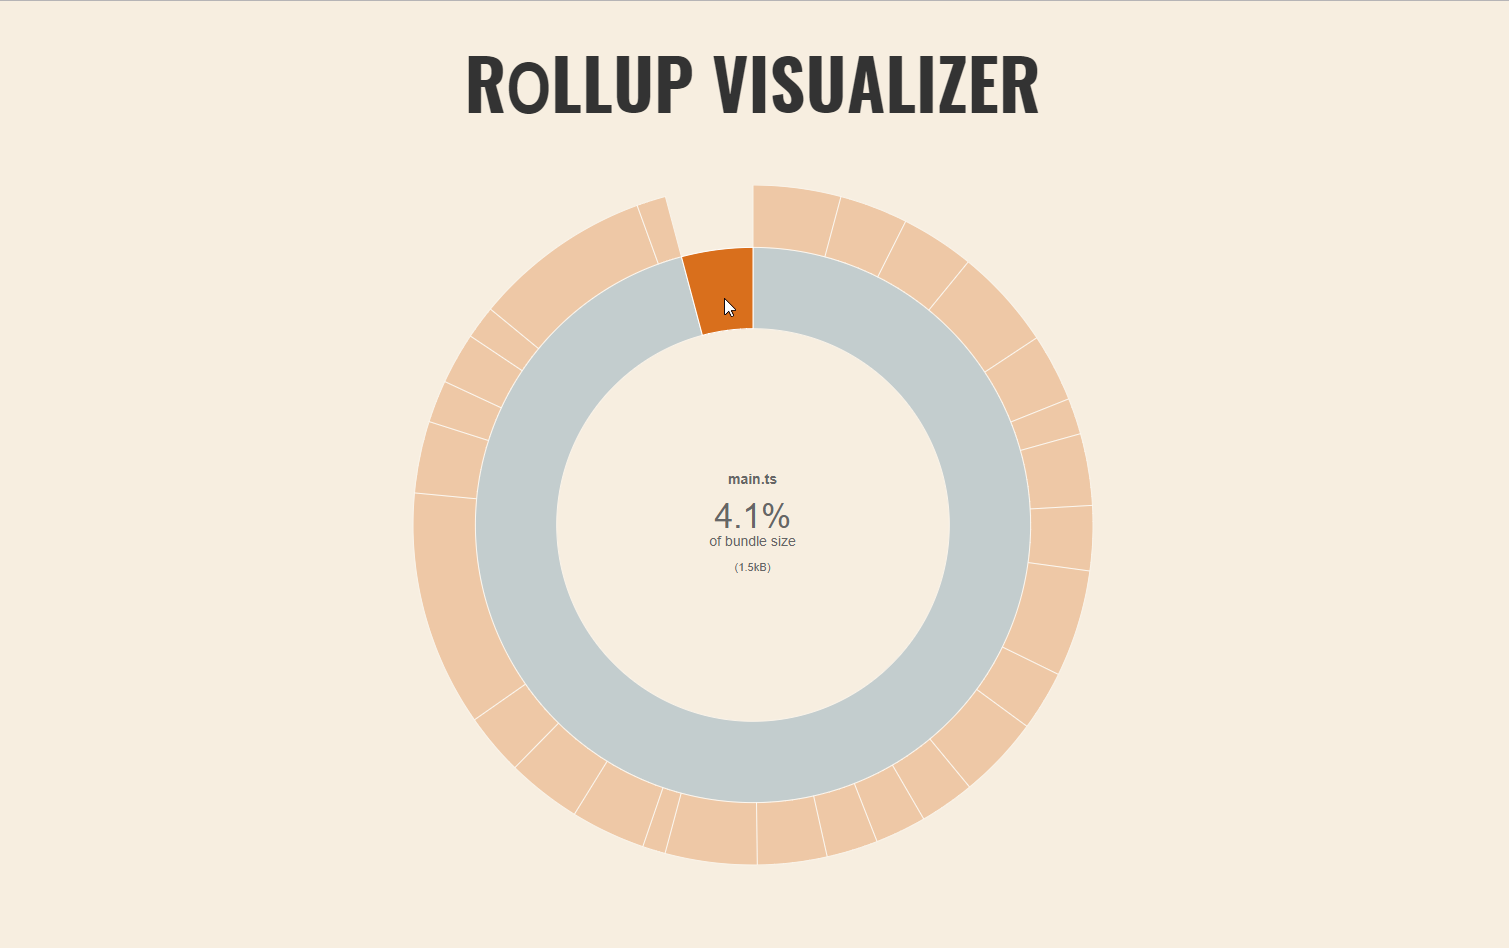
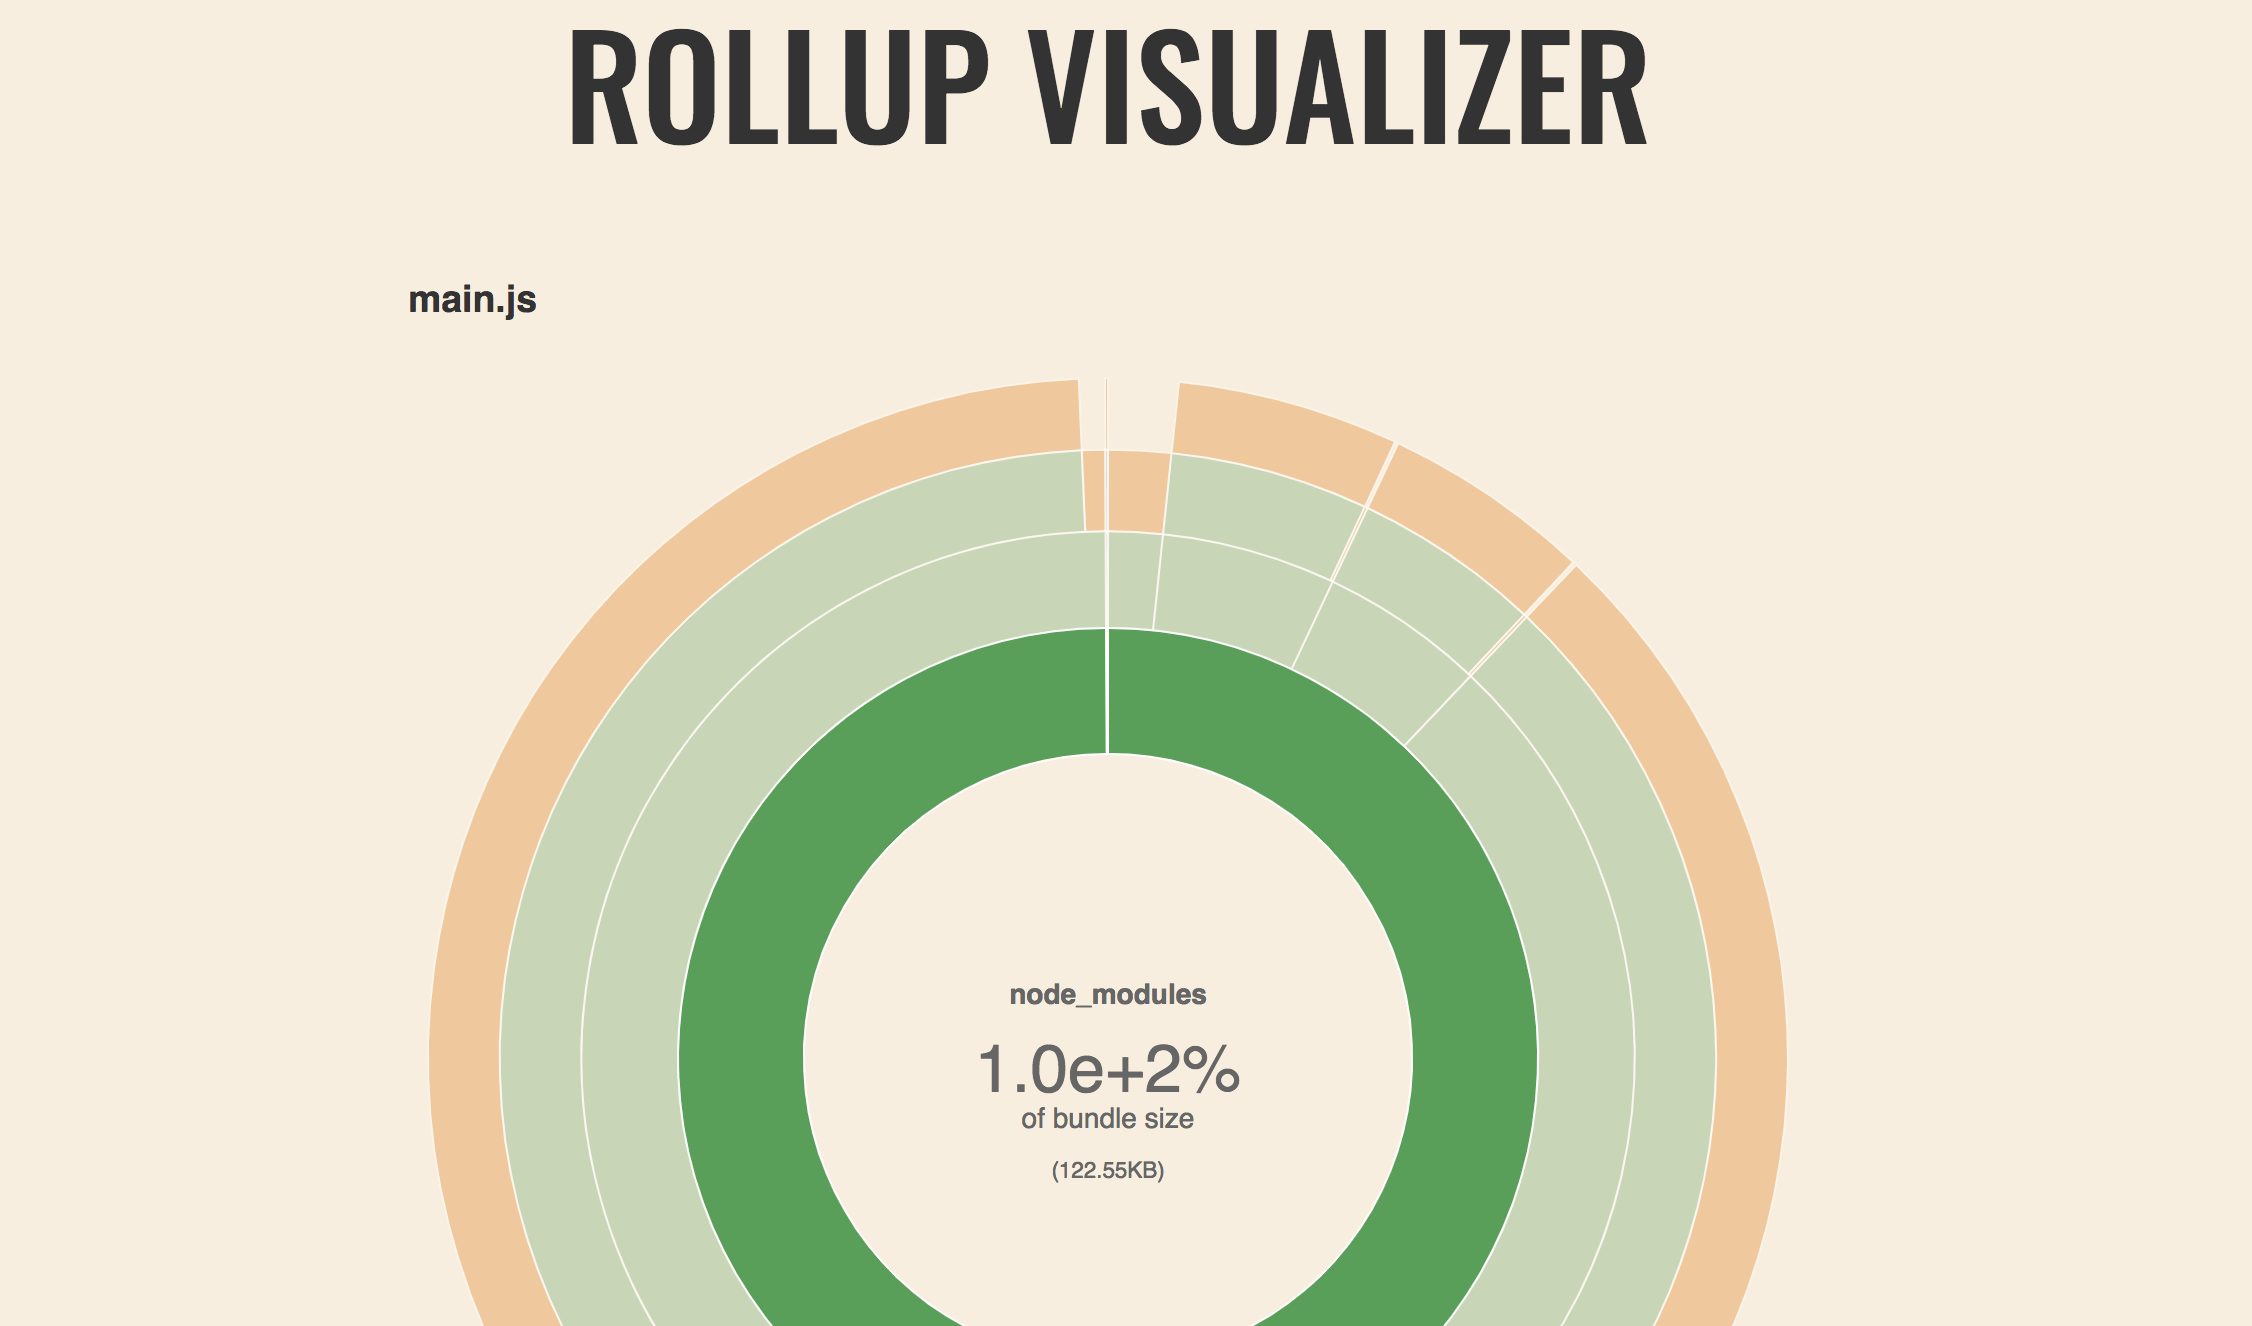
This circular hierarchical diagram can help you find huge pieces of code (aka that one huge thing). If you click on some arc it will increase its and all nested arcs size for better inspection.

Treemap

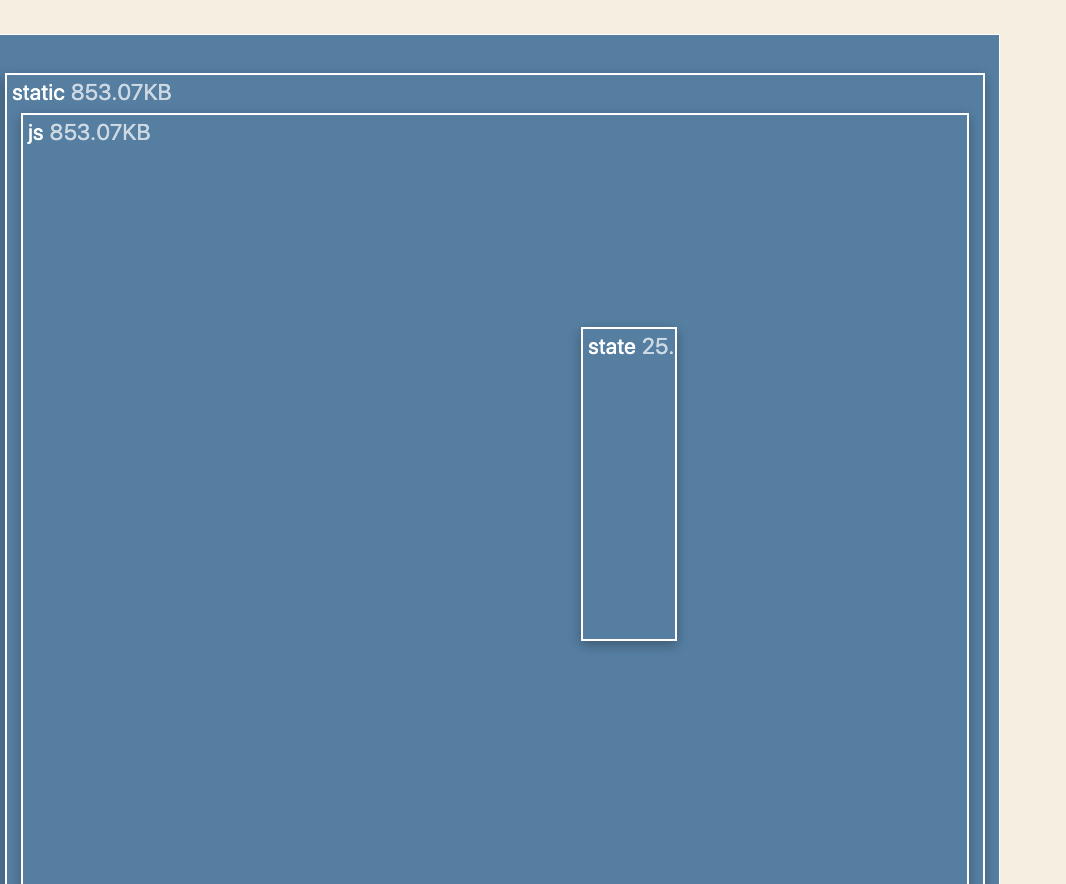
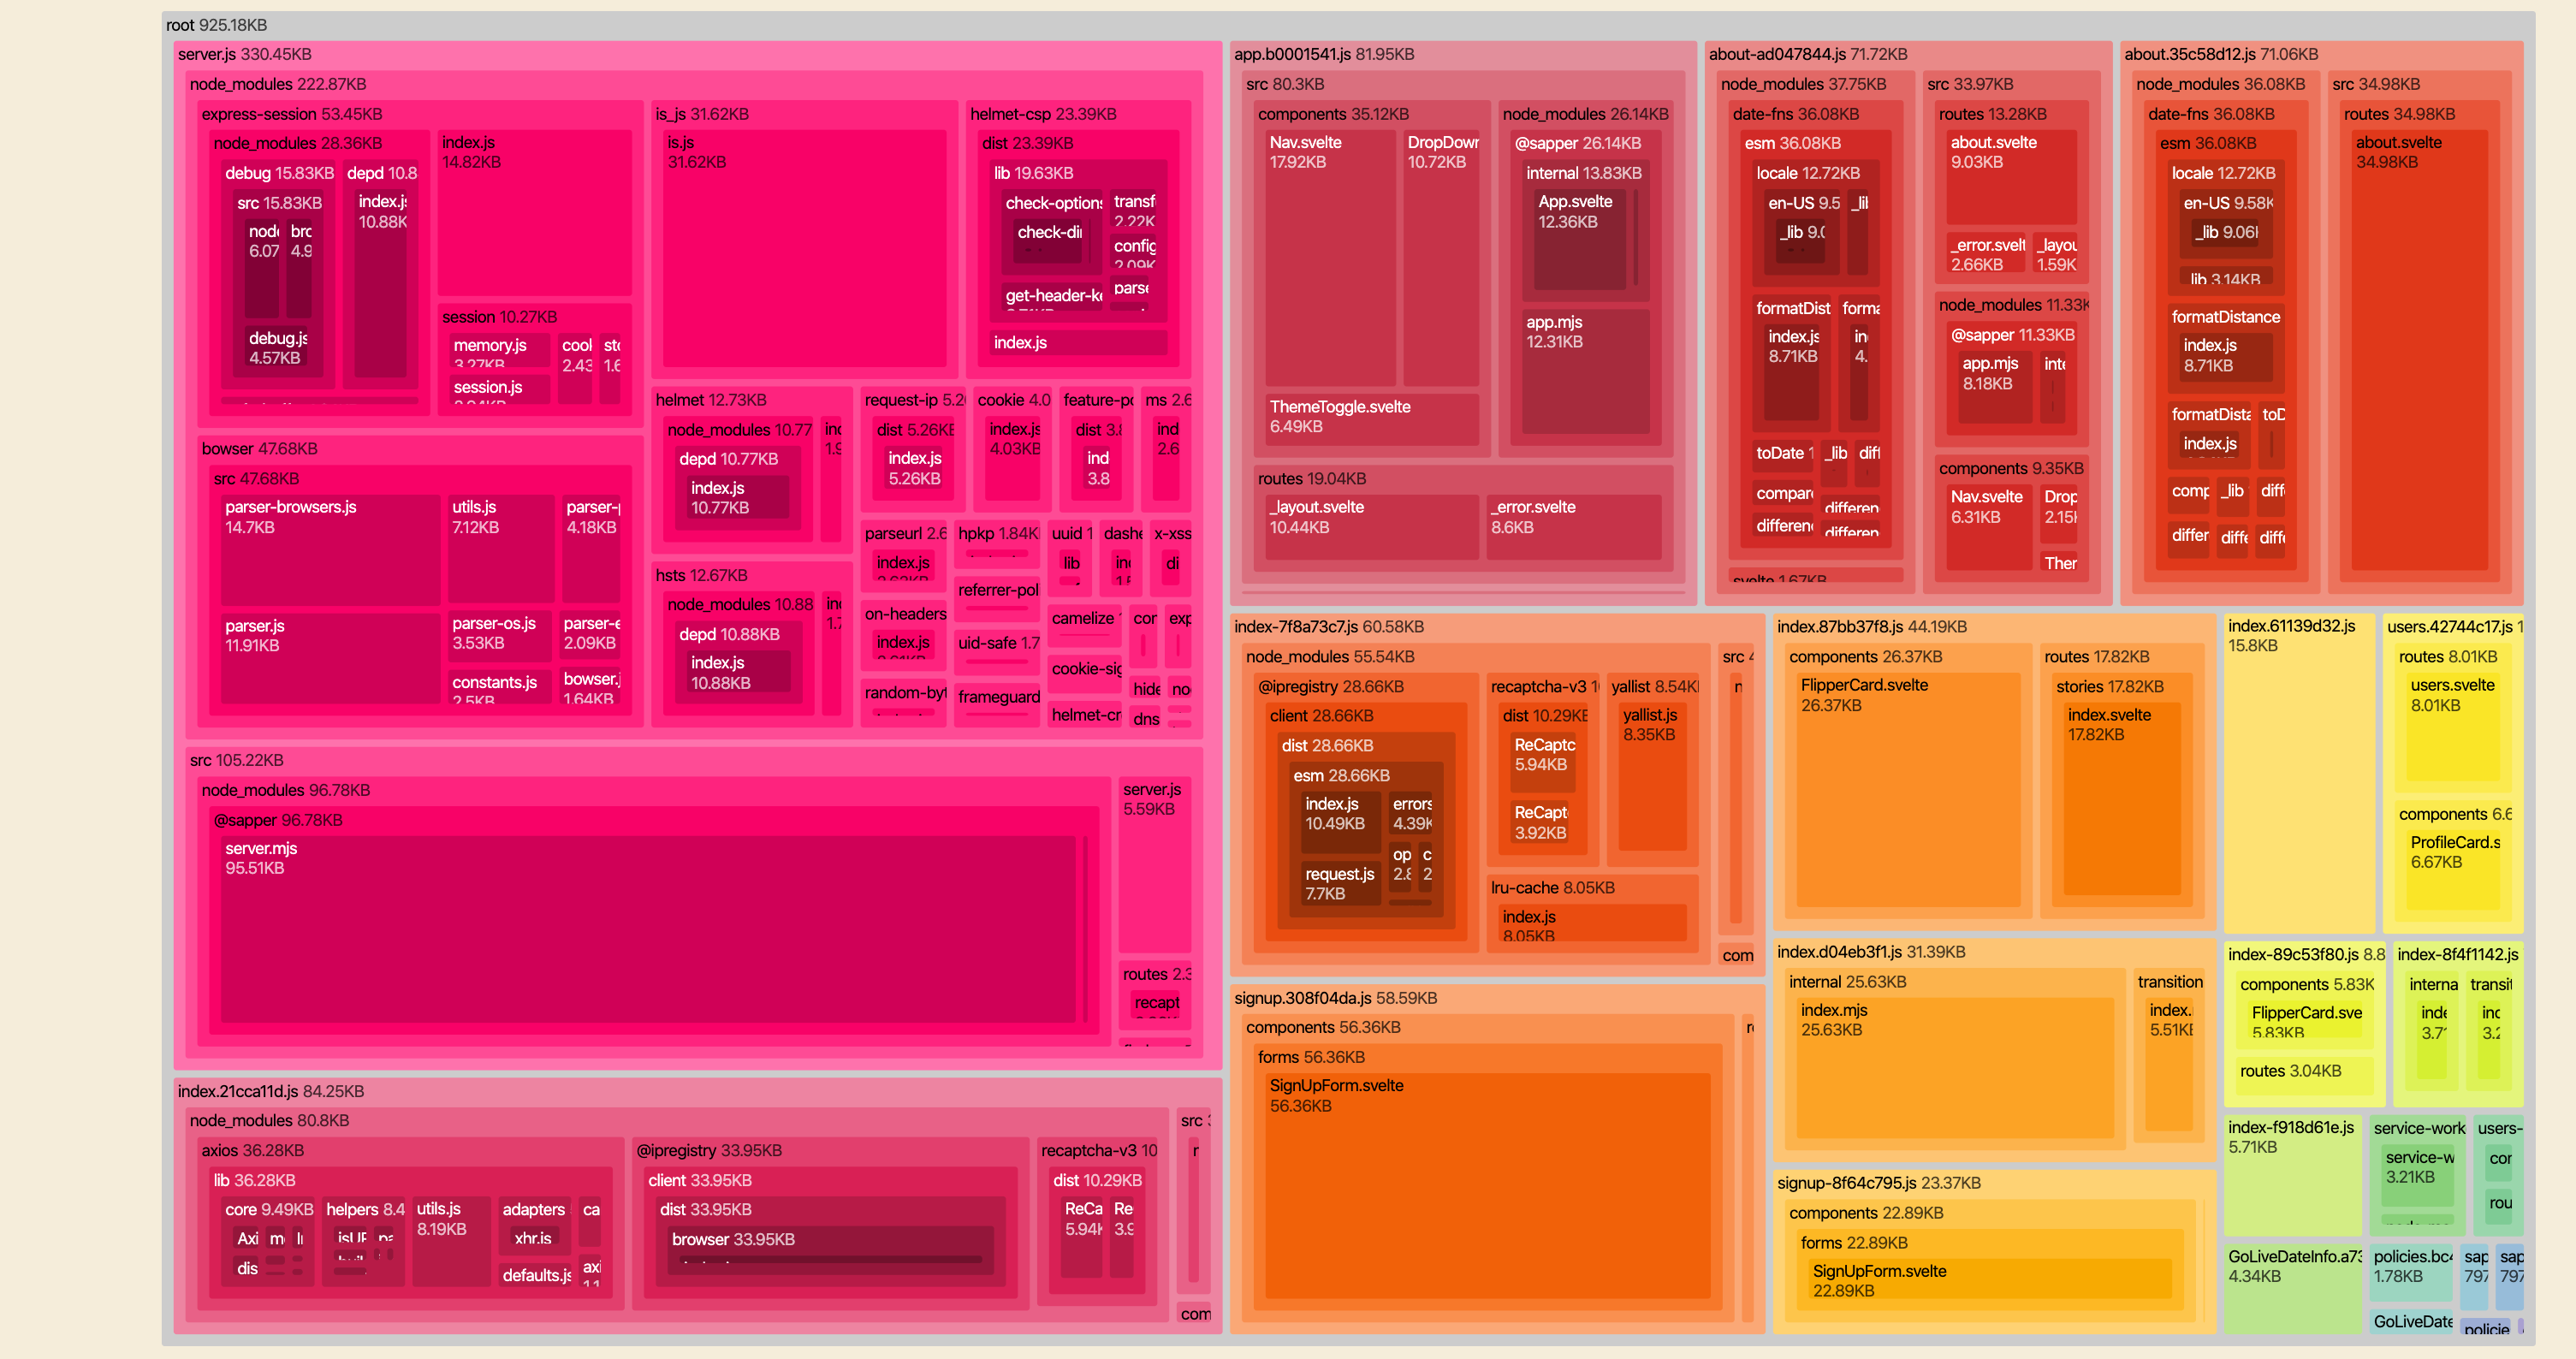
This rectangular hierarchical diagram can help you find huge pieces. Just look on biggest reclangle. But also it can help you find modules included several times, they will have the same topology and relative size. If you click on reclangle it will increase in size for further inspection.

Network

This digram should help you answer for the question 'why it is included?'. After force layout stabilize all nodes, you can move it back and forth by dragging with your mouse. Gray circles are treeshakened out files.

In real life scenarious, sometimes you will see terribly connected diagrams. There is no 100% working solution for everyone, it is expected you topology will look 'terrible' and not hold on screen. To make it still visually ispectable, first remove all highly connected nodes that you see (typical examples: commonjsHelpers, tslib, react etc, basically if tooltip for the node is not hold on the screen - exclude this node), after layout stabilization you will see, your layout is not that terrible anymore and most of dependencies cluster together. Move layout to find pieces you looked for.

When you click on node it will hightlight nodes that are listed in tooltip (the files that imports current node).

Raw-data

This template produce JSON output with raw data. Normally it should be used with CLI from this plugin.

List

Output yml file with all the data, could be good idea to commit this file to track file changes.

Options

filename (string, default stats.{ext depending template}) - name of the file with diagram to generate

title (string, default Rollup Visualizer) - title tag value

open (boolean, default false) - Open generated file in default user agent

template (string, default treemap) - Which diagram type to use: sunburst, treemap, network, raw-data, list.

gzipSize (boolean, default false) - Collect gzip size from source code and display it at chart.

brotliSize (boolean, default false) - Collect brotli size from source code and display it at chart.

Advanced options (touch only if you really need it):

emitFile (boolean, default false) - Use rollup's emitFile to generate file. Useful if you want to control all output in one place (via rollup output options). This also could be usefull with svelte as it calls vite several times.

sourcemap (boolean, default false) - Use sourcemaps to calculate sizes (e.g. after UglifyJs or Terser). Always add plugin as last option.

projectRoot (string | RegExp, default process.cwd()) - This is some common root(s) path to your files. This is used to cut absolute files paths out.

include (Filter | Filter[], default undefined) - Filter for inclusion

exclude (Filter | Filter[], default undefined) - Filter for exclusion

Filter type is { bundle?: picomatchPattern, file?: picomatchPattern }

Note about include and exclude - If options.include is omitted or has zero length, filter will return true by default. Otherwise, an ID must match one or more of the picomatch patterns, and must not match any of the options.exclude patterns. This entries will not be included in stats at all.

Include and Exclude

Include and exclude filters uses glob matchers with picomatch. In UI you can do such combinations (both exclude and include):

  • Filter bundle and file in one string
    • translation-*.js:*/**/index.js - this selects all bundles that matches translation-*.js and all the files by all paths that name is index.js. : is separator and required only when bundle search used.
    • Format for this kind of filter is BUNDLE_GLOB:FILE_GLOB
  • Filter bundle in one string
    • This is special case of bundle+file filter, you need to omit FILE_GLOB part (empty string)
  • Filter file in one string
    • This is DEFAULT search option
    • */**/index.js - select all files that name is index.js

CLI

This plugin provides cli util rollup-plugin-visualizer. Add --help to check actual options. It can be used like:

rollup-plugin-visualizer [OPTIONS] stat1.json stat2.json ../stat3.json

This can be usefull in case you have different config files in the same project and you want to display all of them in the same chart.

Build plugin

For development if you need to build plugin, just exec:

npm run build

Disclaimer about generated files

Generated html files do not and never will contain your source code (contents of files). They can contain only js/html/css code required to build chart (plugin code) and statistical information about your source code.

This statistical information can contain:

  • size of files included in bundle
  • size of files included in source map
  • file's paths
  • files hierarchy (fs tree for your files)

Upgrades

See CHANGELOG.md.

Versioning

  • Plugin backend (one appears in configs) are strictly follows SemVer
  • Plugin frontend (generated file):
    • network, treemap, sunburst can change does not matter of version (colors, texts, visual structure etc)
    • raw-data format follows own version property
    • list follows semver

rollup-plugin-visualizer's People

Contributors

braidenpsiuk avatar btd avatar cameronhunter avatar christopherthielen avatar dsmilkov avatar enoahnetzach avatar epreston avatar gfriedm4 avatar gkatsev avatar haroenv avatar jbowns avatar mattiasbuelens avatar nirtamir2 avatar patrickchen928 avatar powerlanguage avatar pramilk avatar rejhgadellaa avatar reslear avatar shrynx avatar stenehall avatar susickypavel avatar swansontec avatar vladimyr avatar

Stargazers

 avatar  avatar  avatar  avatar  avatar  avatar  avatar  avatar  avatar  avatar  avatar  avatar  avatar  avatar  avatar  avatar  avatar  avatar  avatar  avatar  avatar  avatar  avatar  avatar  avatar  avatar  avatar  avatar  avatar  avatar  avatar  avatar  avatar  avatar  avatar  avatar  avatar  avatar  avatar  avatar  avatar  avatar  avatar  avatar  avatar  avatar  avatar  avatar  avatar  avatar  avatar  avatar  avatar  avatar  avatar  avatar  avatar  avatar  avatar  avatar  avatar  avatar  avatar  avatar  avatar  avatar  avatar  avatar  avatar  avatar  avatar  avatar  avatar  avatar  avatar  avatar  avatar  avatar  avatar  avatar  avatar  avatar  avatar  avatar  avatar  avatar  avatar  avatar  avatar  avatar  avatar  avatar  avatar  avatar  avatar  avatar  avatar  avatar  avatar  avatar

Watchers

 avatar  avatar  avatar  avatar  avatar  avatar

rollup-plugin-visualizer's Issues

Cannot read property 'renderedLength' of undefined

My bundles html page doesn't show any anything anymore (blank page in Chrome). I'm getting this error in my chrome dev tools console:

edm-bundles.html:3180 Uncaught TypeError: Cannot read property 'renderedLength' of undefined
    at edm-bundles.html:3180
    at Node.node_eachAfter [as eachAfter] (edm-bundles.html:1142)
    at drawChart (edm-bundles.html:3173)
    at HTMLDocument.<anonymous> (edm-bundles.html:3356)

Issue while running react-styleguidist.

I am having issue with the package typeface-oswald when I try to run my react-styleguidist documentation.

I have checked and typeface-oswald package is installed with this package.

$ npm ls typeface-oswald
@yeutech/[email protected] 
โ””โ”€โ”ฌ @rollup-umd/[email protected]
     โ””โ”€โ”ฌ [email protected]
          โ””โ”€โ”€ [email protected] 

This is the error:

./node_modules/typeface-oswald/files/oswald-latin-700.woff2 1:4
Module parse failed: Unexpected character '' (1:4)
You may need an appropriate loader to handle this file type.
(Source code omitted for this binary file)
 @ ./node_modules/typeface-oswald/index.css (./node_modules/css-loader/dist/cjs.js!./node_modules/typeface-oswald/index.css) 14:42-83
 @ ./node_modules/typeface-oswald/index.css
 @ ./node_modules/rollup-plugin-visualizer/plugin.js
 @ ./node_modules/@rollup-umd/rollup/dist/@rollup-umd/rollup.esm.js
 @ ./node_modules/react-styleguidist/lib/loaders/examples-loader.js!./docs/distribution.md
 @ ./node_modules/react-styleguidist/lib/loaders/styleguide-loader.js!./node_modules/react-styleguidist/lib/client/index.js
 @ ./node_modules/react-styleguidist/lib/client/index.js
 @ multi ./node_modules/react-styleguidist/lib/client/index ./node_modules/react-dev-utils/webpackHotDevClient.js

I have tried to downgrade to older version and it seems that it is not related so I am looking for hint.

Why this error appeared? Thanks in advance

No chart when single file with no dependencies is used

Hey,

there is no chart when single file is used with no dependencies.

input file

console.log('hey')

after processed with rollup

(function () {
	'use strict';

	console.log('hey');

}());

result

rv

package versions

rollup - 1.2.2
rollup-plugin-visualizer - 1.0.0

I'd expect a chart with 100% :)

Add a Changelog

Would be nice to track changes and know if anything will break if I upgrade. Thanks!

Doesn't work with TypeScript

This doesn't seem to work when using TypeScript. It looks like it is only displaying the size of my main.ts file and not the entire module tree it pulls in.

In my screenshot the other - much larger - module is a file that imports a bunch of SVGs.

2017-11-02_17-13-57

Rollup 2.0.0 "isAsset" is deprecated.

While using plugin with Rollup 2.0.0 and later following warning is shown:
Accessing "isAsset" on files in the bundle is deprecated, please use "type === 'asset'" instead.

Deeper view, file names are not shown

Is it possible to show files deeper in the folder structure?
On my end no .js (orange) files are shown in the treemap.
/static/js contains many more folders.

Screen Shot 2019-10-31 at 6 34 47 PM

sourcemap: true errors

Hi,

if I'm setting sourcemap: true (plugin is placed after uglify plugin), I get the following error:

[!] (visualizer plugin) TypeError: Cannot read property 'sections' of null
TypeError: Cannot read property 'sections' of null
    at _factory (C:\ccb\projects\project\node_modules\rollup-plugin-visualizer\node_modules\source-map\lib\source-map-consumer.js:1246:30)
    at new SourceMapConsumer (C:\ccb\projects\project\node_modules\rollup-plugin-visualizer\node_modules\source-map\lib\source-map-consumer.js:26:12)
    at Function.with (C:\ccb\projects\project\node_modules\rollup-plugin-visualizer\node_modules\source-map\lib\source-map-consumer.js:74:21)
    at addMinifiedSizesToModules (C:\ccb\projects\project\node_modules\rollup-plugin-visualizer\plugin\sourcemap.js:72:32)
    at Object.generateBundle (C:\ccb\projects\project\node_modules\rollup-plugin-visualizer\plugin\index.js:49:17)
    at Promise.resolve.then (C:\ccb\projects\project\node_modules\rollup\dist\rollup.js:15429:25)
    at process._tickCallback (internal/process/next_tick.js:68:7)

Sadly I can not provide a repro as it's a huge client project with a huge rollup setup. Does the error ring a bell maybe?

Thanks in advance

Refine sizes

It would be nice to deal with sourcemap and other sizes better. It would be nice to have config like:

{
size: [ 'rendered', 'sourcemap', 'gzip', 'original' ]
}

This will allow to order of sizes and enable/disable behavior.

Working with code splitting

A clear and concise description of what you want to happen.

I don't believe this works with code splitting right now. All I see is an empty output, not sure if its because output.file is not used and output.dir is used instead?

Upgrade to d3 v6

  • Drop d3-collection
  • Update d3-selection: d3.event and d3.mouse will be droped. This is mostly about tooltip

Changes d3/d3#3333

Support for Rollup 1.x

This plugin seems to be working with Rollup 1.x, so it may be just a matter of issuing npm upgrade and releasing a new version.
Thanks!

Percentage is shown as 1.0e+2% when a part is too small

Hey,

I see 1.0e+2% instead of correct percentage. The bundle consists of 2 parts, one is < 0.1%, second is 1.0e+2%.

rollup config

/* eslint-disable import/no-extraneous-dependencies */
import replace from 'rollup-plugin-replace'
import resolve from 'rollup-plugin-node-resolve'
import commonjs from 'rollup-plugin-commonjs'
import visualizer from 'rollup-plugin-visualizer'

export default {
  input: 'src/client/main/index.js',
  output: {
    file: 'build/public/js/main.js',
    format: 'iife'
  },
  plugins: [
    replace({
      'process.env.NODE_ENV': JSON.stringify('production')
    }),
    resolve({
      jsnext: true,
      browser: true
    }),
    commonjs(),
    visualizer()
  ]
}

input

import React from 'react'
import ReactDOM from 'react-dom'

ReactDOM.render(
  React.createElement('p', null, 'hey'),
  document.getElementById('main')
)

result

part 1

rv

part 2

rv

package versions

rollup - 1.2.2
rollup-plugin-visualizer - 1.0.0
react - 16.8.3
react-dom - 16.8.3

node - 11.7.0
macOS - 10.13.4

I'd expect to see 100%. I can create a repo with issue if needed :)

styles example file

Thanks for this great plugin, much appreachiated! :)

I've got three .json input files, one for each of my bundles, producing one output file using this line in package.json in my sapper project.

  "scripts": {
  ...
    "edm:visualizer": "./node_modules/.bin/rollup-plugin-visualizer --filename \"./visualizer_stats/edm-bundles.html\" --title \"EDM Bundles\" ./visualizer_stats/server.json ./visualizer_stats/client.json ./visualizer_stats/service-worker.json",
...
  }

Result looks like this
Screen Shot 2019-11-15 at 11 04 22

Now I'd like to style it using the extraStylePath CLI switch in addtion to what I have above.
It would be rather nice to have a template example for such stylesheet to work off rather than starting from scratch. Is there any such example file? Doesn't look like it so far...

My first and foremost desire would be to not have a autogenerated width of currently about 3000px but style it so it scales to the windows width of the browser so I get an overview rather than having to scroll horizontally...

Default text color in 'light' theme too light

Thanks for this plugin!

In recent versions (currently 3.2.2) the default text color (--text-color) in 'light' theme for sunburst template seems to be too light. I realize I could provide my own styles but I'd prefer to just use the colors out of the box!

I have emailed my stats file as clintwood-stats.html

Show total size when hovering center

As it is, when hovering over the center it shows the size of the last ring hovered. Can we make it show the total size when hovering in the center?

Theme Overrides

What is this?

This is a feature request

Description:

It would be awesome if we had the ability to add our own CSS to change the look of the template. We currently use an application where we want to be able to change the look of the diagram and this would be a nice way for us to handle this.

Wasn't sure what the rules around contributions to this project were so I thought it best to raise an issue around this.

Add an 'open' option

Hi,

Will be nice to add an option who start the page in the browser after the generation.

Cheers,

D

Network template feedback

The network template is an excellent idea. It displays complex interdependence with more detail.

This is what is displayed for the project I am working on.
module-graph

It is a little cramped. Would the ability to zoom and adjust the force layout strength be reasonable? It would also be nice to be able to label the nodes and highlight connecting dependents/dependencies when a node is moused over but are less critical.

JS error: "Cannot read property 'length' of undefined"

I'm getting this error in Chrome and Safari:

rollup.visualizer.html:2954 Uncaught TypeError: Cannot read property 'length' of undefined
    at createRainbowColor (rollup.visualizer.html:2954)
    at rollup.visualizer.html:3175
    at rollup.visualizer.html:3322
createRainbowColor @ rollup.visualizer.html:2954
(anonymous) @ rollup.visualizer.html:3175
(anonymous) @ rollup.visualizer.html:3322

Stats HTML file

rollup.config.js:

const postcss = require('rollup-plugin-postcss')
const visualizer = require('rollup-plugin-visualizer')

const path = require('path')
const theme_path = 'public/themes/rtm_hub'
const resolve = (p) => { return path.resolve(theme_path, p) }

module.exports =
  [ { input: resolve('src/video_detail_modal/main.js')
    , output:
      { file: resolve('js/video_detail_modal.js')
      , format: 'cjs' }
    , plugins:
      [ visualizer({filename: resolve('js/rollup.visualizer.html')})
      , postcss
        ({ extensions: ['.css', '.less']
         , extract: resolve('css/components/video_detail_modal.css') })
      ]}]

can't specify directory to file path.

in the filename option currently it is not possible to provide directories as part of file path.
for eg:

...
  plugins: [
   visualizer({
      filename: './deeply/nested/file/index.html',
      ...
]
...

the above is currently not possible.
i made a PR implementing this feature #12

Show gzip and brotli sizes

We are using this tool to optimize parts of the library that are too heavy, it would be great to have a way to use the gzip and/or brotli compressed sizes, so that we can focus on parts of the library that after compression are still too big.

I already encountered a couple cases where I reduced the code of a function, but that didn't reflect in a reduction of the compressed size (but the opposite).

Appears to report pre-tree-shaking total

The visualizer says that the total is 800k, but the actual file that gets produced is 400k. Webpack produces an 800k bundle, so I assume that the difference is tree shaking. Is there any way to fix this?

Support all templates in one file

What is this?

This is a feature request.

Description:

Instead of having to rebuild stats.html for different templates, we can include all visualizer templates in one file:

plugins: [
  visualizer({ template: 'all' })
]

Treemap support: improve bundles relative display

The actual treemap does not allow to compare between all the different bundles:

  • all bundles have the same size,
  • must scroll all the way down to compare all the sizes.

The great point of webpack-bundle-analyzer was to just allow that: all bundles size are comparable and mean something, also everything in the default display, to have a quick grasp of the bundle situation.

TypeError: Cannot read property 'gzip' of undefined

Screen Shot 2020-03-30 at 21 52 21

and that's the section where it throws

  const getAvailableSizeOptions = (options) => {
    const availableSizeProperties = ["renderedLength"];
    if (options.gzip) {
      availableSizeProperties.push("gzipLength");
    }
    if (options.brotli) {
      availableSizeProperties.push("brotliLength");
    }

    return availableSizeProperties;
  };

as well as here

    const availableSizeProperties = getAvailableSizeOptions(options);

Error: EEXIST: file already exists, mkdir '.'

I get this error when including the plugin.

Output:

[!] (Plugin at position 1 plugin) Error: EEXIST: file already exists, mkdir '.'
Error: EEXIST: file already exists, mkdir '.'

npm ERR! code ELIFECYCLE
npm ERR! errno 1
npm ERR! [email protected] build: `rollup -c`
npm ERR! Exit status 1
npm ERR! 
npm ERR! Failed at the [email protected] build script.
npm ERR! This is probably not a problem with npm. There is likely additional logging output above.

npm ERR! A complete log of this run can be found in:
npm ERR!     /Users/pablo/.npm/_logs/2019-06-19T02_11_23_479Z-debug.log

My full rollup config:

import svelte from 'rollup-plugin-svelte';
import babel from 'rollup-plugin-babel';
import resolve from 'rollup-plugin-node-resolve';
import commonjs from 'rollup-plugin-commonjs';
import livereload from 'rollup-plugin-livereload';
import {terser} from 'rollup-plugin-terser';
import visualizer from 'rollup-plugin-visualizer';
import sass from 'rollup-plugin-sass';
import autoprefixer from 'autoprefixer';
import cssnano from 'cssnano';
import postcss from 'postcss';

const production = !process.env.ROLLUP_WATCH;

export default {
    input: 'src/main.js',
    output: {
        sourcemap: true,
        format: 'iife',
        name: 'app',
        file: 'public/bundle.js'
    },
    plugins: [
        sass({
            output: 'public/bundle.global.css',
            processor: css => postcss([autoprefixer, cssnano({
                preset: ['default', {
                    discardComments: {
                        removeAll: true,
                    },
                }]
            })])
                .process(css)
                .then(result => result.css)
        }),
        svelte({
            // enable run-time checks when not in production
            dev: !production,
            // we'll extract any component CSS out into
            // a separate file โ€” better for performance
            css: css => {
                css.write('public/bundle.css');
            }
        }),
        babel(),
        // If you have external dependencies installed from
        // npm, you'll most likely need these plugins. In
        // some cases you'll need additional configuration โ€”
        // consult the documentation for details:
        // https://github.com/rollup/rollup-plugin-commonjs
        resolve(),
        commonjs(),

        // Watch the `public` directory and refresh the
        // browser on changes when not in production
        !production && livereload('public'),

        // If we're building for production (npm run build
        // instead of npm run dev), minify
        production && terser(),
        visualizer({
            filename: 'stats.html',
            open: true
        }),
    ]
};

Thanks for the help

Breaks with Rollup v0.60

Hey!

Our CI deployments are failing (or rather, the Greenkeeper PR upgrading Rollup to v0.60), because this plugin is not compatible anymore.

This line is the issue, bundle.modules isn't defined in v0.60 anymore.

bundle.modules.forEach(module => {

Fails to work with some plugins

I tried to use this pretty useful plugin with latest rollup (=0.67), but it fails to work:

[!] (Plugin at pos 8 plugin) TypeError: Cannot convert undefined or null to object
TypeError: Cannot convert undefined or null to object
    at Function.keys (<anonymous>)
    at buildTree (.../node_modules/rollup-plugin-visualizer/plugin.js:78:10)
    at Promise.resolve.then.then (.../node_modules/rollup-plugin-visualizer/plugin.js:53:26)
    at <anonymous>
    at process._tickCallback (internal/process/next_tick.js:188:7)

Network graph could display size reduction

Currently network graph clearly shows excluded modules. It would be nice to show original size/size reduction of every file. Maybe show to circles - bigger one with white background and centered one more colored with actual size.
Need to take a look on perfomance as number of circles will be increased twice.

Feature: generate svg server side

Not sure if i should spend time on this.
All the data is available offline, but i am currently using d3-selection, which require full DOM.

It is possible in theory to use jsdom to generate all nodes.

There are not too much benefit actually - i see only smaller size of stat.html in theory

show all project bundles in one coherent graph rather than one graph per bundle

Hi,

I'm doing a svelte/sapper project where I have three section (client, server, service worker). If I add visualizer it only creates stats for the last one (service worker) and not a combined view on my entire project including client, server and service worker sections. Here's my rollup config
https://gist.github.com/1af34bfab3b692cabbeb923bf80b2d9b

As can be seen from lines 107, 162 and 197 it's added to all sections but only results of line 192 are shown.

What do I need to do in order to see the entirety of my project in one graph?

Try to use preact

It looks like d3-selection has similar size to preact. So i can still use d3 for computation and layout and generate SVG with preact

Error with rollup 0.41.4

Hi,
unfortunatly this doesn't seem to work with the stated version of rollup. I get the error:

Unexpected token {

Documentation - how to use??

A clear and concise description of what you want to happen.

I want to know how to use the visualizer. I installed it with npm as explained but then there are not so much more information.

The usage section has some code but it does not really say where to put that code (though it looks like a rollup.config.js?)

And then those options, how do you set them? Basically some code examples or screencast would be great.

Recommend Projects

  • React photo React

    A declarative, efficient, and flexible JavaScript library for building user interfaces.

  • Vue.js photo Vue.js

    ๐Ÿ–– Vue.js is a progressive, incrementally-adoptable JavaScript framework for building UI on the web.

  • Typescript photo Typescript

    TypeScript is a superset of JavaScript that compiles to clean JavaScript output.

  • TensorFlow photo TensorFlow

    An Open Source Machine Learning Framework for Everyone

  • Django photo Django

    The Web framework for perfectionists with deadlines.

  • D3 photo D3

    Bring data to life with SVG, Canvas and HTML. ๐Ÿ“Š๐Ÿ“ˆ๐ŸŽ‰

Recommend Topics

  • javascript

    JavaScript (JS) is a lightweight interpreted programming language with first-class functions.

  • web

    Some thing interesting about web. New door for the world.

  • server

    A server is a program made to process requests and deliver data to clients.

  • Machine learning

    Machine learning is a way of modeling and interpreting data that allows a piece of software to respond intelligently.

  • Game

    Some thing interesting about game, make everyone happy.

Recommend Org

  • Facebook photo Facebook

    We are working to build community through open source technology. NB: members must have two-factor auth.

  • Microsoft photo Microsoft

    Open source projects and samples from Microsoft.

  • Google photo Google

    Google โค๏ธ Open Source for everyone.

  • D3 photo D3

    Data-Driven Documents codes.