Giter Site home page Giter Site logo

cartodb / carto-vl Goto Github PK

View Code? Open in Web Editor NEW
128.0 36.0 27.0 61.92 MB

CARTO VL: a Javascript library to create vector-based visualizations

License: BSD 3-Clause "New" or "Revised" License

JavaScript 86.17% HTML 8.90% Shell 0.93% Smarty 0.12% GLSL 0.83% Dockerfile 0.05% PLpgSQL 3.01%

carto-vl's Introduction

CARTO VL

CircleCI

CARTO VL is an open source JavaScript library for developers to create vector-based visualizations inside Location Intelligence applications.

Features

  • Maps are rendered client-side, instead of being rendered on the server. As a result, we provide faster load times and overall app performance by eliminating potential server problems.
  • Built-in smart point aggregations and geometry simplifications making it easier than ever to visualize and interact with larger datasets. CARTO VL does this in a dynamic and automatic way, meaning you don’t need to rerun costly and time-expensive pre-processing steps over the geometry.
  • Ability to modify geometries directly in the browser. This is a powerful solution for animated visualizations of points, lines, and polygons.
  • Full control over everything happening on the map and can provide rich reactions to user interactions.
  • New and intuitive map styling language that is designed specifically for multi-scale, thematic cartography. With just a few lines, complex visualizations can be created. Non-programmers can create their first map easily, while programmers will still be able to exploit the full potential of the CARTO ecosystem.

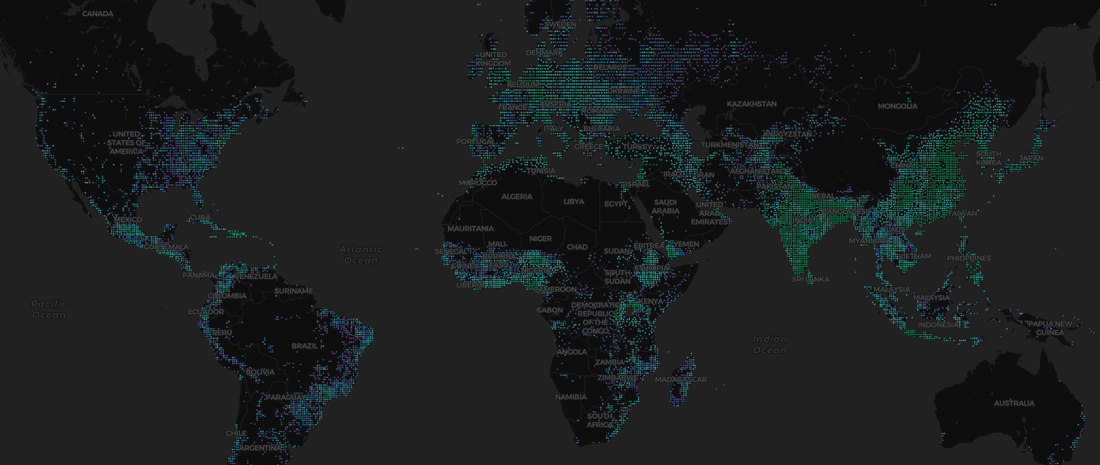
Example

Run this

width: 8
color: ramp(buckets($dn, [80, 100, 140]), prism)
strokeWidth: 0
filter: $dn > 60

To see

I want to make a map

To start, you will need a basic HTML file structure to display your map in a browser. We recommend you to follow this Getting started guide to create a basic map. Then, you can get familiarized with the rest of the library following this link: https://carto.com/developers/carto-vl/guides/introduction/, which includes a list with more specific and advanced guides.

Also, take a look at our examples to understand the possibilities and inspire you!

An alternative way, if you already have a build system in your project (webpack, rollup...), is to use our npm package. You can install it with:

npm i @carto/carto-vl

Take a look at an example made with webpack here.

Happy mapping!

I want to contribute to CARTO VL

That's great! We are more than happy to receive your contributions to the code and its documentation.

Install

To clone and run this library, you'll need Git and Node.js (which comes with npm) installed on your computer. From your command line:

# Clone this repository
$ git clone https://github.com/CartoDB/carto-vl

# Go into the repository
$ cd carto-vl

# Install dependencies (node >=6.11.5 is required)
$ yarn

# Bundle the library
$ yarn build

For more information, please read DEVELOPERS.md.

Start developing

Get started using CARTO VL's documentation at CARTO's Developer Center.

Play with the examples

You can find all the examples on the documentation in the examples folder. There are also some developer focused examples on the debug folder.

Run the following commands to access them locally:

# Bundle the library with a watch dog
$ yarn build:watch

# Run a server
$ yarn serve

Contributing

Lastly, check out CONTRIBUTING.md for more information about submitting pull requests to us. You will need to sign a Contributor License Agreement (CLA) before making a submission. Learn more here.

Feedback

We encourage you to start playing with CARTO VL and to please send us feedback so we can create an even better library, suited to your needs.

Works with

CARTO VL is a geo-spatial data visualization library. However it doesn't include basemap rendering capabilities. Therefore, CARTO VL needs to be used with Mapbox GL as a basemap provider. You'll need to use Mapbox GL (>=v.0.50.0) for controlling the center and zoom level of your map too. The integration is seamless, check the examples!

Versioning

We use SemVer for versioning. For the versions available, see the tags on this repository.

Authors

License

This project is licensed under the BSD 3-clause "New" or "Revised" License - see the LICENSE file for details.

BrowserStack

BrowserStack supports this OpenSource project, providing us with valuable tools to test CARTO VL over different systems and browsers configurations.

BrowserStack Logo

carto-vl's People

Contributors

albertoac avatar antoniocarlon avatar csubira avatar dependabot[bot] avatar dgaubert avatar elenatorro avatar ethervoid avatar iagolast avatar jesus89 avatar jesusbotella avatar jgoizueta avatar jsanz avatar makella avatar neokore avatar piensaenpixel avatar pramsey avatar ramiroaznar avatar rjimenezda avatar rochoa avatar victorvelarde avatar

Stargazers

 avatar  avatar  avatar  avatar  avatar  avatar  avatar  avatar  avatar  avatar  avatar  avatar  avatar  avatar  avatar  avatar  avatar  avatar  avatar  avatar  avatar  avatar  avatar  avatar  avatar  avatar  avatar  avatar  avatar  avatar  avatar  avatar  avatar  avatar  avatar  avatar  avatar  avatar  avatar  avatar  avatar  avatar  avatar  avatar  avatar  avatar  avatar  avatar  avatar  avatar  avatar  avatar  avatar  avatar  avatar  avatar  avatar  avatar  avatar  avatar  avatar  avatar  avatar  avatar  avatar  avatar  avatar  avatar  avatar  avatar  avatar  avatar  avatar  avatar  avatar  avatar  avatar  avatar  avatar  avatar  avatar  avatar  avatar  avatar  avatar  avatar  avatar  avatar  avatar  avatar  avatar  avatar  avatar  avatar  avatar  avatar  avatar  avatar  avatar  avatar

Watchers

 avatar  avatar  avatar  avatar  avatar  avatar  avatar  avatar  avatar  avatar  avatar  avatar  avatar  avatar  avatar  avatar  avatar  avatar  avatar  avatar  avatar  avatar  avatar  avatar  avatar  avatar  avatar  avatar  avatar  avatar  avatar  avatar  avatar  avatar  avatar  avatar

carto-vl's Issues

Polygon rendering artifacts

Fire a map-loaded event

It would be nice to have a mechanism to know when the map is fully loaded.

  • Discuss public api
  • Implement this new api.

Setup Travis

  • Add a .travis.yml file
  • Setup this project in Travis

NOTE: this project is private. We need to take this into account for Travis.

Set up library distribution

[UPDATED 2018-10-01]

Discussion

  • Decide on versioning schema (eg. 0.0.0-beta-x)
  • What to do with mapbox-gl? (#242)
  • Setup distribution / polyfills for the supported browsers (babel-env)

Tasks

  • Create a npm package@carto/cartovl
  • Transpiling.
  • Polyfills (after discussing we are not adding polyfills for now)

We are ready to go now.

Style properties

Meta-issue for different geometry types and supported style properties:

Note: Each style property for points, lines, and polygons geometry types should have their own example.

Line rendering artifacts

Lines style properties

Minimum properties to support for line geometries:

  • Width.
    • Example.
  • Fill-color.
    • Example.
  • Fill-opacity — do we want to separate fill from stroke opacity?
    • Example.

Nice to have:

  • Stroke?

Known issues:

cc @makella

Basic API definition

Although there is some initial work on the public API in https://docs.google.com/document/d/1ZewIIQ49qbIB1cEwuWh615JCNZi13uJl0OXR1QLNS7w/edit, we need to define the API for, at least, the following components:

(Edit: @Jesus89)

  • Source + unit tests + docs
  • Style + unit tests + docs
  • Layer + unit tests + docs
  • Defaults: Auth and config (API endpoint, etc) + unit tests + docs
  • Add CartoErrors (error handling) + docs

Also, this should define how we are gonna test the API.

  • Define how we test input data in public API.
  • What library we are gonna use for those tests.

Define and document an end-user API

Right now, the styling API is relatively mature, but other parts of the API are just a WIP.

The API should take, at least, into account:

  • Sources (dataset, SQL)
  • Layers
  • Style as a set of styling root expressions
  • Interactivity: getFeatureBehindCursor, getFeaturesInBBox, getFeaturesInViewport, change style for one or more particular features, eg: feature.style.color.blendTo(R.rgba(0,0,0,0.5)

rgba values should be 0-255 vs. current 0-1

Add support for classification methods

Add support for:
Viewport:

  • quantiles
  • equalIntervals
  • std
  • jenks (it can be a similar clustering algorithm)

Global:

  • quantiles
  • equalIntervals
  • std
  • jenks (it can be a similar clustering algorithm)

For geometry types:

  • points
  • polygons
  • lines
    NOTE: some of these items may not be critical, and they are very related to each other.

Timestamps: proper support for temporal maps (client-side)

Right now the only supported data types are numbers and categories in the form of strings.

We need to support timestamps and give the proper Date/Time utils to work with them.

The WWI_Ships example is a good starting point since it is working thanks to a column which is the number of days since 1917 instead of using the timestamp column.

We need to define the syntax/style API first.

I imagine something like:
torque($date, from: '15/01/1917', to: '1/01/1922', speed: '15 days'/'1 second', range: '10 days', trail: '10 days')

Where from and to are the start and end timestamps (should be optional, by default it should take the minimum and maximum timestamps of the dataset),
speed is the simulated time that passes each real-time second of the simulation, in this case 15 days per second,
range is the time duration in which the input is considered active (i.e. temporalSimulation returns 1),
trail is the time duration in which the input is considered semiactive (i.e. temporalSimulation returns a number greater than 0 and less than 1).

The output of this function is (regarding the input $date) is:

Output
 ^
|1.66|
|1.33|
|1.0 |        ______
|0.66|       /      \
|0.33|      /        \
|0.0 | ____/          \____
=================================> Time

Note:
I've used named arguments, IMO this improves clarity, but we haven't implemented this yet.

support for "flipping" the color scheme

This is for when people use a dark map vs. a light map and sequential color schemes.

With a dark map, many times it is preferable to have the light = more to bring out contrast against the dark background whereas on a light map, light = less.

Is there something we can do to support this in the renderer?

This functionality is available in Builder forms but not a part of TurboCarto syntax. If a user clicks the arrow to flip, TC literally reads the scheme colors in backwards and that's how the hex values are listed in the CartoCSS.

flip-ramp

Points style properties

Minimum properties to support for point geometries:

  • Size/width.
    • Example.
  • Fill-color.
    • Example.
  • Fill-opacity — do we want to separate fill from stroke opacity?
    • Example.
  • Stroke-size.
    • Example.
  • Stroke-color.
    • Example.

Nice to have:

  • Stroke-opacity?
  • Size-height?

cc @makella

Support multiple layers in Core Dataframe API

The current Dataframe that is used between the data layer and the core is not well defined nor documented.

Moreover, it hasn't been designed with multi-layer setups in mind, we need to support multiple layers.

Add support for polygon stroke

We need to support polygon strokes. We should reuse the current point stroke style API: strokeColor and strokeWidth properties.

Define lib compatibility

Manual QA testing for 18th April version:

  • Browsers support
    • Chrome
    • Firefox
  • Platforms
  • Windows: Nvidia, AMD, Intel.
  • Mac: AMD, Intel.
  • Linux: Intel, Nvidia.
  • Acceptance criteria: manual testing of all acceptance tests.

Public version, date TBA:

  • Browsers
    • Safari
    • Opera
    • Edge
    • IE
  • Mobile
  • TBD

Support for additional basemaps in demo

@dv343

As discussed, in the renderer interface that I'm using, would it be possible to add the additional CARTO basemaps?

Dark Matter: labels under, no labels
Positron: labels on top, labels under, no labels
Voyager: labels on top, labels under, no labels

thanks!

Ramp: unexpected results

After talking with @makella it's been clear that ramp() applies the cartocolor palettes in an "unexpected" way.

I would like confirmation about how this should be managed before implementing it. I think there are multiple issues with ramp() so I'm just gonna propose the future behavior.

Forgive me for the programmer-like way of asking this but I hope it's the clearest way to define the expected behavior.

if palette is cartocolor then
          if input contains "others" bucket  then
                 apply cartocolor subscheme
          else if input doesn't contain ''others" bucket then
                  if cartocolor has "qualitative" tag then
                         apply cartocolor subscheme with one extra bucket to ignore the last bucket
                  else if cartocolor doesn't have "qualitative" tag then
                        apply cartocolor subscheme

if input is numeric then
     activate linear interpolation between colors, taking the cartocolor with most buckets
else if input is category then
      don't activate linear interpolation between colors

Acceptance tests

Acceptance tests:

  • Add script to get screenshot references from the examples
  • Define the acceptance tests
  • Implement acceptance testing framework
  • Move examples to +acceptance folder
  • Custom simple datasets in the cartogl user.
  • Check metrics
  • Backport to node 6

Polygons style properties

Minimum properties to support for point geometries:

  • Fill-color.
    • Example.
  • Fill-opacity — do we want to separate fill from stroke opacity?
    • Example.

Nice to have:

  • Stroke-width.
    • Example.
  • Stroke-color.
    • Example.
  • Stroke-opacity?

This should close #10.

cc @makella

Add linear(input, minKey, maxKey) styling function

Right now we are using ramp(input, palette, minKey, maxKey) for making linear interpolated ramps of numeric inputs. This is not consistent with ramp(buckets(input, breakPoint1, breakPoint2, breakPoint3...), palette).

We've reached the conclusion that we should replace ramp(input, palette, minKey, maxKey) by ramp(linear(input, minKey, maxKey), palette).

However, we already support ramp(input, palette) (minKey and maxKey are set to the minimum and maximum global values of the property if input is a property, this "magic" is not supported when input is not a property). We need to keep support for this.

Improve screenshot testing

Currently our screenshot testing uses a delay to take the screenshots, this means

  1. Open the example
  2. Wait delay time
  3. Take the screenshot

This has several problems:

  • If the delay is too small the map is not loaded and the screenshot is wrong, making the test fail.
  • If the delay is too big we are increasing the total test time.

If the map triggers a loaded event we can listen for this event and take the screenshot instead waiting blindly.

BLOCKED BY : #48

Improve filtering support

Filters are a type of expressions used for removing elements when certain conditions are not met.
Right now, we can filter out features from rendering, but there is no special semantics for it.
In this issue we define the list of available expressions and usage examples.

In order to make the filters easy to use we add a new property filter to the styleSpec object this property will affect the alpha value making elements invisible when the filter predicate is evaluated to false (or 0).

Filtering will be done in the client whenever possible, however there are always cases in which you can not filter in client for example tremendous datasets. For those cases we define a breakpoint when we decide to filter in the server. This is done by the library automatically and the user has no control over it.

Public Api

I like the mongodb operators naming (@iago)

Comparison

  • s.eq: Matches values that are equal to a specified value.
  • s.ne: Matches values that are not equal to a specified value.
  • s.gt: Matches values that are greater than a specified value.
  • s.gte: Matches values that are greater than or equal to a specified value.
  • s.lt: Matches values that are less than a specified value.
  • s.lte: Matches values that are less or equal to a specified value.
  • s.in: Matches any value in the given list. *
  • s.nin: Matches any value in not the given list. *
  • s.between: Matches numerical values betweeen the given numbers (limits included) *

*This filters are the only allowed in server side filtering mode.

Logical

  • s.TRUE: Evaluates to true
  • s.FALSE: Evaluates to false
  • s.and: Perform a logical and between the parameters.
  • s.or: Perform a logical or between the parameters.
  • s.not: Inverts the Boolean predicate

Use cases

Filter populated places dataset, show only very populated places.

const $population = s.property('pop_max');
const style = new carto.Style({
  filter: s.gt($population, 1000000)
});

TODO

  • Define public API.

  • Define and implement a naive use-case.

  • Review which expressions can be filtered in the server.

  • Implement all filters in the list with use cases/examples

  • Fix cache bug: One cache per shader

  • Define client/server breakpoint (when we should try to render in the server).

  • Implement a method to delegate filtering to the server

Add local and global maximum, minimum and average value functions

Add: globalMax(), globalMin(), globalAvg(), viewportMax(), viewportMin() and viewportAvg()

And globalPercentile($property, 99) and viewportPercentile(....)

All functions are done, but viewport ones only work with points and global ones don't take filters into account.

Example: viewportMax($amount) should return the maximum amount present in the current viewport, evaluation of the function should be done automatically by the Core Renderer each time the map is panned or zoomed in or out.

How to make a classed bubble map

@davidmanzanares

how would I make a classed bubble map?

Following the syntax for making a classed color map, I was thinking something like:

width: ramp(quantiles($gis_acres,5),5,20) where 5,20 is the symbol size range.

Just One Tile optimization

The WindshaftSQL data provider is using tiling. However, for many, if not most, cases this is unnecessary overhead. We could download all the data just once. To keep things simple I propose to download all the data by requesting the 0/0/0 tile in MVT format with the maximum MVT extent (2^31).

This requires CartoDB/Windshaft-cartodb#843

Guides for beta release

We are going to create multiple placeholders with the contents to be covered:

  • basics
    • what is CARTO VL?
    • what can I do with CARTO VL
    • how authentication works
  • viz
    • what is a viz object ?
      • supported properties
    • styling points
    • styling polygons
    • styling lines
    • colors
    • style by value

cc @inigomedina @IagoLast

Category bucket question/comparison with Builder

@davidmanzanares

Heyyy,
I'm seeing two different results between Builder and the renderer when I symbolize two categories in my data.

With the renderer, I am using buckets to symbolize fires caused by lightning and arson:

width: 5
color: ramp(buckets($cause_descrip,"Lightning","Arson"),Prism)

result

In Builder, I'm doing the same with TurboCARTO:

  marker-fill: ramp([cause_descrip], (#5F4690, #f28423,rgba(50,50,50,0.8)), ("Lightning","Arson"), "=");

result

As you can see, I'm getting two different results... any ideas why?

thanks!

API for interactivity

The goal of this issue is to define and implement the carto-vl interactivity system.

We need to provide an api to define the ways in which the user interacts with the map.

  • click: The user clicks/touches a location on the map.
  • move: The user moves the mouse to a location on the map

As described in the draft we need to provide a way to set up event listeners for those events for every layer displayed on the map.

We must provide a way to know if there is some data in the location where the user interacted.

Events

  • featureClick: when you click on a feature.
  • featureClickOut: when you click out of a feature you clicked in.
  • featureEnter: when your pointer enters a feature.
  • featureHover: when you are moving inside a feature you have entered.
  • featureLeave: when your pointer leaves a feature you entered before.

API

Subscribe to an event

const interactivity = new carto.Interactivity([layer]);
interactivity.on('featureClick', event => {});
interactivity.on('featureClickOut', event => {});
interactivity.on('featureEnter', event => {});
interactivity.on('featureHover', event => {});
interactivity.on('featureLeave', event => {});
const interactivity = new carto.Interactivity([cities, countries]);

interactivity.on('featureClick', event => {
    feature = event.features[0];
    if (feature.layer == 'countries') {
        popupCountries(feature);
    } else {
       popupCities(feature);
    }
});

interactivity.on('featureClickOut', event => {
    popupDisable();    
});

Event Callback

The callback is a function that receives a single FeatureEvent parameter
A FeatureEvent has the following fields:

  • features. Array of features located at the interaction location, each one will have:
    • properties: Multiple data fields
    • id (featureID)
    • layerId (string, MGL)
  • position (in pixels)
  • coordinates (long lat)

TODO

  • Define public api to listen to click events.
  • Define public api to listen to hover events.
  • Define the FeatureEvent object taking into account all the requisites listed in this issue.
  • Define a way to change the feature style (better within the callback)
  • Create unit tests for the public API
  • Create an example: (console.log feature data on feature-click/hover)
  • Define integration tests for this use-case
  • Add public documentation (jsdoc)
  • Implement click event
  • Implement hover event
  • Implement intersection tests: points, polygons and lines
  • Implement variables

TODO (issues)

#197

Draw ordering for points

We should be able to order the features (for drawing) on the client.

Doing it on JS is not a viable option if we want to order by a dynamic property: i.e. it is too slow to reorder per frame.

I would try to do a PoC with a psudo ordering mechanism implemented with WebGL. My idea is to divide the features into buckets and draw each tile one time per bucket and GPU filtering out the features that don't belong to the bucket.

Recommend Projects

  • React photo React

    A declarative, efficient, and flexible JavaScript library for building user interfaces.

  • Vue.js photo Vue.js

    🖖 Vue.js is a progressive, incrementally-adoptable JavaScript framework for building UI on the web.

  • Typescript photo Typescript

    TypeScript is a superset of JavaScript that compiles to clean JavaScript output.

  • TensorFlow photo TensorFlow

    An Open Source Machine Learning Framework for Everyone

  • Django photo Django

    The Web framework for perfectionists with deadlines.

  • D3 photo D3

    Bring data to life with SVG, Canvas and HTML. 📊📈🎉

Recommend Topics

  • javascript

    JavaScript (JS) is a lightweight interpreted programming language with first-class functions.

  • web

    Some thing interesting about web. New door for the world.

  • server

    A server is a program made to process requests and deliver data to clients.

  • Machine learning

    Machine learning is a way of modeling and interpreting data that allows a piece of software to respond intelligently.

  • Game

    Some thing interesting about game, make everyone happy.

Recommend Org

  • Facebook photo Facebook

    We are working to build community through open source technology. NB: members must have two-factor auth.

  • Microsoft photo Microsoft

    Open source projects and samples from Microsoft.

  • Google photo Google

    Google ❤️ Open Source for everyone.

  • D3 photo D3

    Data-Driven Documents codes.