This is the repository used to make the project titled Grass Pollen in Cape Town: A Comparison of Generalised Additive Models and Random Forests by Sky Cope and Chloë Stipinovich. The final paper can be found under the documents folder.
Reliable and accessible pollen forecasts can help allergy sufferers, enabling them to appropriately plan their outdoor activities. In this paper we used generalised additive models (GAMs) and random forests to build seven day ahead grass pollen forecast models, using pollen count data collected at the South African Astronomical Observatory (SAAO) by researchers at the UCT Lung Institute. Variables used to predict pollen levels were primarily meteorological (powered by Visual Crossing Weather), but also included a vegetation index variable (from NASA's MODIS satellite). To make our forecast easier to interpret, our models output probability distributions over five categories of pollen levels, from Very Low to Very High. Further, we created a Shiny app for potentially displaying the results of our forecast on a website.
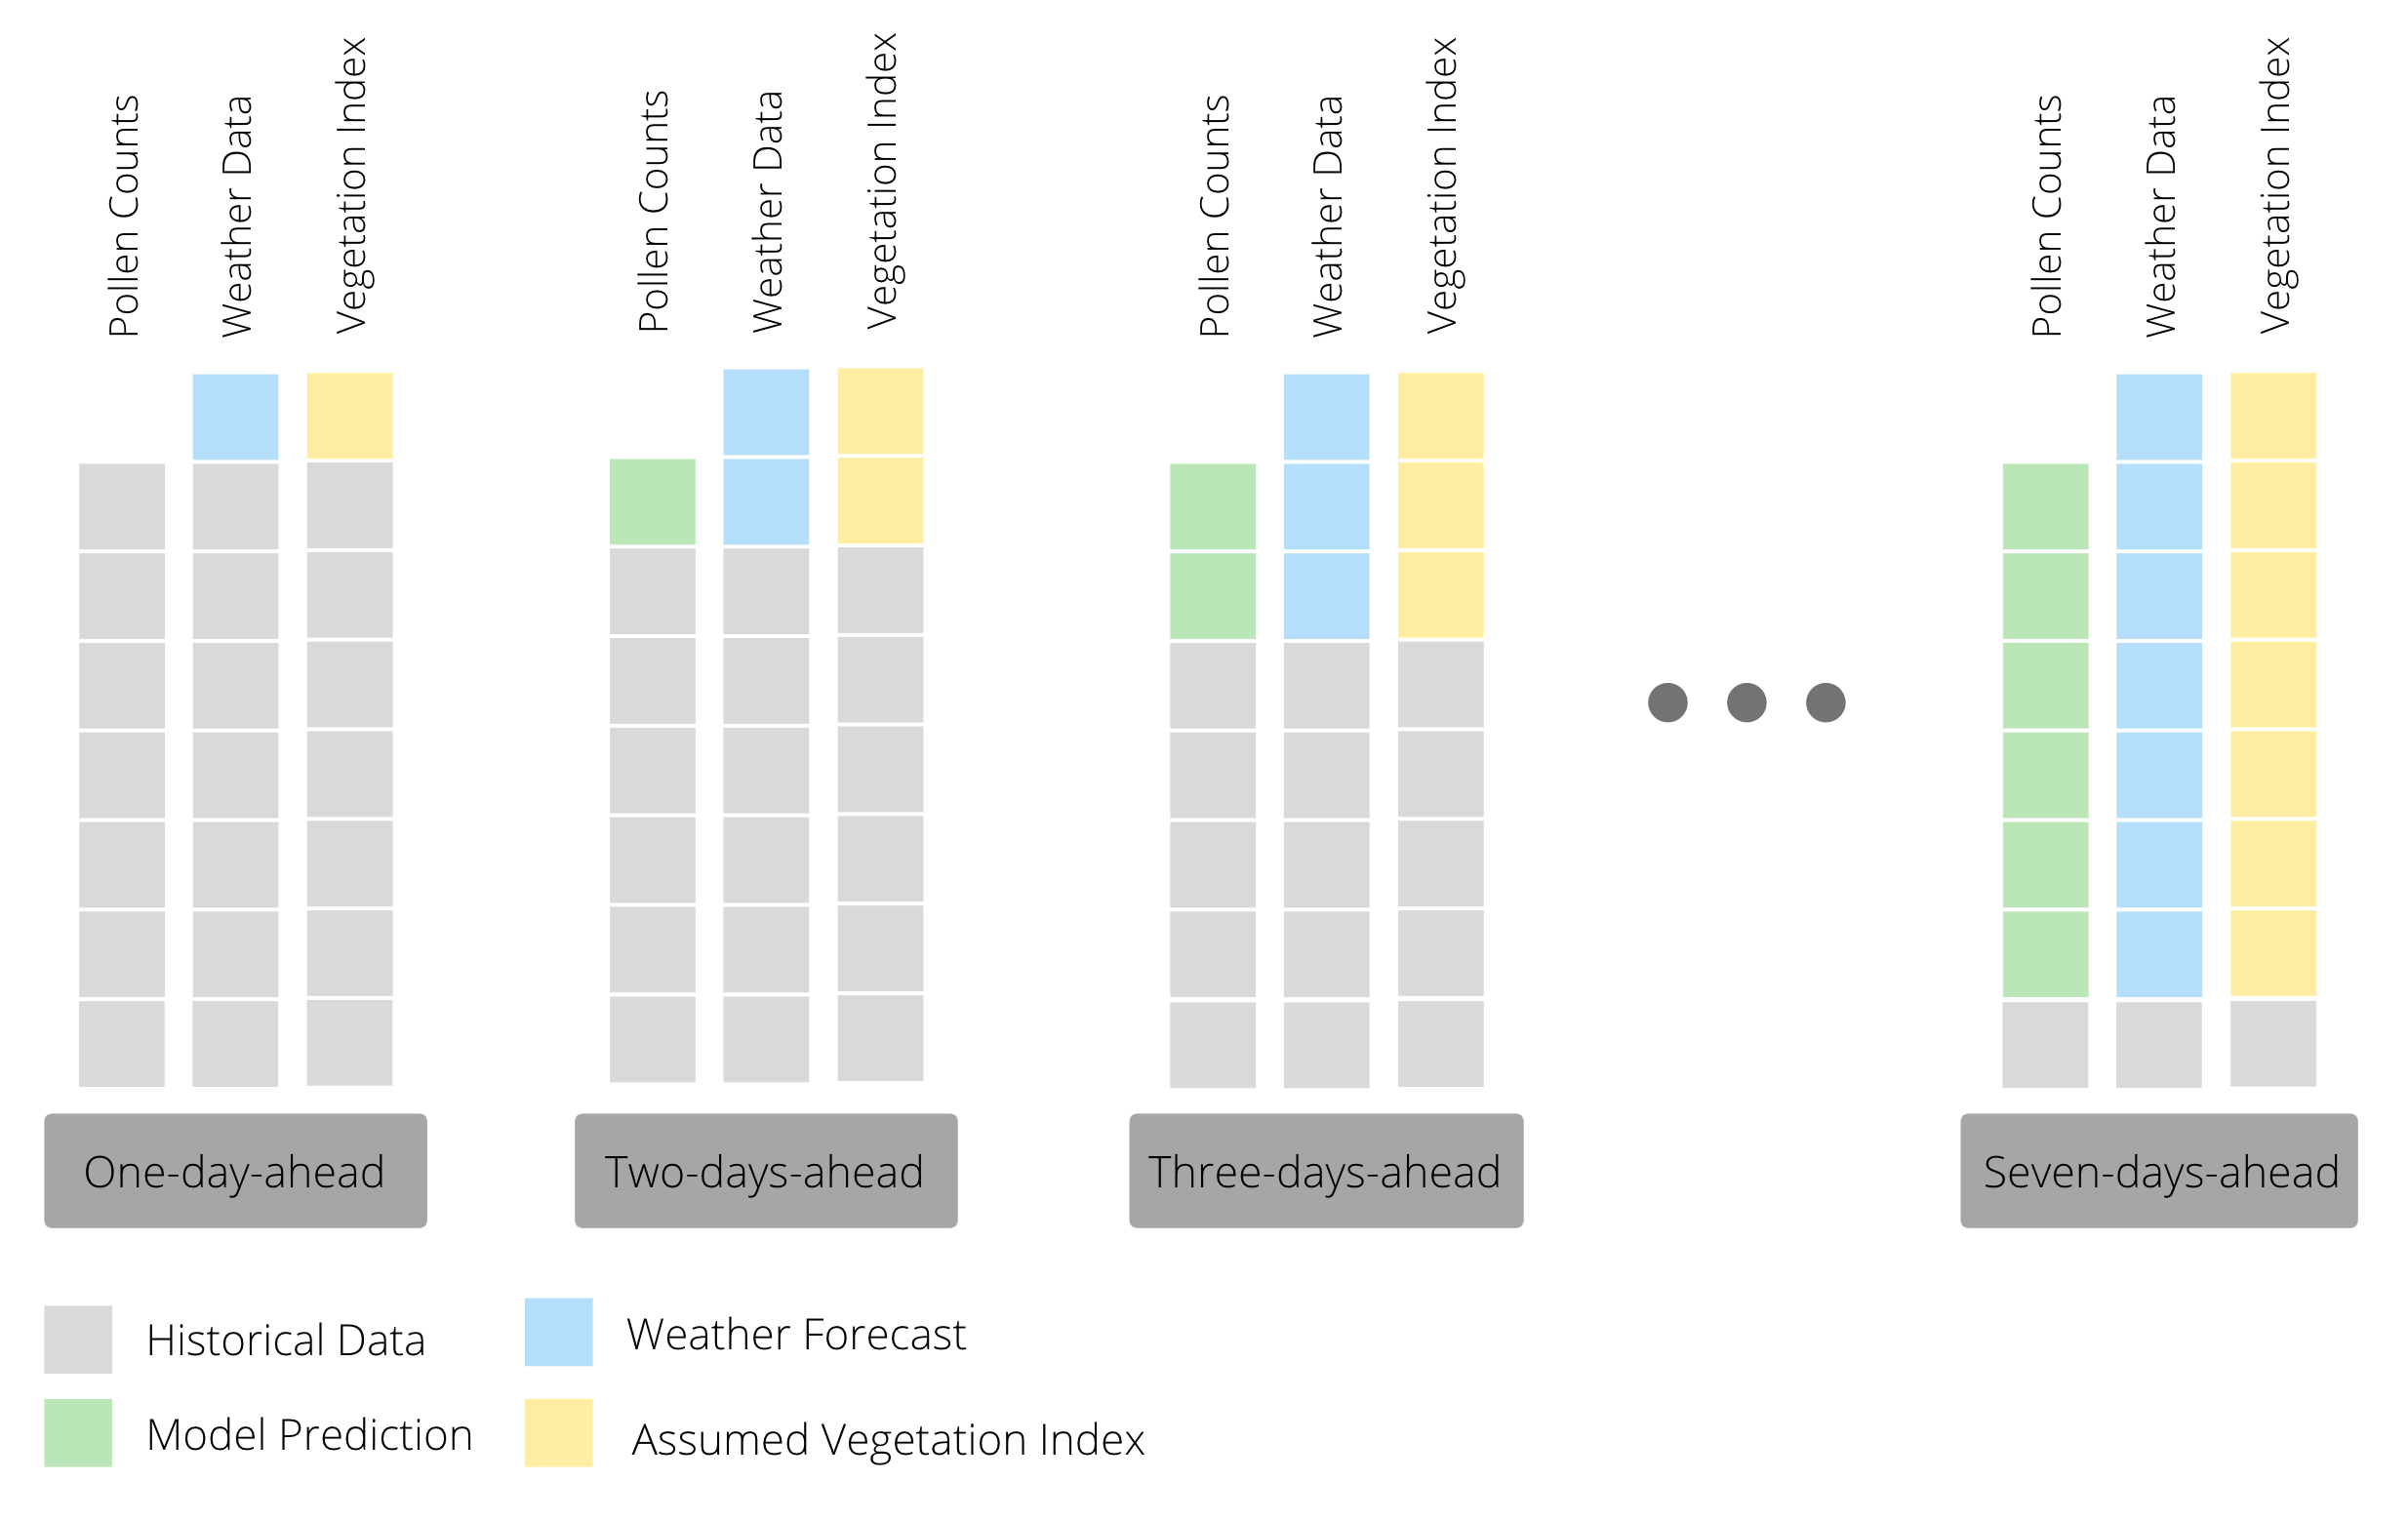
In order to predict pollen concentrations one to seven days ahead, we used a recursive forecasting strategy. This means that we built models to predict one day ahead pollen concentrations and then use that prediction for forecasting the next day’s pollen count. In other words, we have one model that we reuse as we predict further and further out, iteratively replacing observed pollen counts with predicted ones and observed values of weather variables with forecasted ones as seen in the figure below.
Our models predict pollen counts over the next seven days. However, we believe it is more informative to ultimately predict categories rather than counts, since the end user of our forecast is unlikely to be able to interpret a numeric count prediction. Consequently, instead of reporting the numeric count prediction for each day we converted the daily posterior predictive distributions of pollen counts into probability distributions over five categories, from Very Low to Very High. The categories we used are tabulated below.
| Category | Bin |
|---|---|
| Very Low | count < 1 |
| Low | 1 < count < 3 |
| Moderate | 3 < count < 8 |
| High | 8 < count < 14.8 |
| Very High | 14.8 < count |
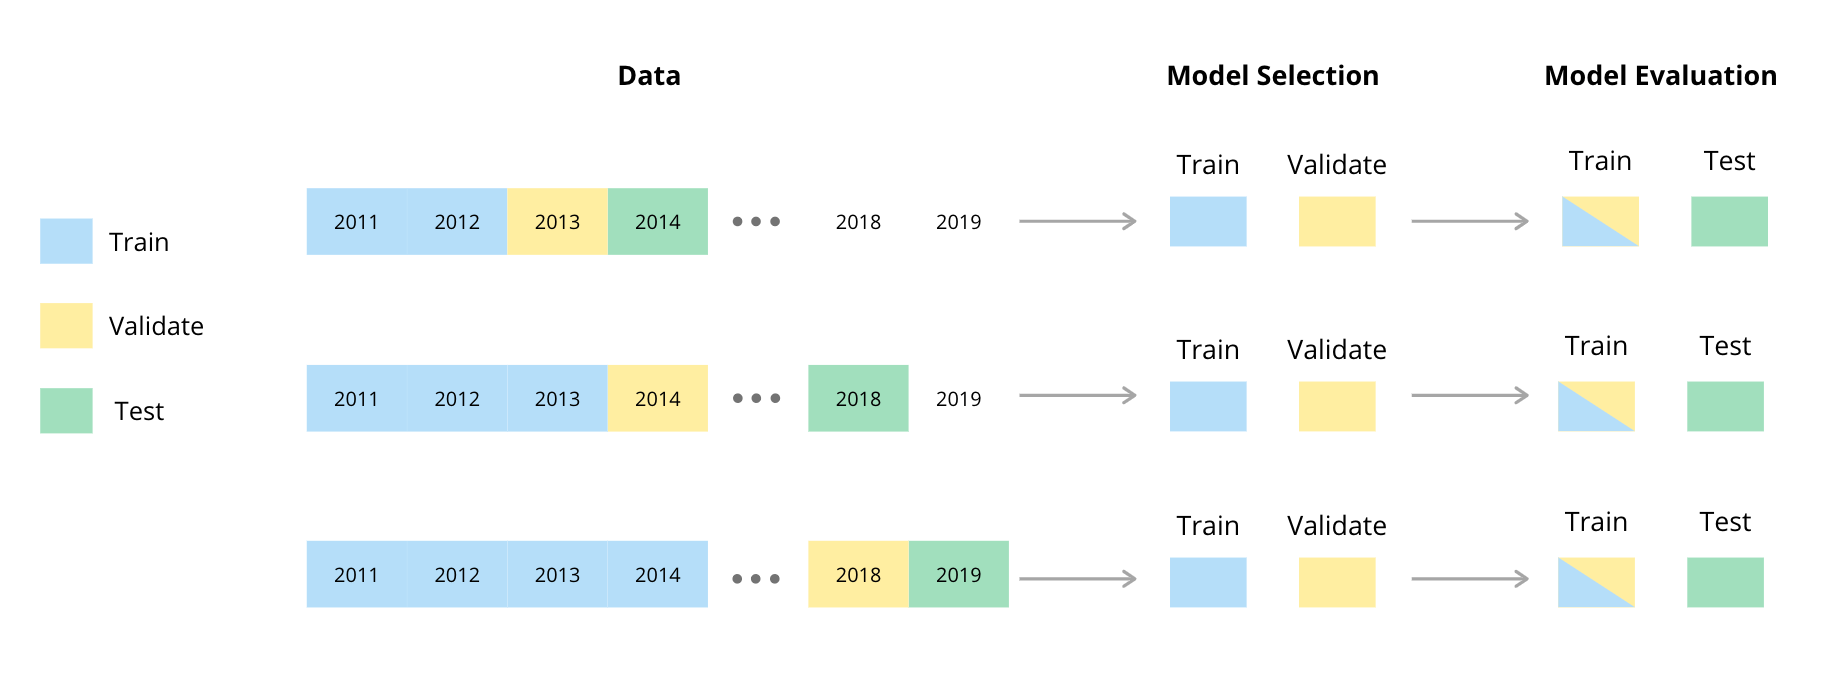
Given temporal dependence between observations in time series data, adaptations of the usual randomised holdout procedures are generally used to test and validate time series models (Cerqueiraetal, 2020). We used a procedure involving a rolling or sliding window for the test, train and validation splits (Tashman, 2000). The method we used is illustrated in the diagram below and has been adapted from a diagram by (Cochrane, 2018).
We originally aimed to make the weekly pollen forecasts available on The Real Pollen Count website. The UCT Lung Institute would have control of the forecast. This means that the forecast would need to be updated on a weekly basis, and it must not require extensive RStudio knowledge on the part of the user. In an ideal world the process would be fully automated: the user would simply need to upload the past week's pollen counts and a workflow would perform the necessary steps to update the website without further need for user intervention. However, we did not manage to develop a fully-automated workflow.
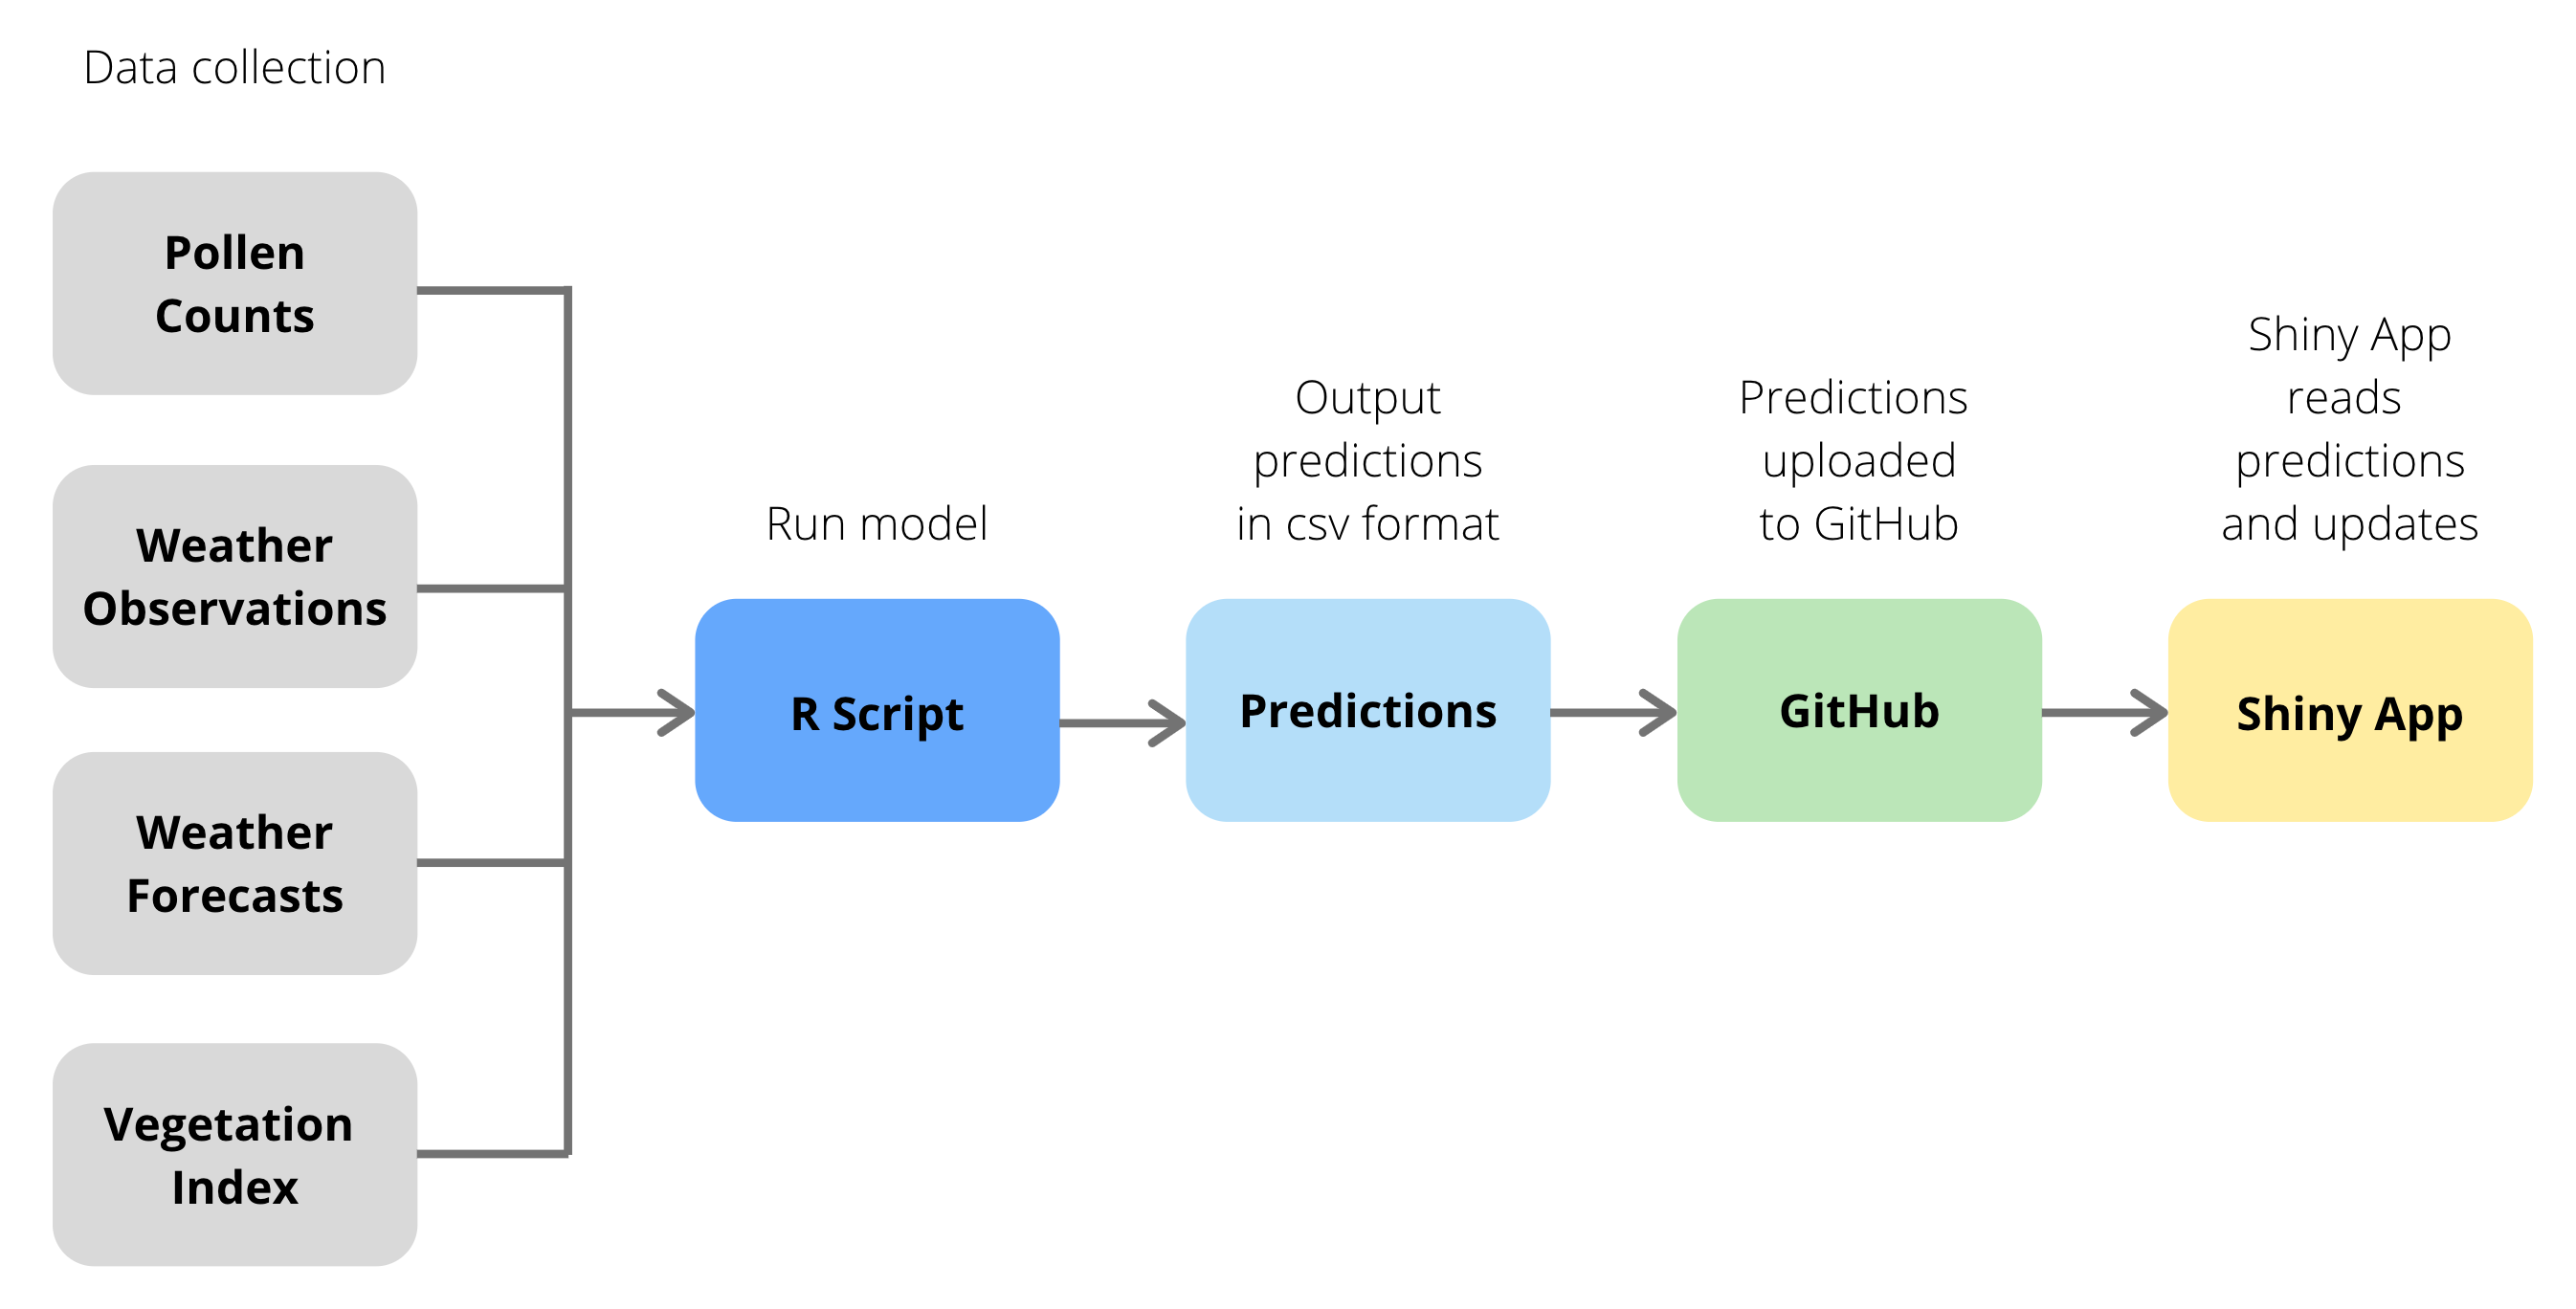
Our semi-automated workflow enables us to use current data to generate a 7-day ahead forecast of pollen counts, and to display this forecast on a website. The basics of the workflow are as follows:
- the data are obtained from four sources using an R script,
- this script uses the data to output a .csv file containing the next seven days of pollen forecasts,
- the .csv file is then uploaded to GitHub, and
- a Shiny app uses the GitHub file to make the forecast available online. These steps are shown using a flowchart:
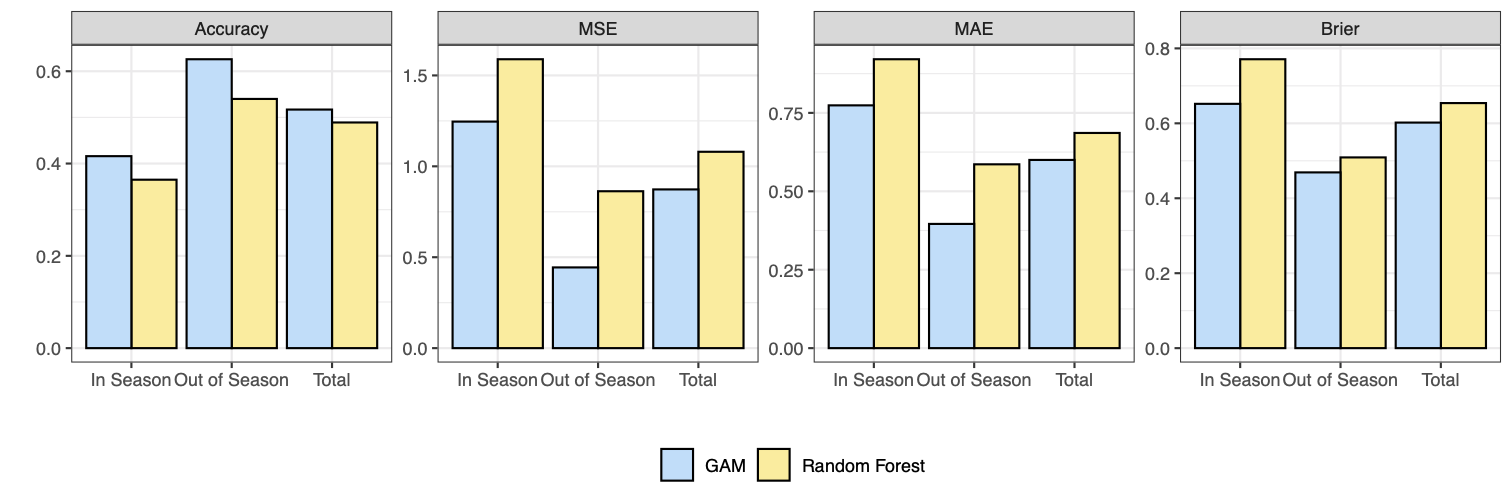
The best performing random forest and GAM on the validation sets are compared and respresented in the figure below. The GAM model outperforms the random forest across all four metrics and in all periods. The GAM achieves a greater classification accuracy, so it predicts the correct category more often than the random forest does. The GAM has a lower MSE and lower MAE and so when the categorical prediction is incorrect, the GAM predicts categories closer to the true category more often than the random forest. The GAM also has a lower Brier score and so is better skilled in its probabilistic forecasting ability in terms of predicting whether or not a category occurred. Importantly, the GAM significantly outperforms the random forest In Season for each of the MSE, MAE and Brier score.
Our next step was to assess whether the best performing GAM was predicting reasonable and helpful results. It was evaluated on the testing years of 2014, 2018 and 2019, and metrics were averaged over these three years. These results are shown in the table below.
| Period | Accuracy | MSE | MAE | Brier |
|---|---|---|---|---|
| In Season | 0.395 | 1.303 | 0.818 | 0.674 |
| Out of Season | 0.636 | 0.462 | 0.393 | 0.463 |
| Total | 0.512 | 0.837 | 0.609 | 0.561 |
This GitHub repository contains the R code used for modelling and testing, as well as the code used to create our Shiny App. GAM_models.R contains our GAM models, as well as the code used to test them. random_forest_functions.R contains the necessary functions required for testing the random forest models, including the models themselves. random_forest.R uses the functions contained in the previous file to generate results for the random forest models. workflow.R contains the functions that are used by our semi-automated workflow. This workflow is contained in workflow.R, which uses the functions in the previous file to fetch the necessary data, generate the forecasted class probabilities and output the forecast as a .csv. Finally, app.R contains the code used by our Shiny App.


