Giter Site home page Giter Site logo

star-charts's Introduction

Star Charts

This Python script will generate SVG star charts, like the ones shown below:

Star Chart showing Orion
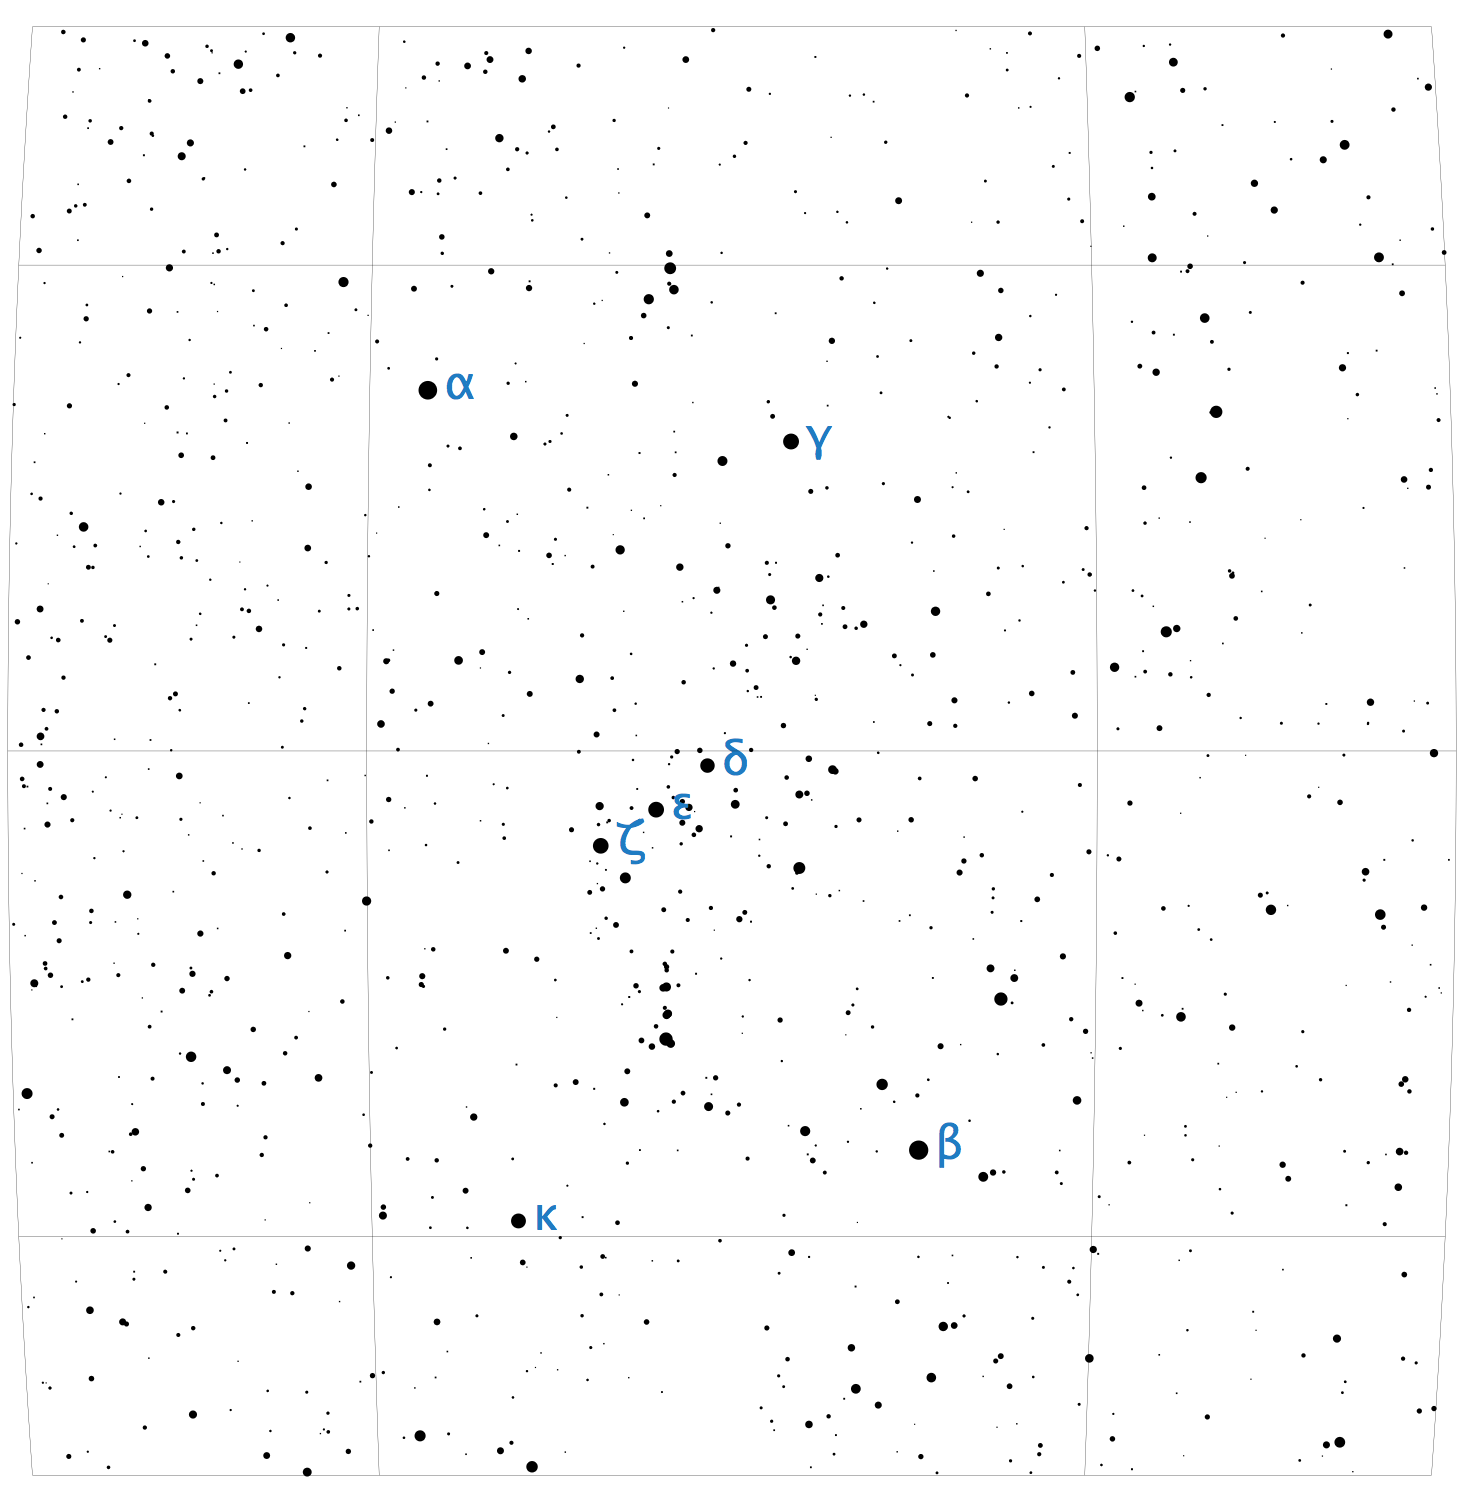
The constellation Orion, showing stars down to magnitude 8 original SVG

The script reads data about the position and brightness of stars from a CSV file like this one. Each row in the CSV file contains information about a single star in 4 columns as follows:

  • Right-Ascension: the star's angular distance eastward from the vernal equinox (0 to 24)
  • Declination: the star's angular distance northward from the celestial equator (-90 to +90)
  • Magnitude: the star's brightness
  • Label: an optional field used to add labels to stars (see the Greek letters in the example chart above)

For example

5.91937636,+76.86957095, 8.07
5.91952477,+07.40703634, 0.45,α
5.92011402,+61.86673905, 8.60
5.92045102,-73.15075170, 7.72

The area to be covered by the chart is specified using a SkyArea object, which must be referenced the main.py file. A few pre-defined areas are included, such as complete northern and southern sky maps:

Star Chart showing the northern sky

Star Chart showing the southern sky

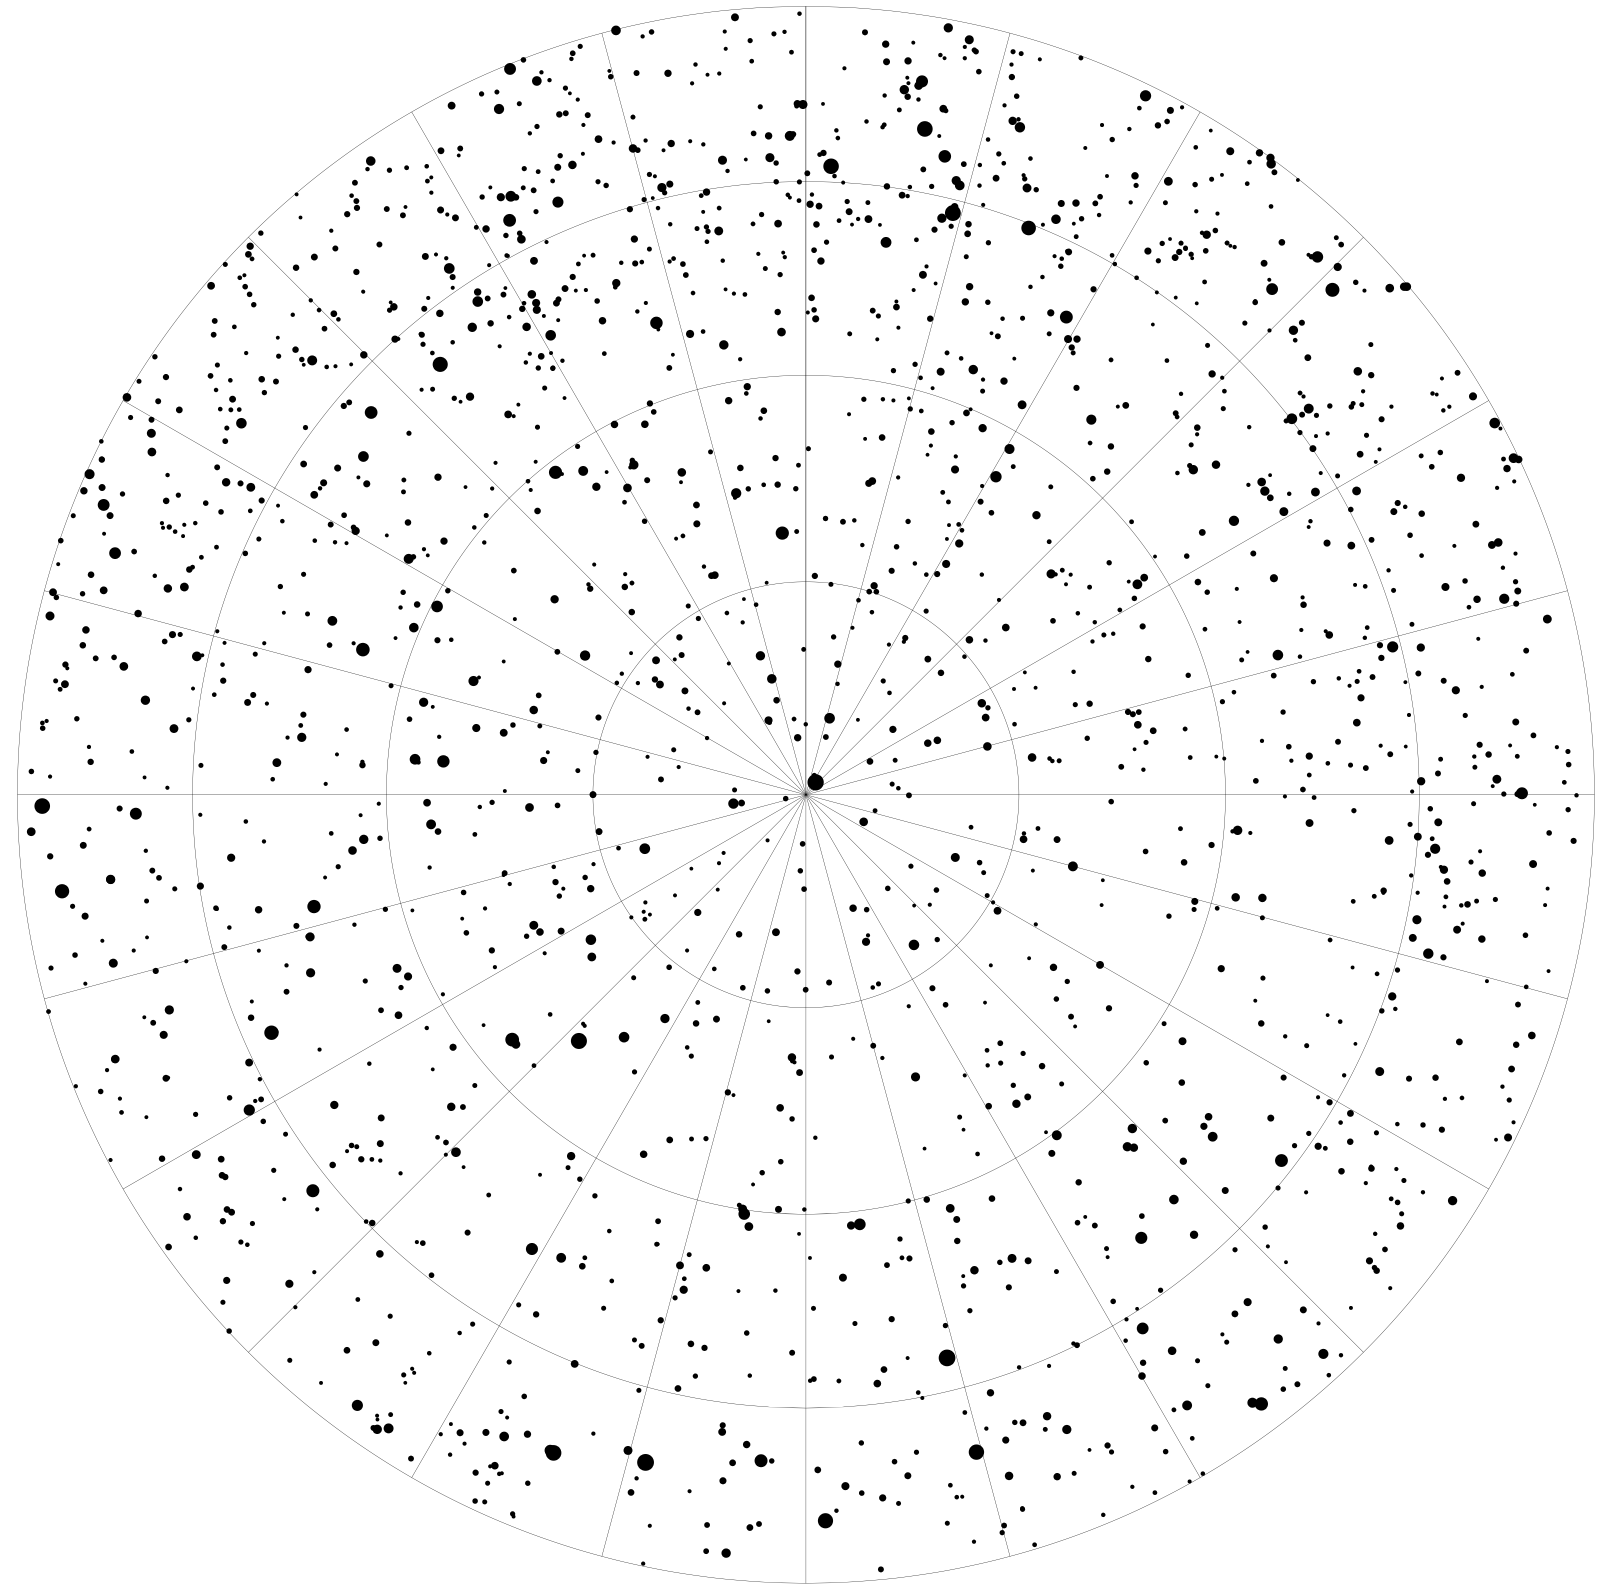
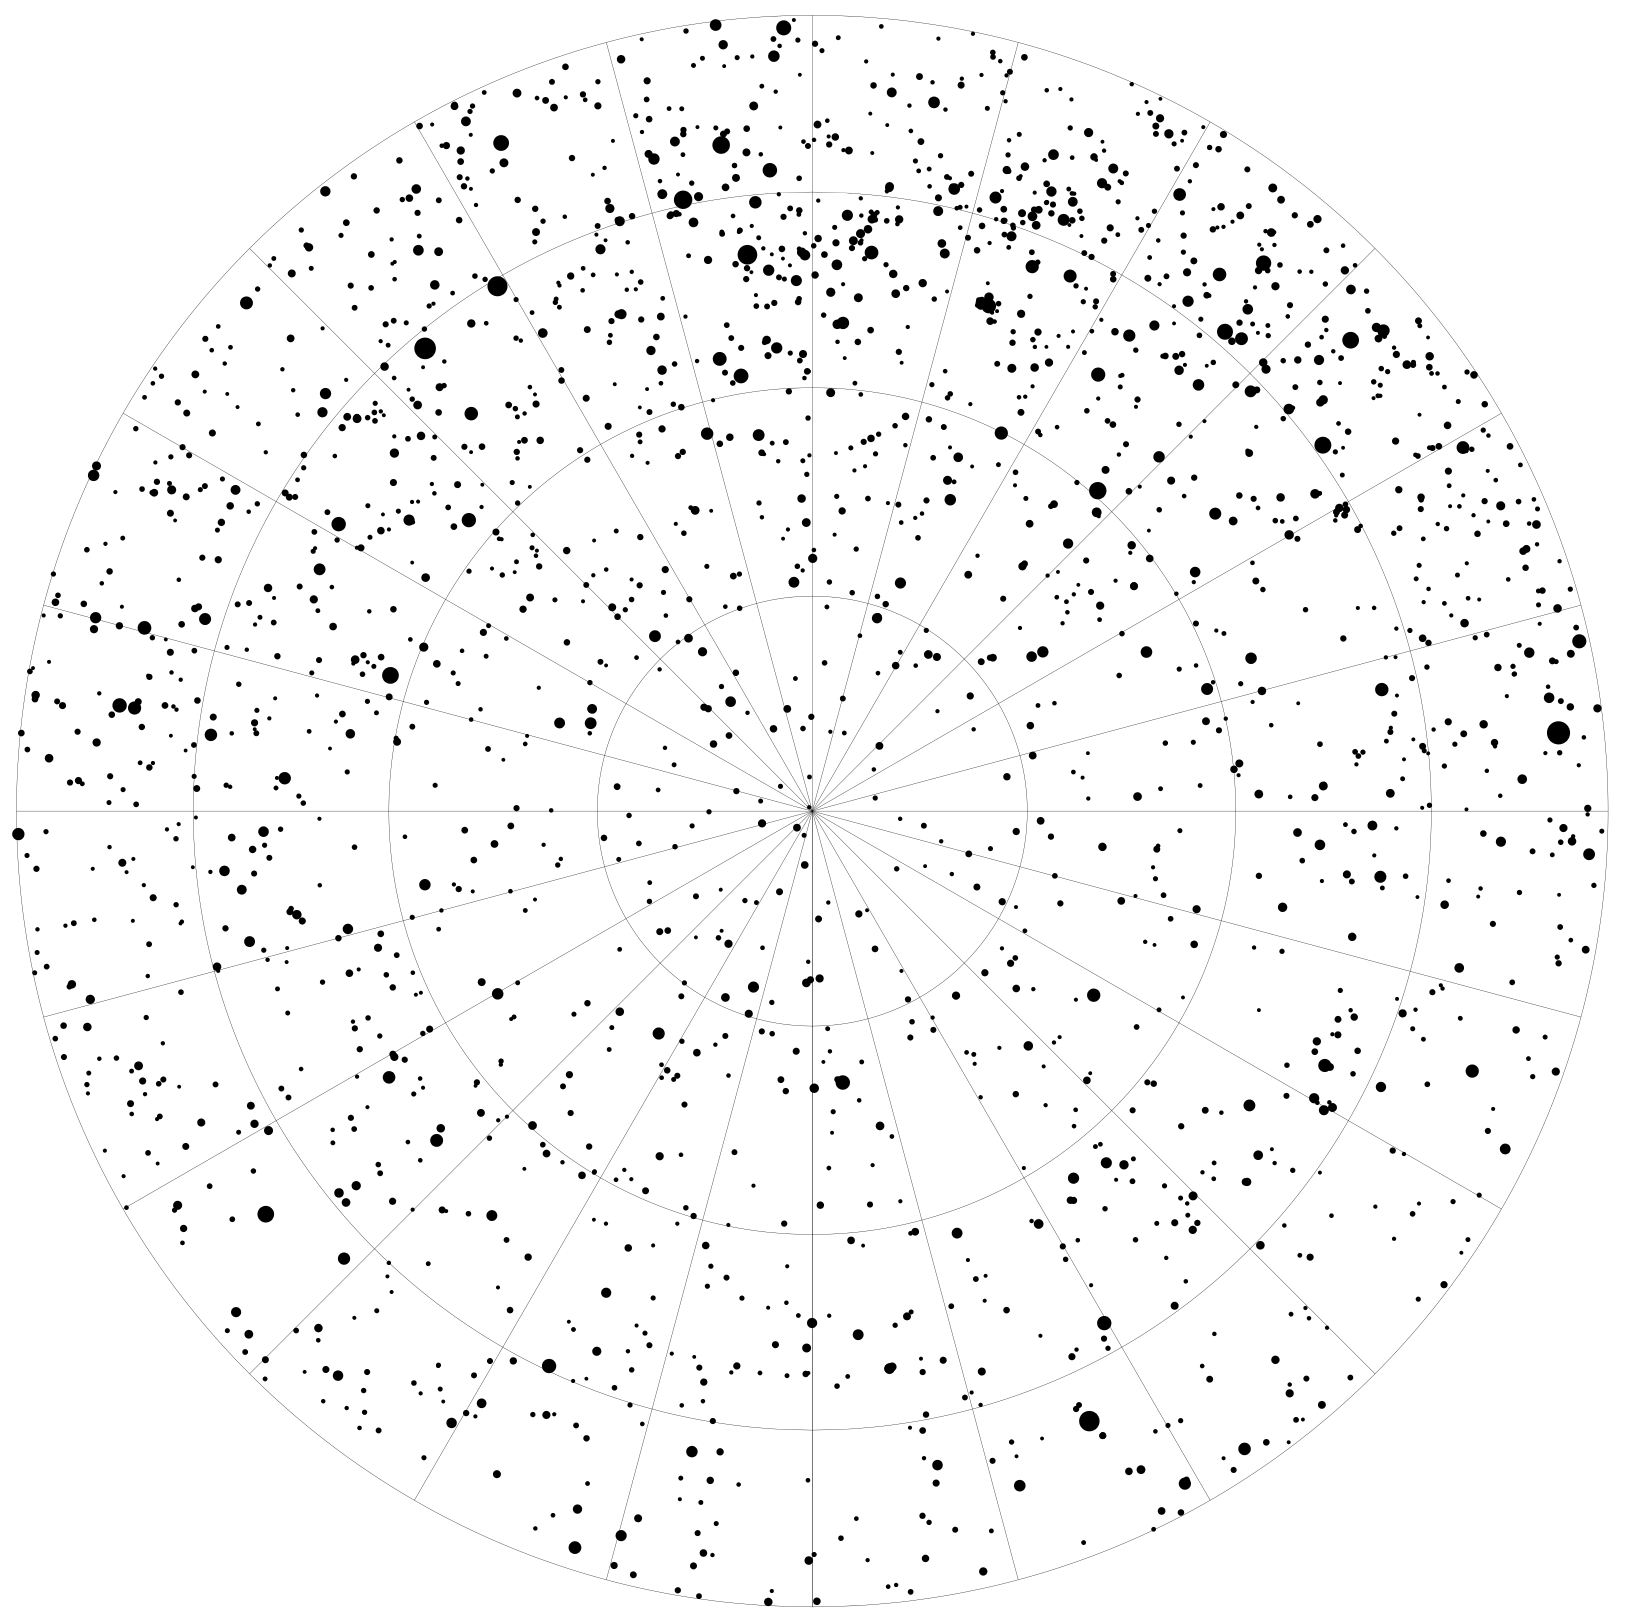
Maps of the Northern and Southern skies, showing stars down to magnitude 7 (original SVGs: North and South

The script is run by simply executing the main.py file, as follows:

python main.py

The SVG file will be created in the current directory, and will be named star-chart.svg

Please note that the script is designed to be run using Python 3, it will not run correctly with Python 2.

star-charts's People

Contributors

codebox avatar gulinux avatar

Stargazers

 avatar  avatar  avatar  avatar  avatar  avatar  avatar  avatar  avatar  avatar  avatar  avatar  avatar  avatar  avatar  avatar  avatar  avatar  avatar  avatar  avatar  avatar  avatar  avatar  avatar  avatar  avatar  avatar  avatar  avatar  avatar  avatar  avatar  avatar  avatar  avatar  avatar  avatar  avatar  avatar  avatar  avatar  avatar  avatar  avatar  avatar  avatar  avatar  avatar  avatar  avatar  avatar  avatar  avatar  avatar  avatar  avatar  avatar  avatar  avatar  avatar  avatar  avatar  avatar  avatar  avatar  avatar  avatar  avatar  avatar  avatar  avatar  avatar  avatar  avatar  avatar  avatar  avatar  avatar  avatar  avatar  avatar  avatar  avatar  avatar  avatar  avatar  avatar  avatar  avatar

Watchers

 avatar  avatar  avatar  avatar  avatar  avatar  avatar

star-charts's Issues

Overlapping RA

Hi,
I find there's no way to construct a SkyArea with RA coordinates overlapping the 0h mark.
For instance, if I wanted to build a sky area like this:

area = sky_area.SkyArea(23, 1, 10, 30, 8)

It would print the external segment of the celestial sphere (going from 01h to 23h) instead of the internal (from 23h to 01h).
You can see an attached screenshot.
Screenshot 2019-09-09 at 11 56 22

Am I missing something? Is there a better way to create a SkyArea with these coordinates?
I'm looking for a solution myself and see if I can create a PR, but I think it's a bit beyond my understandings.

Cheers,
Marco

Stardata orgin

I like this project very much.
Could you please share the origin of the stardata.

Better coordinates support

Hi,
I didn't find a way to express RA ranges overlapping 0, like [-350, 10].

From a user perspective I think this problem would be more easily solved by using a single coordinate (center of field) and a radius, instead of providing start/end ra/dec.
Is there any chance of seeing this implemented?

Python version?

Hi, I'm not very knowledgeable about Python and I wanted to use this utility to generate a chart and after some testing, I figured I needed to use Python 2.7, and trying to using Python 3.6 wouldn't generate the chart correctly.

Would it be possible to add a mention about some prerequisite in the readme to save some time for other newcomers like me? Thanks for your work on this!

Draws both hemispheres

I'm finding that both opposites of the celestial hemispheres are drawn.
Observing this while porting to JS and animating.
render_svg() does no skip any stars.

Or am I missing something?

Fixed offset and scale map on Python3

Hey all, this looks great! I downloaded it earlier today and found that on Python3 the generated SVG didn't scale the stars' positions correctly. I found that the issue was on the map call around line 70 of the coord_calc.py file and fixed it by replacing it with a for loop with the contents of offset_and_scale instead. I'm not very sure how to suggest a commit so I just bring this up here. Best of luck! Awesome job it's great!

Recommend Projects

  • React photo React

    A declarative, efficient, and flexible JavaScript library for building user interfaces.

  • Vue.js photo Vue.js

    🖖 Vue.js is a progressive, incrementally-adoptable JavaScript framework for building UI on the web.

  • Typescript photo Typescript

    TypeScript is a superset of JavaScript that compiles to clean JavaScript output.

  • TensorFlow photo TensorFlow

    An Open Source Machine Learning Framework for Everyone

  • Django photo Django

    The Web framework for perfectionists with deadlines.

  • D3 photo D3

    Bring data to life with SVG, Canvas and HTML. 📊📈🎉

Recommend Topics

  • javascript

    JavaScript (JS) is a lightweight interpreted programming language with first-class functions.

  • web

    Some thing interesting about web. New door for the world.

  • server

    A server is a program made to process requests and deliver data to clients.

  • Machine learning

    Machine learning is a way of modeling and interpreting data that allows a piece of software to respond intelligently.

  • Game

    Some thing interesting about game, make everyone happy.

Recommend Org

  • Facebook photo Facebook

    We are working to build community through open source technology. NB: members must have two-factor auth.

  • Microsoft photo Microsoft

    Open source projects and samples from Microsoft.

  • Google photo Google

    Google ❤️ Open Source for everyone.

  • D3 photo D3

    Data-Driven Documents codes.