Giter Site home page Giter Site logo

zincbase's Introduction

CircleCI DOI Documentation Status PyPI version fury.io PyPI download month PyPI pyversions PyPI license

Zincbase logo

ZincBase is a state of the art knowledge base and complex simulation suite. It does the following:

  • Store and retrieve graph structured data efficiently.
  • Provide ways to query the graph, including via bleeding-edge graph neural networks.
  • Simulate complex effects playing out across the graph and see how predictions change.

Zincbase exists to answer questions like "what is the probability that Tom likes LARPing", or "who likes LARPing", or "classify people into LARPers vs normies", or simulations like "what happens if all the LARPers become normies".

Example graph for reasoning

It combines the latest in neural networks with symbolic logic (think expert systems and prolog), graph search, and complexity theory.

View full documentation here.

Quickstart

pip3 install zincbase

from zincbase import KB
kb = KB()
kb.store('eats(tom, rice)')
for ans in kb.query('eats(tom, Food)'):
    print(ans['Food']) # prints 'rice'

...
# The included assets/countries_s1_train.csv contains triples like:
# (namibia, locatedin, africa)
# (lithuania, neighbor, poland)

kb = KB()
kb.from_csv('./assets/countries_s1_train.csv', delimiter='\t')
kb.build_kg_model(cuda=False, embedding_size=40)
kb.train_kg_model(steps=8000, batch_size=1, verbose=False)
kb.estimate_triple_prob('fiji', 'locatedin', 'melanesia')
0.9607

Requirements

  • Python 3
  • Libraries from requirements.txt
  • GPU preferable for large graphs but not required

Installation

pip install -r requirements.txt

Note: Requirements might differ for PyTorch depending on your system.

Web UI

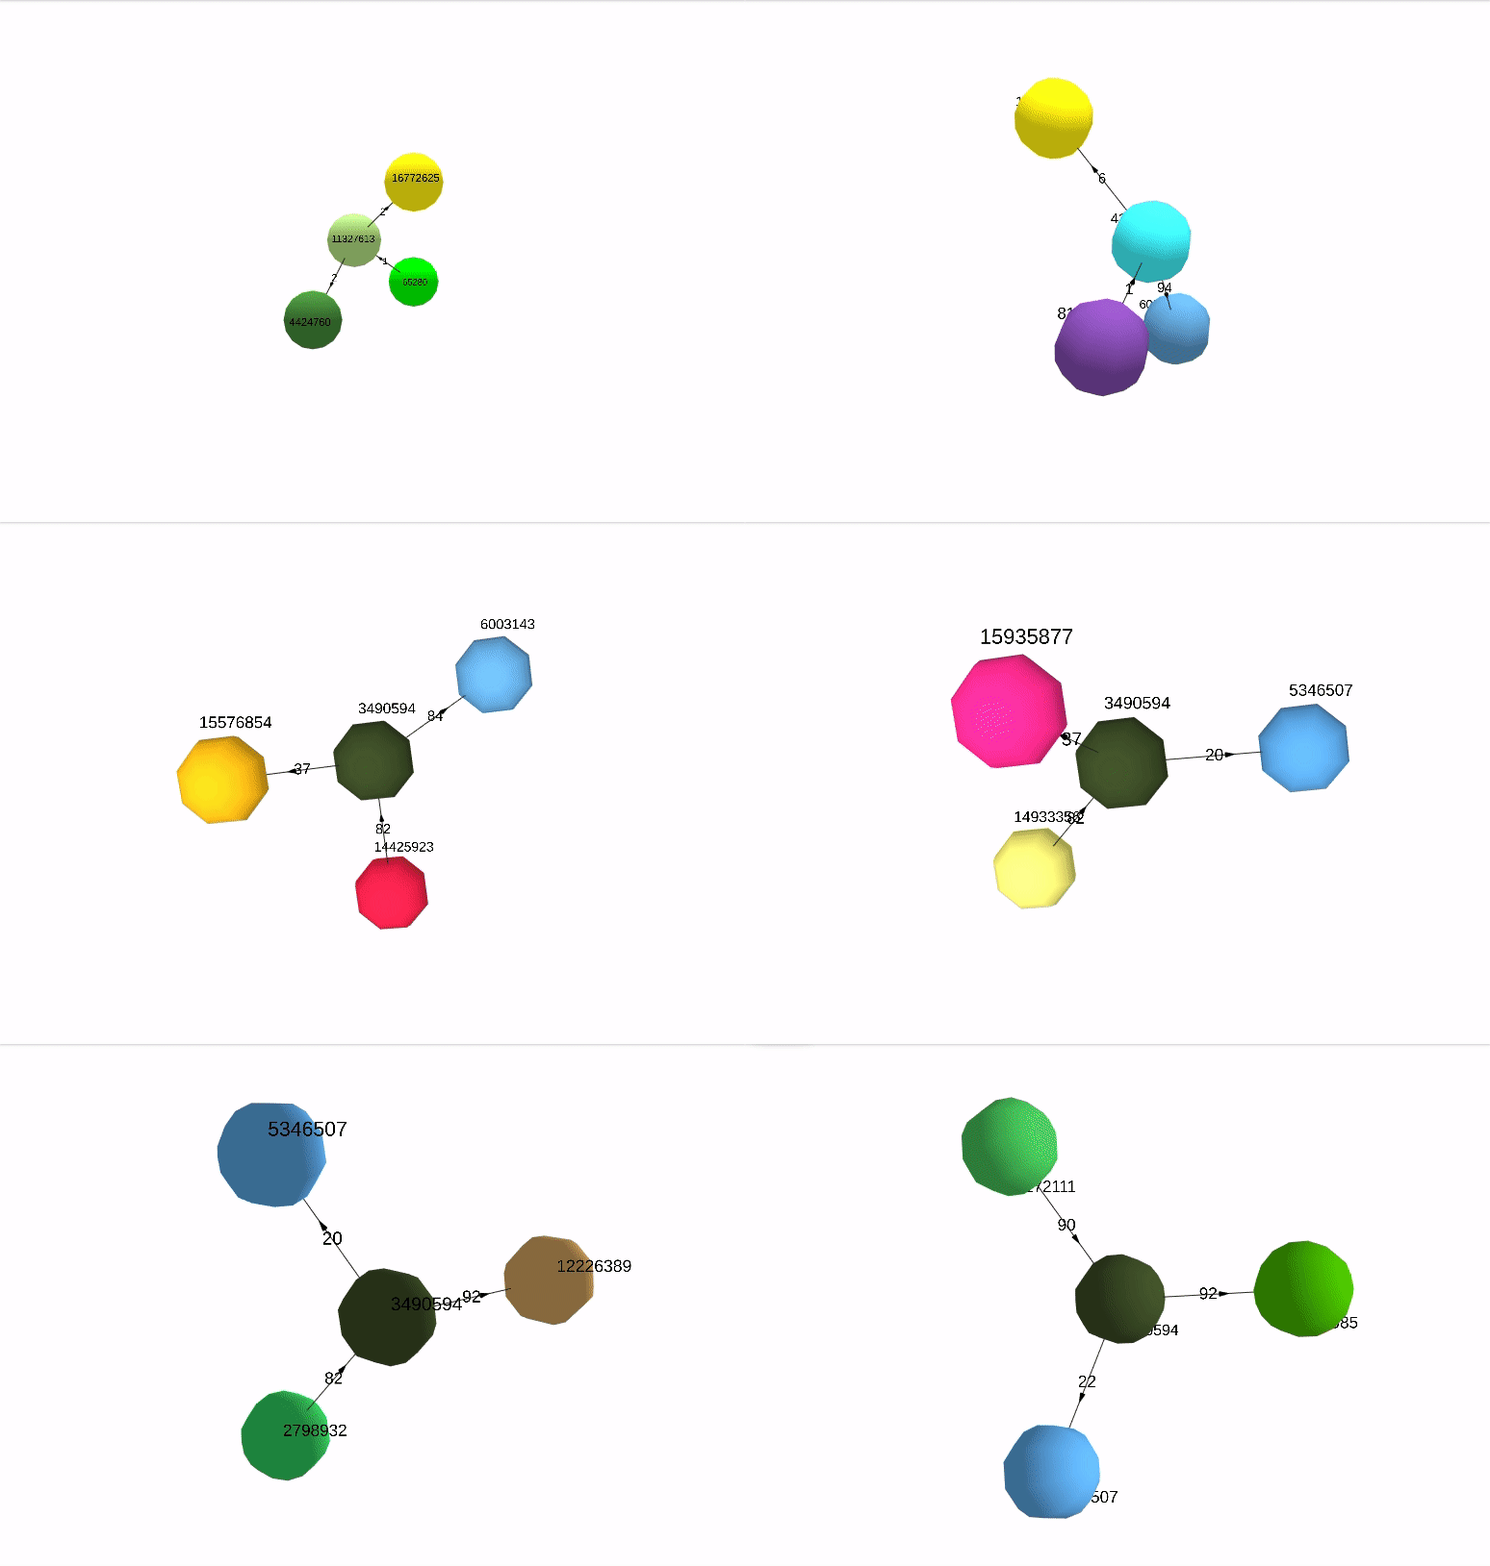
Zincbase can serve live-updating force-directed graphs in 3D to a web browser. The command python -m zincbase.web will set up a static file server and a websocket server for live updates. Visit http://localhost:5000/ in your browser and you'll see the graph UI. As you build a graph in Python, you can visualize it (and changes to it) in realtime through this UI.

Here are a couple of examples (source code here):

Peek 2020-03-21 12-34

Peek 2020-03-21 12-39

Complexity (Graph/Network) Examples

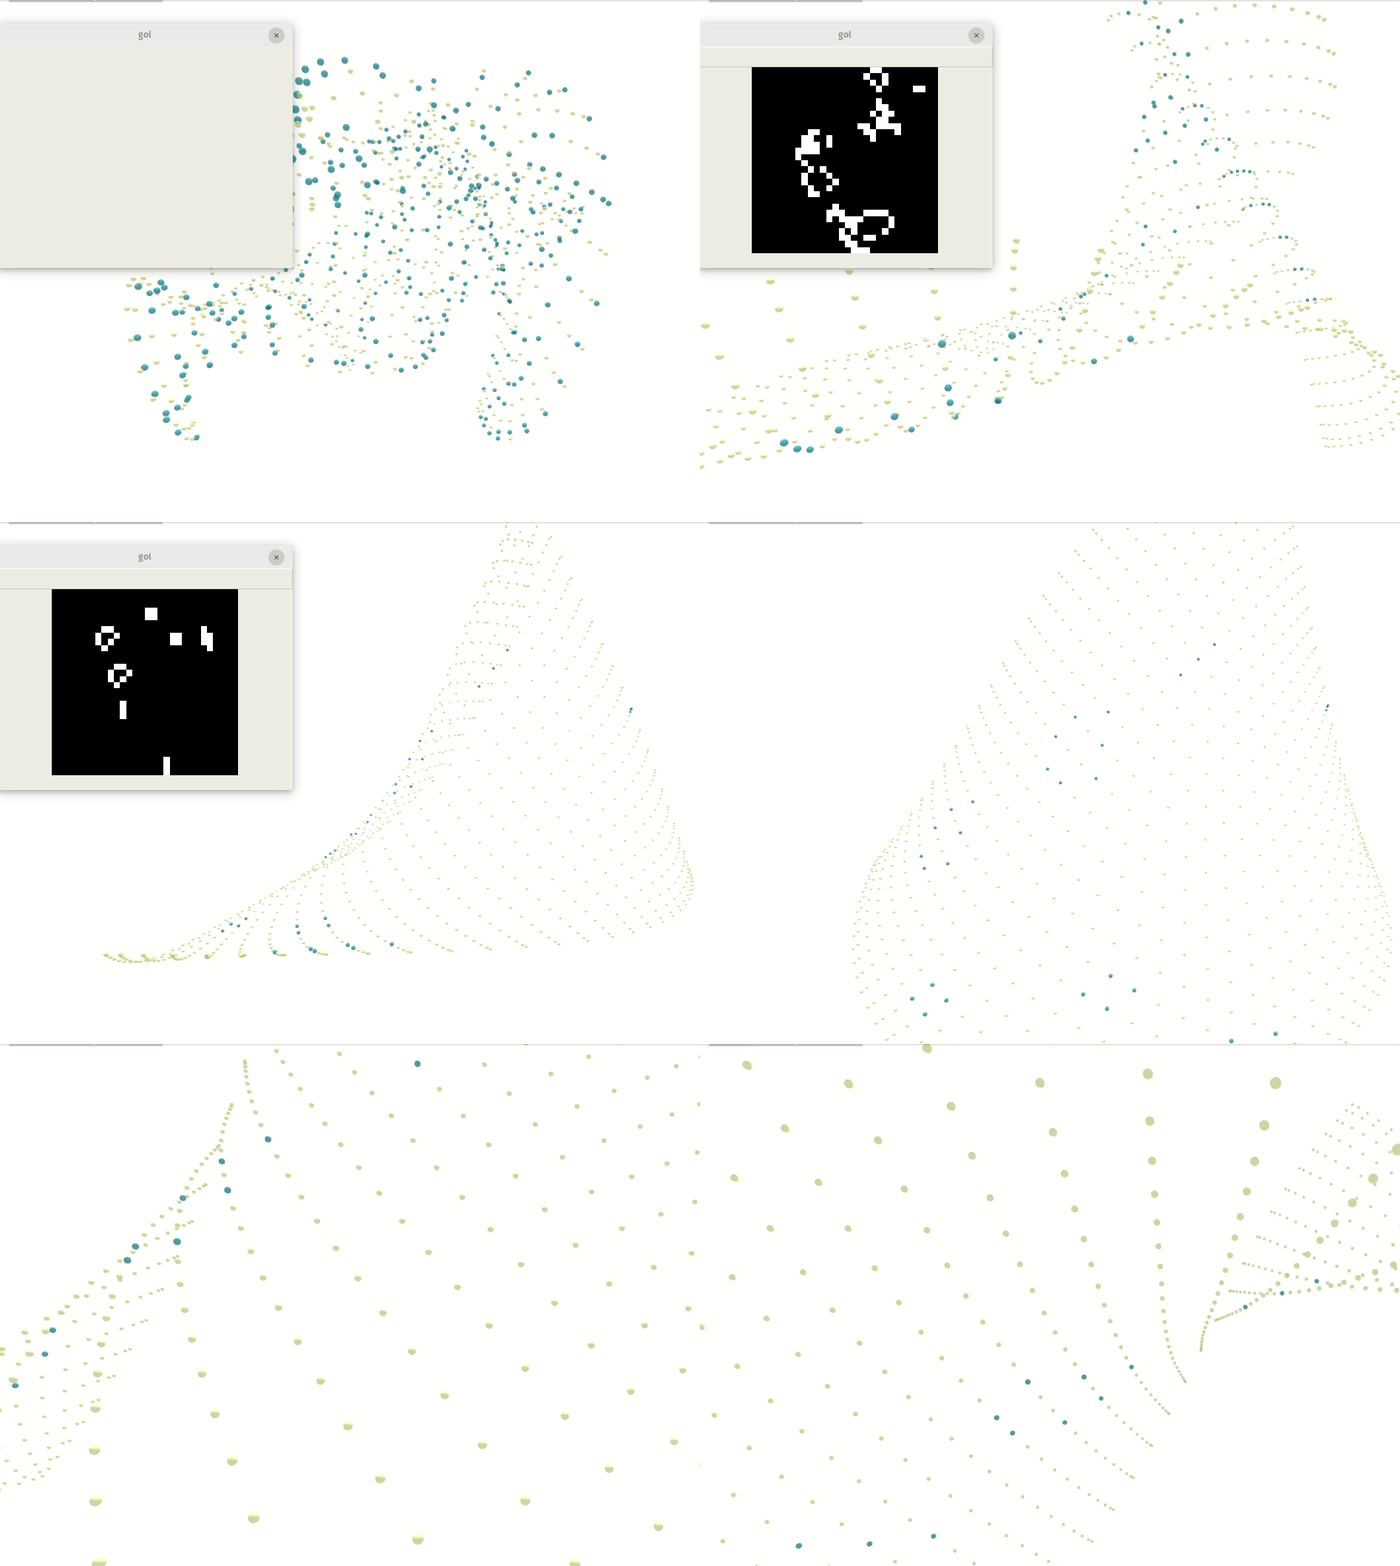
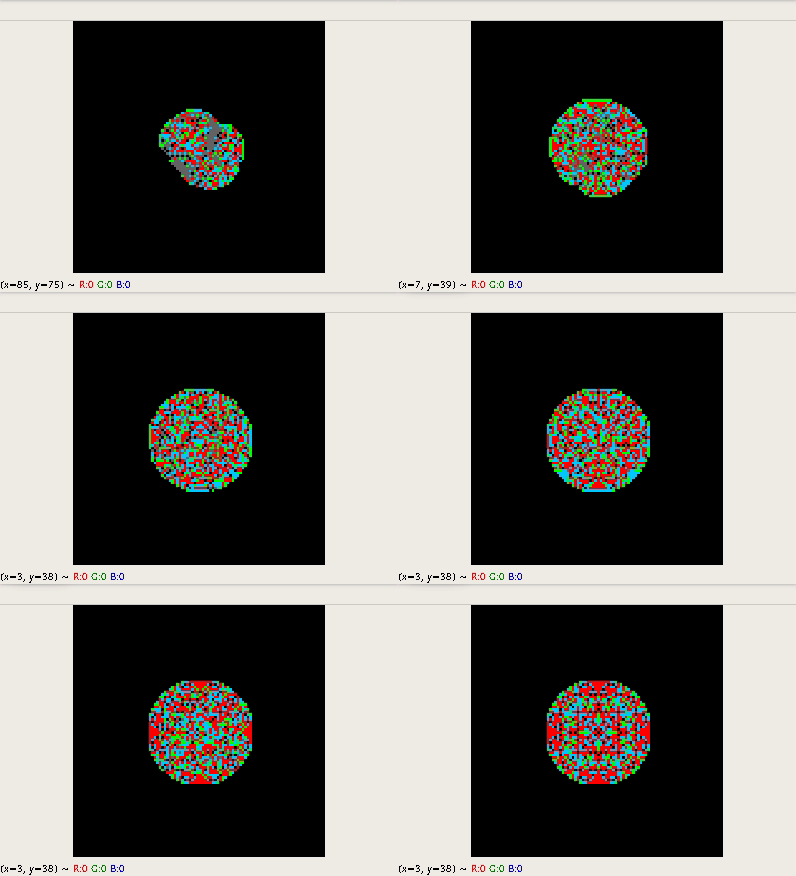
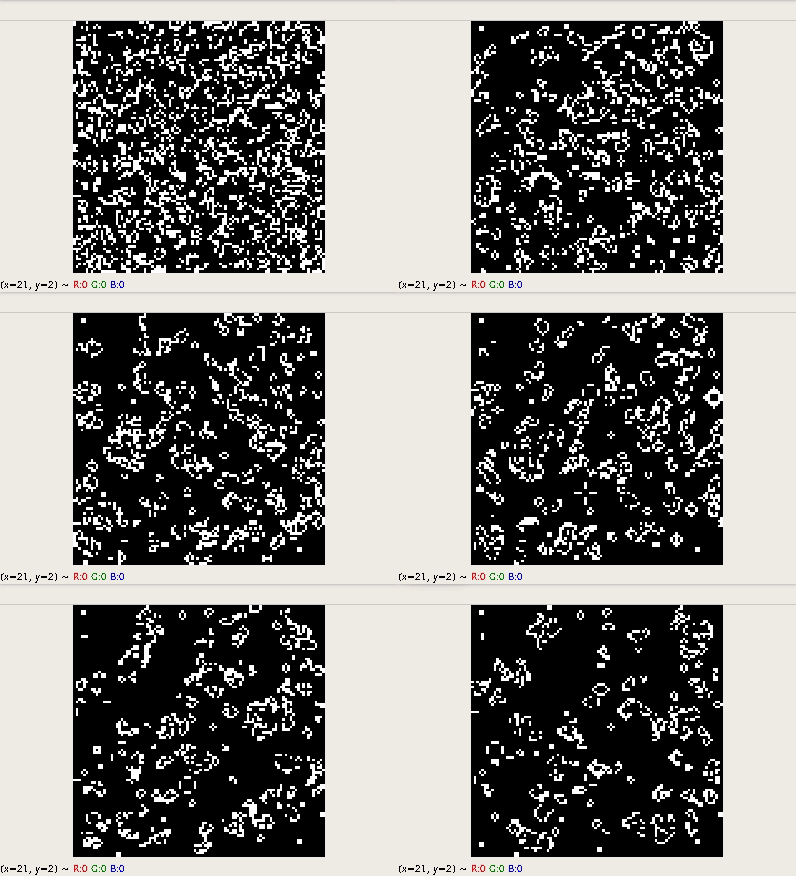
Two such examples are included (right now; we intend to include more soon such as virus spread and neural nets that communicate.) The examples are basic ones: Conway's Game of Life and the Abelian Sandpile. Here are some screencaps; source code is here, performance can be lightning fast depending how you tweak Zincbase recursion and propagation settings.

Peek 2020-03-06 23-53 Peek 2020-03-06 23-55

Required for the UI

  • You should pip install zincbase[web] to get the optional web extra.
  • You should have Redis running; by default, at localhost:6379. This is easily achievable, just do docker run -p 6379:6379 -d redis

Testing

python test/test_main.py
python test/test_graph.py
... etc ... all the test files there
python -m doctest zincbase/zincbase.py

Validation

"Countries" and "FB15k" datasets are included in this repo.

There is a script to evaluate that ZincBase gets at least as good performance on the Countries dataset as the original (2019) RotatE paper. From the repo's root directory:

python examples/eval_countries_s3.py

It tests the hardest Countries task and prints out the AUC ROC, which should be ~ 0.95 to match the paper. It takes about 30 minutes to run on a modern GPU.

There is also a script to evaluate performance on FB15k: python examples/fb15k_mrr.py.

Running the web UI

There are a couple of extra requirements -- install with pip3 install zincbase[web]. You also need an accessible Redis instance somewhere. This one-liner will get it running locally: docker run -p 6379:6379 -d redis (requires Docker, of course.)

You then need a Zincbase server instance running:

Building documentation

From docs/ dir: make html. If something changed a lot: sphinx-apidoc -o . ..

Pushing to pypi

NOTE: This is now all automatic via CircleCI, but here are the manual steps for reference:

  • Edit setup.py as appropriate (probably not necessary)
  • Edit the version in zincbase/__init__.py
  • From the top project directory python setup.py sdist bdist_wheel --universal
  • twine upload dist/*

TODO

  • add ability to kb = KB(backend='complexdb://my_api_key')
  • utilize postgres as backend triple store
  • Reinforcement learning for graph traversal.
  • Rete algorithm (maybe)

References & Acknowledgements

Theo Trouillon. Complex-Valued Embedding Models for Knowledge Graphs. Machine Learning[cs.LG]. Université Grenoble Alpes, 2017. English. ffNNT : 2017GREAM048

L334: Computational Syntax and Semantics -- Introduction to Prolog, Steve Harlow

Open Book Project: Prolog in Python, Chris Meyers

Prolog Interpreter in Javascript

RotatE: Knowledge Graph Embedding by Relational Rotation in Complex Space, Zhiqing Sun and Zhi-Hong Deng and Jian-Yun Nie and Jian Tang, International Conference on Learning Representations, 2019

Citing

If you use this software, please consider citing:

@software{zincbase,
  author = {{Tom Grek}},
  title = {ZincBase: A state of the art knowledge base},
  url = {https://github.com/tomgrek/zincbase},
  version = {0.1.1},
  date = {2019-05-12}
}

Contributing

See CONTRIBUTING. And please do!
zincbase's People

Stargazers

 avatar  avatar  avatar  avatar  avatar  avatar  avatar  avatar  avatar  avatar  avatar  avatar  avatar  avatar  avatar  avatar  avatar  avatar  avatar  avatar  avatar  avatar  avatar  avatar  avatar  avatar  avatar  avatar  avatar  avatar  avatar  avatar  avatar  avatar  avatar  avatar  avatar  avatar  avatar  avatar  avatar  avatar  avatar  avatar  avatar  avatar  avatar  avatar  avatar  avatar  avatar  avatar  avatar  avatar  avatar  avatar  avatar  avatar  avatar  avatar  avatar  avatar  avatar  avatar  avatar  avatar  avatar  avatar  avatar  avatar  avatar  avatar  avatar  avatar  avatar  avatar  avatar  avatar  avatar  avatar  avatar  avatar  avatar  avatar  avatar  avatar  avatar  avatar  avatar  avatar  avatar  avatar  avatar  avatar  avatar  avatar  avatar  avatar  avatar  avatar

Watchers

 avatar  avatar  avatar  avatar

zincbase's Issues

Spacing in Networkx Graph with mod to spring layout

Hello!

I noticed that the graphing feature, by default, presents a networkx graph of the nodes and edges; however, the spacing can become a bit tight in the layout.

For either a feature enhancement or for anyone interested in spacing out the edges and nodes, consider the following modification to zb.py

   # currently around line 829 and 830 ...
    def plot(self, density=1.0):
        """Plots a network diagram from (triple) nodes and edges in the KB.

        :param float density: Probability (0-1) that a given edge will be plotted, \
        useful to thin out dense graphs for visualization."""
        edgelist = [e for e in self.G.edges(data=True) if random.random() < density]
        newg = nx.DiGraph(edgelist)
        pos = nx.spring_layout(newg)
        # ...

The code above leads to a dense plot as provided by plot1.png

Whereas the code below leads to some more spacing for the figure in plot2.png.
plot1
plot2

If changed to:

    # code extract to demonstrate enhanced layout
    def plot(self, density=1.0):
        """Plots a network diagram from (triple) nodes and edges in the KB.

        :param float density: Probability (0-1) that a given edge will be plotted, \
        useful to thin out dense graphs for visualization."""
        edgelist = [e for e in self.G.edges(data=True) if random.random() < density]
        newg = nx.DiGraph(edgelist)
        # modification here!
        # this creates some spacing to make tight clusters more readable and could be configured further with 
        # values for K and seed
        pos = nx.spring_layout(newg, k=5 / math.sqrt(newg.order()), seed=0)
        # ...

TypeError: draw_networkx_edges() got an unexpected keyword argument 'font_size'

Hello, great library! I am making great use of it!

There is a slight issue with the plot() call to networkx.

In zb.py, around line 833, the script returns a networkx error when setting the parameter of font_size.

# line 833 of zb.py
nx.draw_networkx_edges(newg, pos, edgelist=edgelist, width=1, font_size=8)

The line of code above returns an error like the following:

TypeError: draw_networkx_edges() got an unexpected keyword argument 'font_size'

In my local, simply removing the font_size param from this call results in a successful networkx graph of my knowledge base.

# this works
nx.draw_networkx_edges(newg, pos, edgelist=edgelist, width=1)

I am not 100% sure, but based on the networkx function signature, it seems that the font_size param is not supported for draw edges.

Python3 ModuleNotFoundError: No module named 'graph'

Hi,

I stumbled upon module not found error in MacOS 10.14.3 (Mojave).

I have tried to install graph-tools in python3 and graph-tool deps via Homebrew.

❯ python3 examples/countries.py
Traceback (most recent call last):
  File "examples/countries.py", line 8, in <module>
    from zincbase import KB
  File "/usr/local/lib/python3.7/site-packages/zincbase/__init__.py", line 1, in <module>
    from .zincbase import KB
  File "/usr/local/lib/python3.7/site-packages/zincbase/zincbase.py", line 20, in <module>
    from graph import Node
ModuleNotFoundError: No module named 'graph'

Any idea how to make it work?

more comments in basis.py

If you want to start a visualisation on zincbase.web,
you look up the code on basic.py.

Though it is very easy example I couldnt get the whole code because of missing comments.
Commenting would increase the developer experience on zincbase.

I cant dump a knowledge base object with pickle

If I try to dump a medium complex kb with pickle, I get the exception

`'NoneType' object is not callable

A short google search shows me, that not every class can be dumped. It looks like
the knowledge base class should support this feature.`

Recommend Projects

  • React photo React

    A declarative, efficient, and flexible JavaScript library for building user interfaces.

  • Vue.js photo Vue.js

    🖖 Vue.js is a progressive, incrementally-adoptable JavaScript framework for building UI on the web.

  • Typescript photo Typescript

    TypeScript is a superset of JavaScript that compiles to clean JavaScript output.

  • TensorFlow photo TensorFlow

    An Open Source Machine Learning Framework for Everyone

  • Django photo Django

    The Web framework for perfectionists with deadlines.

  • D3 photo D3

    Bring data to life with SVG, Canvas and HTML. 📊📈🎉

Recommend Topics

  • javascript

    JavaScript (JS) is a lightweight interpreted programming language with first-class functions.

  • web

    Some thing interesting about web. New door for the world.

  • server

    A server is a program made to process requests and deliver data to clients.

  • Machine learning

    Machine learning is a way of modeling and interpreting data that allows a piece of software to respond intelligently.

  • Game

    Some thing interesting about game, make everyone happy.

Recommend Org

  • Facebook photo Facebook

    We are working to build community through open source technology. NB: members must have two-factor auth.

  • Microsoft photo Microsoft

    Open source projects and samples from Microsoft.

  • Google photo Google

    Google ❤️ Open Source for everyone.

  • D3 photo D3

    Data-Driven Documents codes.