
Python >= 3.8
netprobify is a tool to probe destinations using various protocols/methods.
Using scapy makes the tool easy to extend as well as adding new kinds of probe.
The tool is designed to scale by using multiprocessing.
Also as it uses scapy, no sockets are actually opened.
At Criteo, netprobify is used to provide metrics to all services provided by the network teams: datacenter, WAN, internet.
For example:
- datacenter: we probe all of our Top of Racks using UDPunreachable probing mode
- WAN: full mesh between our datacenters in TCPsyn probing mode
- internet: probing common and strategic targets using TCPsyn, UDPunreachable, ICMPping
To run netprobify you can:
- run
sudo netprobify_start.pyfrom the source code - or build a PEX and use it (see details in
How to buildsection below)
If you are willing to run it in production, the use of "stable" branch is recommended.
To configure netprobify, you need to add a netprobify.yaml configuration file.
All the details regarding the configuration can be found in netprobify/schema_config.yaml.
You can find a quick example below:
---
global:
  probe_name: "lab"
  interval: 30
  nb_proc: 8
  verbose: 0
  logging_level: INFO
  prometheus_port: 8000
  dns_update_interval: 300
  reload_conf_interval: 0

groups:
  standard:
    src_port_a: 65100
    src_port_z: 65199

targets:
  google_ipv4:
    description: "google_search"
    type: "TCPsyn"
    destination: "google.com"
    address_family: "ipv4"
    dst_port: 443
    nb_packets: 100
    timeout: 1
  google_ipv6:
    description: "google_search"
    type: "TCPsyn"
    destination: "google.com"
    address_family: "ipv4"
    dst_port: 443
    nb_packets: 100
    timeout: 1
  bing:
    description: "bing_search"
    type: "TCPsyn"
    destination: "bing.com"
    dst_port: 443
    nb_packets: 100
    timeout: 1
Then, you just have to scrape the result using Prometheus. In this example, you will need to scrape the host on port 8000.
For security purposes, netprobify can secure /metrics endpoint using HTTP basic authentication.
To set this up, you need to add PROM_USER and PROM_PASSWORD environment variables.
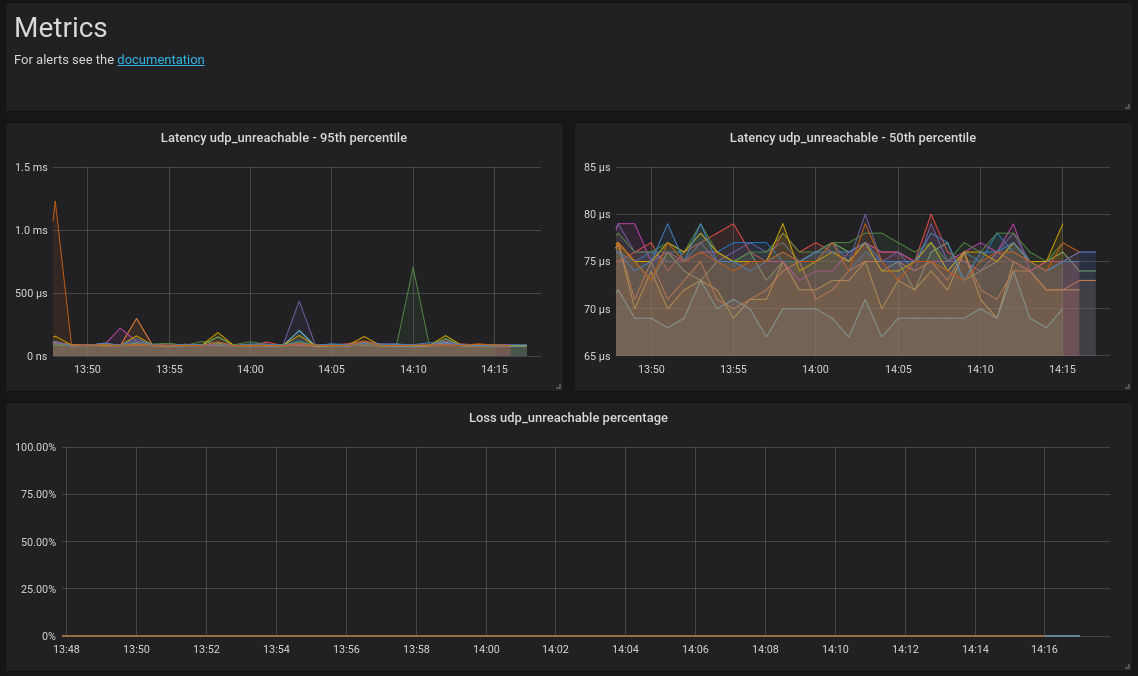
You will find below example of Prometheus alerts rule for netprobify.
Raise an alert when loss ratio is above 0.1%:
tcpsyn_loss_ratio{probe_name="lab"} * 100 > 0.1
Same but only if the probe is actually sending packets:
tcpsyn_loss_ratio{probe_name="lab"} * 100 > 0.1 and on(probe_name) sum by(probe_name) (increase(tcp_syn_sent_total,probe_name="lab"}[10m])) > 0
Raise an alert if the latency is above 100 millisecond:
tcpsyn_round_trip_seconds{probe_name="lab",percentile="95"} * 1000 > 100
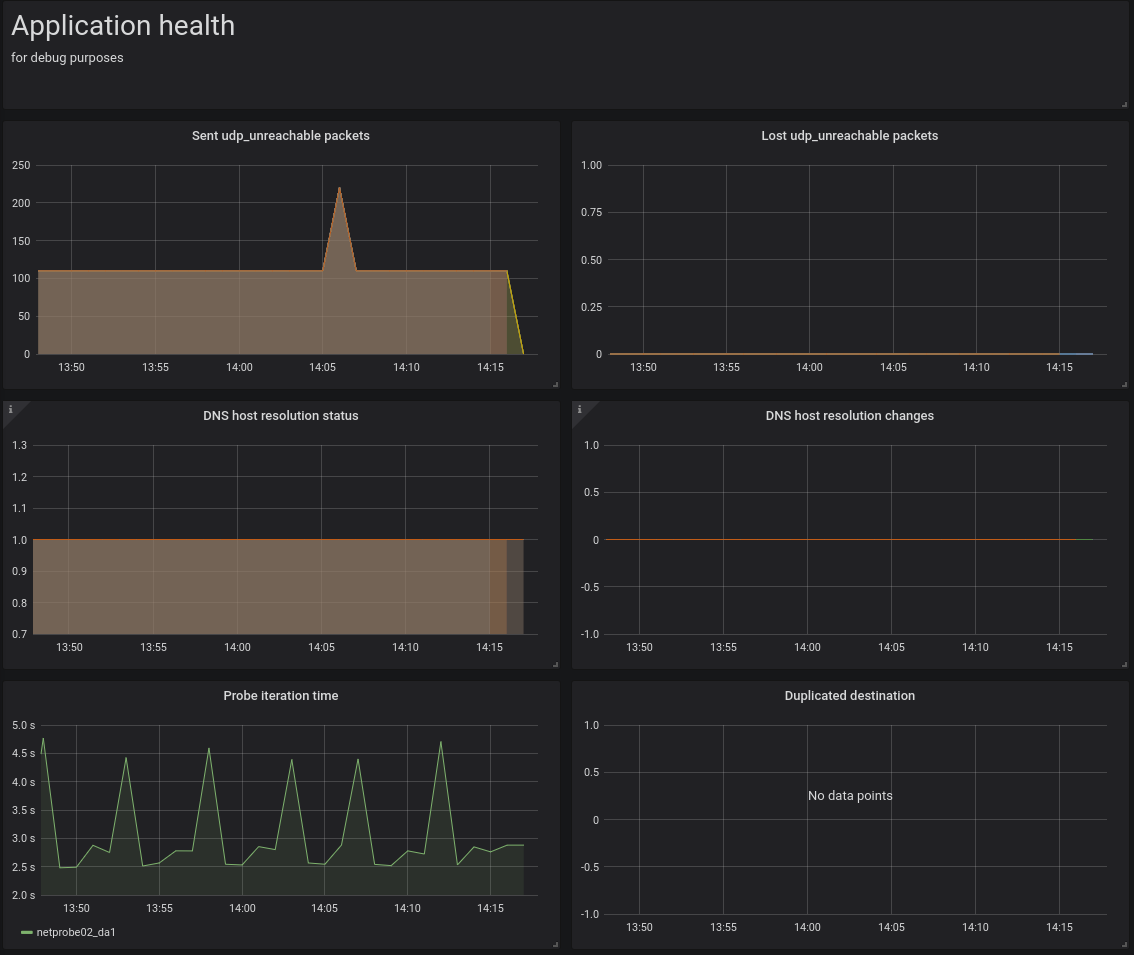
Raise an alert if the probe is taking too long to probe all the targets (more than 90 seconds):
app_iteration_time_seconds{probe_name="lab"} > 90
Raise an alert if netprobify is not running (or not scraped by Prometheus):
up{instance=~"lab",job="netprobify"} == 0
Raise an alert if the probe is not sending any TCPsyn packets:
sum by(probe_name) (increase(tcpsyn_sent_total{probe_name="lab"}[10m])) == 0
Raise an alert if the probe reloaded with a bad configuration:
app_reload_conf_failed_status{probe_name="lab"} > 0
- Create a virtualenv to avoid that local packages clash with your system
python3 -m venv .venvsource .venv/bin/activate
- Once in your venv, install all the dependencies
pip install -r requirements/netprobify.txtpip install -r requirements/tests.txtpip install -e .
- Run your program
sudo netprobify
- Run the command
tox. It will run tests, code coverage, linter for python3.
- Get out of your virtualenv by running in your shell
deactivate
- Run the command
tox -e bundle. It will build the pex - You will find your executable in dist/netprobify
netprobify can probe a host using an IP address, or a hostname, or a subnet. However, pinging a subnet will aggregate the results, and not expose metrics by hosts.
If a hostname is used to define the probe, the DNS resolution will be done at the interval defined in the config file (global or in the target definition).
All probes type can be specified with payload size.
This probe is using the TCPsyn stealth:
- send a TCP SYN
- wait for a response (TCP SYN or ICMP)
- send a TCP RST to close the connection
- calculate the latency between the TCP SYN and the first response.
To avoid collision, a seq id is defined using a global counter. That way, even if a target is defined twice and run at the same time, the tool will be able to match the response packets with the good sent packet.
This probe is using ICMP echo request. It is a basic ping.
UDPunreachable probe goal is to target an UDP closed port. It waits for an ICMP Destination Unreachable (Port unreachable).
It can be useful to target network devices when TCPsyn stealth doesn't work. The interest compared to ICMP, is that UDP is using ECMP by changing the source port.
To avoid collision, a unique ID parameter is setup at the IP level for each packets sent.
It works out of the box on Arista and Juniper devices.
If you are targeting another devices, you should make sure there is no rate-limit applied to ICMP Destination Unreachable.
By default, on linux:
- icmp_ratemask = 6168
- icmp_ratelimit = 1000
You can either deactivate completely the rate-limit, or simply deactivate the rate-limit for ICMP Destination Unreachable.
To do so, you just have to set icmp_ratemask to 6160.
More details about icmp_ratemask:
icmp_ratemask - INTEGER Mask made of ICMP types for which rates are being limited. Significant bits: IHGFEDCBA9876543210 Default mask: 0000001100000011000 (6168)
Bit definitions (see include/linux/icmp.h):
	0 Echo Reply
	3 Destination Unreachable *
	4 Source Quench *
	5 Redirect
	8 Echo Request
	B Time Exceeded *
	C Parameter Problem *
	D Timestamp Request
	E Timestamp Reply
	F Info Request
	G Info Reply
	H Address Mask Request
	I Address Mask Reply
source: https://www.kernel.org/doc/Documentation/networking/ip-sysctl.txt
A group has several parameters. The most important ones are:
- src_port_a
- src_port_b
Together, they define a range. For each TCPSyn target associated to a group, packets will be generated. The number of packets sent per group is configured via nb_packets parameter in the target definition. It will change the source port for each packet by using round robin in the range define in the group.
By default, all targets are associated to all groups. But you can change this behavior with parameters in config.yaml
- groups: permit_target_auto_register
- default: true
- if false, the targets will not automatically be in the group
- targets: auto_register_to_groups
- default: true
- if false, the target will not be automatically in any group
- targets: explicit_groups/register_to
- default: none
- explicity associate a target to a group even if permit_target_auto_register is set to false
- targets: explicit_groups/exclude_from
- default: none
- explicity remove the target from a group (useful when permit_target_auto_register is set to true)
The thresholds are exposed in prometheus with the right label, so you can match it with a metric and then create an alert.
The value unit must match the metric you want to monitor.
Example:
- Latency in seconds
- Loss in percentage
Example of Prometheus alert using the threshold metrics:
Raise an alert if the latency is above the threshold defined in the netprobify configuration file:
tcpsyn_round_trip_seconds{probe_name="lab",percentile="95"} * 1000 > on(destination, probe_name) threshold{alert_level="paging",type="latency"} * 1000`
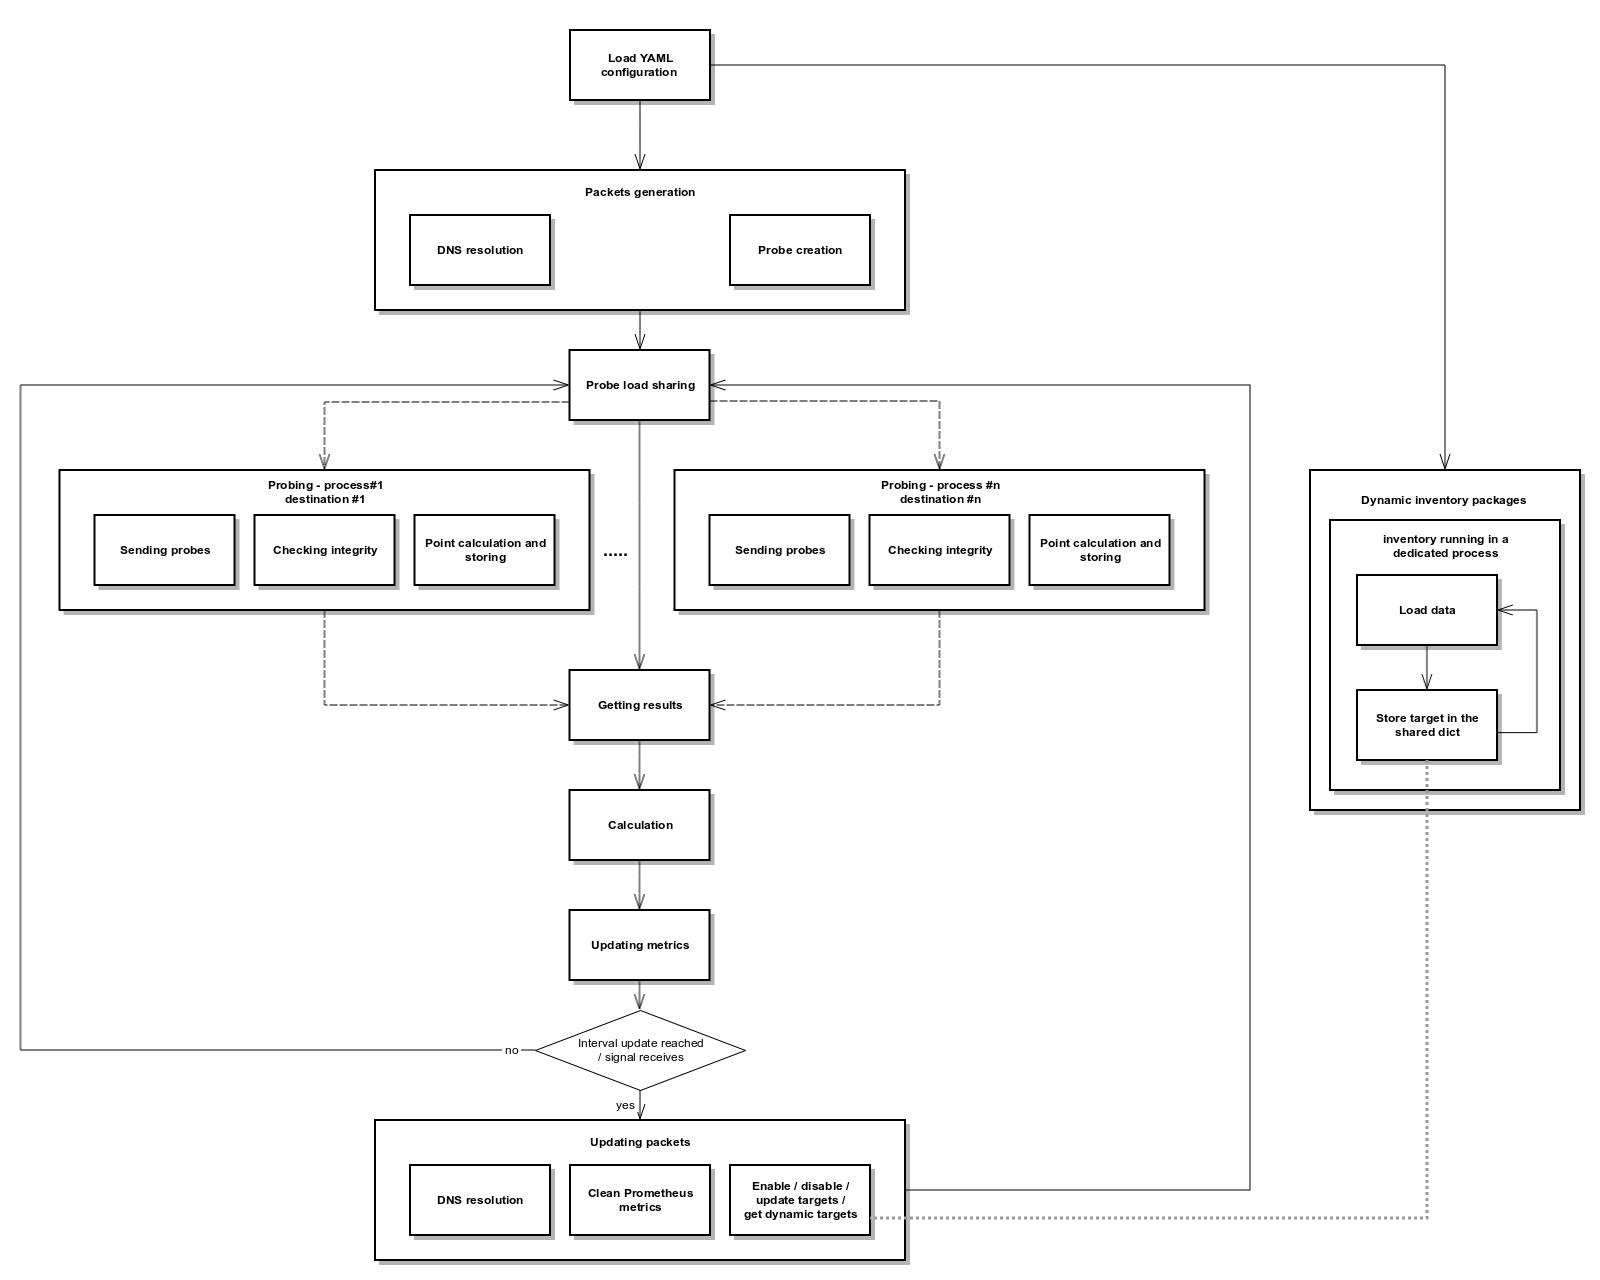
Dynamic inventories are custom modules loaded automatically. The goal is to set dynamically targets based on dynamic sources such as a CMDB, an API etc...
To load a dynamic inventory, you have to add a Python module in the dynamic_inventories directory.
The module must contain a "start" method with the following parameters:
- targets: dict shared among all processes (main process and dynamic inventories) Each modules should register its targets in "targets[module_name]" The minimal targets parameters are defined in schema_config.yaml
- module_name
- logging_level
All modules are started only at the netprobify startup in a dedicated subprocess. So, you may want the module to have an infinite loop.
All parameters are defined and described in schema_config.yaml
Due to an inherited limitation from libpcap (see the-tcpdump-group/libpcap#600), netprobify is not able to filter a specific subset of TCP and UDP packets. This will impact performance, especially when you receive real traffic from a target you try to probe: netprobify will also receive this traffic and will have to do more work to identify traffic related to probing (which could lead to false results).


