Giter Site home page Giter Site logo

crytic / contract-explorer Goto Github PK

View Code? Open in Web Editor NEW
28.0 16.0 11.0 933 KB

Visual Studio Code integration for Slither, a Solidity static analysis framework

License: GNU Affero General Public License v3.0

TypeScript 62.33% CSS 11.19% HTML 4.77% JavaScript 21.71%
static-analysis solidity ethereum visual-studio-code vscode-extension

contract-explorer's Introduction

Contract Explorer (Visual Studio Code Extension)

Visual Studio Code integration for Slither, a Solidity static analysis framework.

This extension offers Visual Studio Code integration for Slither, a Solidity static analysis framework written in Python 3. With Slither for Visual Studio Code, users can run a suite of vulnerability detectors on their Solidity smart contracts to annotate potentially dangerous code and receive suggested fixes.

Logo

Features

  • Analyze open workspaces
  • Explore results in a custom tree, sorted by issue type or severity
  • View results as native Visual Studio Code information/warnings/errors
  • See annotations for relevant source code for each issue
  • Print detailed issue description and recommendations
  • Filter issues by type (per workspace configuration)
  • Specify custom solc path (per workspace configuration)
  • Solidity Syntax Highlighting

Requirements

Note

slither-lsp must be accessible via the slither-lsp command in order for this extension to invoke it. Use pip install slither-lsp to install it.

Installation

From the Visual Studio Marketplace

Install Contract Explorer from the Visual Studio Marketplace within the Extensions tab of Visual Studio Code.

From source

git clone https://github.com/crytic/contract-explorer
cd contract-explorer
npm i
npm install -g vsce
vsce package

contract-explorer-X.X.X.vsix will be created.

Install the VSIX file in Visual Studio through Extensions, under the ... menu.

Getting Started

After installing the extension, simply open a workspace containing any Solidity (*.sol) files. The extension will activate, revealing the Slither logo on the action bar. Click it to reveal a settings pane, from which you will be able to select which detector results will be shown after a workspace folder has finished analysing.

Once analysis of a folder is done, you will be able to explore the codebase by using the familiar VSCode tools "Go to implementations", "Go to definitions", "Find all references", and showing call and type hierarchies.

License

AGPL-3.0

contract-explorer's People

Contributors

xenomega avatar broccolirob avatar samparsky avatar frabert avatar montyly avatar ggrieco-tob avatar

Stargazers

Alex Kraiz avatar alpharush avatar Nikolaus Schlemm avatar  avatar  avatar L avatar никита avatar bohendo avatar Bird avatar okanisis avatar Meow avatar Josh Stevens avatar Fenix avatar Floki The Boat Builder avatar Daniel Zarifpour avatar Hilliam T. avatar  avatar danilo neves cruz avatar Nick Beattie avatar  avatar The Farming Programer avatar  avatar Dom avatar Joshua David avatar  avatar Monte Carlo avatar  avatar yxliang avatar

Watchers

alicia avatar danilo neves cruz avatar James Cloos avatar Alex Groce avatar feliam avatar  avatar Will Song avatar  avatar Trent Brunson avatar John Dunlap avatar JP Smith avatar James Wang avatar yxliang avatar  avatar  avatar  avatar

contract-explorer's Issues

Solidity Syntax Highlighting

Aside from slither integration, the VSCode extension should also aim to replace core functionality provided by other Solidity extensions such as syntax highlighting.

UX Improvements

  • Set text reveal to default
  • Improve "slither not found" message
  • Tree view-mode improvements
  • Detector filter search feature
  • Issue count beside detector filters
  • Clicking an issue in explorer should select the diagnostic in the "Problems" window.

Installed VS Code extension, but it can't find my slither installation

Slither works fine from the terminal, but the extension still throws the following error:

Error: Slither not found:
Please verify slither is installed with the following command: "pip install slither-analyzer"
For more information, please visit: https://github.com/crytic/slither
Refreshing explorer...

For some reason it can't find it. I tried both with pip and pip3 as well, also with the --user flag and tried to install Slither it from a VS Code terminal as well. I tried to install with brew too, but no success.

macOS 13.0.1

Integration of slither printers

Slither printers offer useful information to the end user about their codebase. We should investigate possible integrations of slither printers into the extension.

Filter Out File Extension and Paths

I don't see a way to use this extension to run slither on my project but filter out certain files like the cli allow you to: slither . --filter-paths "test|lib|script"

It basically renders the extension unusable is it is showing issues on *.t.sol &*.s.sol file or files in /lib or /test/ or script

How can one configure the extension so it only runs slither on the desired files and/or paths?

sean

Issue Type: Bug

issies

Extension version: 0.0.7
VS Code version: Code - Insiders 1.63.0-insider (Universal) (d18d093403b12a65350c58a7b0d5771cc1f42aba, 2021-11-26T06:34:43.820Z)
OS version: Darwin x64 19.6.0
Restricted Mode: No

System Info
Item Value
CPUs Intel(R) Core(TM) i7-3820QM CPU @ 2.70GHz (8 x 2700)
GPU Status 2d_canvas: enabled
gpu_compositing: enabled
metal: disabled_off
multiple_raster_threads: enabled_on
oop_rasterization: enabled
opengl: enabled_on
rasterization: enabled
skia_renderer: disabled_off_ok
video_decode: enabled
webgl: enabled
webgl2: enabled
Load (avg) 4, 3, 3
Memory (System) 16.00GB (1.79GB free)
Process Argv -psn_0_1020153 --crash-reporter-id 1c7c2b7d-ccb9-47b6-b8c6-254cd4d94532
Screen Reader no
VM 0%
A/B Experiments
vsliv695:30137379
vsins829:30139715
vsliv368cf:30146710
vsreu685:30147344
python383:30185418
vspor879:30202332
vspor708:30202333
vspor363:30204092
pythontb:30258533
pythonptprofiler:30281269
vshan820:30294714
pythondataviewer:30285072
vscod805cf:30301675
pythonvspyt200:30323110
bridge0708:30335490
bridge0723:30353136
pythonrunftest32:30365365
pythonf5test824:30361779
javagetstartedt:30350119
pythonvspyt187:30365360
vsaa593:30376534
vsc1dst:30396469
pythonvs932:30404738
vscexrecpromptc:30397557
vscop804:30404766
vscop453:30404998

Running slither on a truffle directory returns results with UNIX style filepaths

When slither is run on a truffle directory, the JSON results' source mapping filenames are in UNIX style. This is a problem on Windows as the file path will be invalid.
Example: C:\Test\Whatever\File.bin will return as /C/Test/Whatever/File.bin

This currently breaks the "go to" support in the plugin for slither results.

Note: Running directly on a non-truffle directory will return appropriate results.

Update source references to make use of relative path

Currently, the extension will use the filename_absolute field instead of any relative path. This means if the workspace which slither is run on is relocated, the filename references will be invalid.

The extension should only use relative paths to minimize possible issues with workspace relocation.

Add configuration option to specify slither target

Hi everyone!

Maybe I don't know where to look, but it seems to me that there is currently no option to specify the target directory for slither. I can run slither from my CLI with slither src where src is the target-folder containing the Solidity files. But the VSCode extension is always trying to run slither . which will ultimately throw the following error:

⸻ Starting analysis ⸻
Error: Error in workspace "/home/raoul/project":
Traceback (most recent call last):
  File "/home/raoul/.local/lib/python3.8/site-packages/slither/__main__.py", line 743, in main_impl
    ) = process_all(filename, args, detector_classes, printer_classes)
  File "/home/raoul/.local/lib/python3.8/site-packages/slither/__main__.py", line 73, in process_all
    compilations = compile_all(target, **vars(args))
  File "/home/raoul/.local/lib/python3.8/site-packages/crytic_compile/crytic_compile.py", line 637, in compile_all
    compilations.append(CryticCompile(target, **kwargs))
  File "/home/raoul/.local/lib/python3.8/site-packages/crytic_compile/crytic_compile.py", line 117, in __init__
    self._compile(**kwargs)
  File "/home/raoul/.local/lib/python3.8/site-packages/crytic_compile/crytic_compile.py", line 548, in _compile
    self._platform.compile(self, **kwargs)
  File "/home/raoul/.local/lib/python3.8/site-packages/crytic_compile/platform/hardhat.py", line 87, in compile
    os.listdir(build_directory), key=lambda x: os.path.getmtime(Path(build_directory, x))
FileNotFoundError: [Errno 2] No such file or directory: 'artifacts/build-info'


⸻ Analysis: 0 succeeded, 1 failed, 0 skipped ⸻
Refreshing explorer...
Loaded 0 issues, displaying 0

The problem seems to be the following line, which passes . as the hardcoded target to slither:

https://github.com/crytic/slither-vscode/blob/9cbf906ebac9ef9b61964609beda17a646b0bac7/src/slither.ts#L101

It would be nice to have a workspace-folder configuration option to specify the target manually.

Clicking a detector filter jumps the scroll position

Clicking a detector filter to toggle its enabled status will currently be choppy, as it will reload the list in order to refresh the icon change. This will cause a jump in scrolling position. An attempt should be made to smoothen out this tree update operation so that no jump in position occurs.

Error when attempting to jump to a file by clicking on an analysis result

Slither version: 0.8.3
Repository: https://github.com/fluidity-money/fluidity-app (specifically the contracts/ethereum directory)

I'm able to run slither through the extension just fine, and it shows up with a bunch of issues. However, when clicking on an issue to jump to the file containing the issue, I get a Error: cannot read properties of undefined (reading 'length') error.

You can reproduce it by doing the following:

  1. Install slither version 0.8.3 (unsure if that matters)
  2. Clone the repository from above
  3. cd to the contracts/ethereum directory
  4. Run yarn
  5. Run slither . (it should run successfully now)
  6. Run slither through the VSC extension.
  7. Attempt to jump to an issue by clicking on it through the Slither Analysis tab

From my quick attempt at debugging this issue, it seems like the problem is in this line of code:

export async function gotoResultCode(workspaceFolder : string, result : SlitherResult) {
    try {
        // If there are no elements for this check which map to source, we stop.
        if (result.elements.length <= 0 || !result.elements[0].source_mapping) {

        // ...
    } catch (r) {
        // Log our error.
        Logger.error(r.message);
    }
}

Here, result.elements is undefined.

Let me know if there's any other information I can provide to assist with this :)

UI in VSCode is not working since VSCode version 1.72.2

Since the new update of vscode the slither ui is not working properly. You can see it in the attached image.

Here are some details about VSCode:

Version: 1.72.2
Commit: d045a5eda657f4d7b676dedbfa7aab8207f8a075
Date: 2022-10-12T22:15:55.763Z (1 day ago)
Electron: 19.0.17
Chromium: 102.0.5005.167
Node.js: 16.14.2
V8: 10.2.154.15-electron.0
OS: Darwin arm64 21.6.0
Sandboxed: No

slither_ui_issue

IRaD Proposal and Future Work

The following issue was captured from conversations with David Pokora and Josselin Feist.

Summary

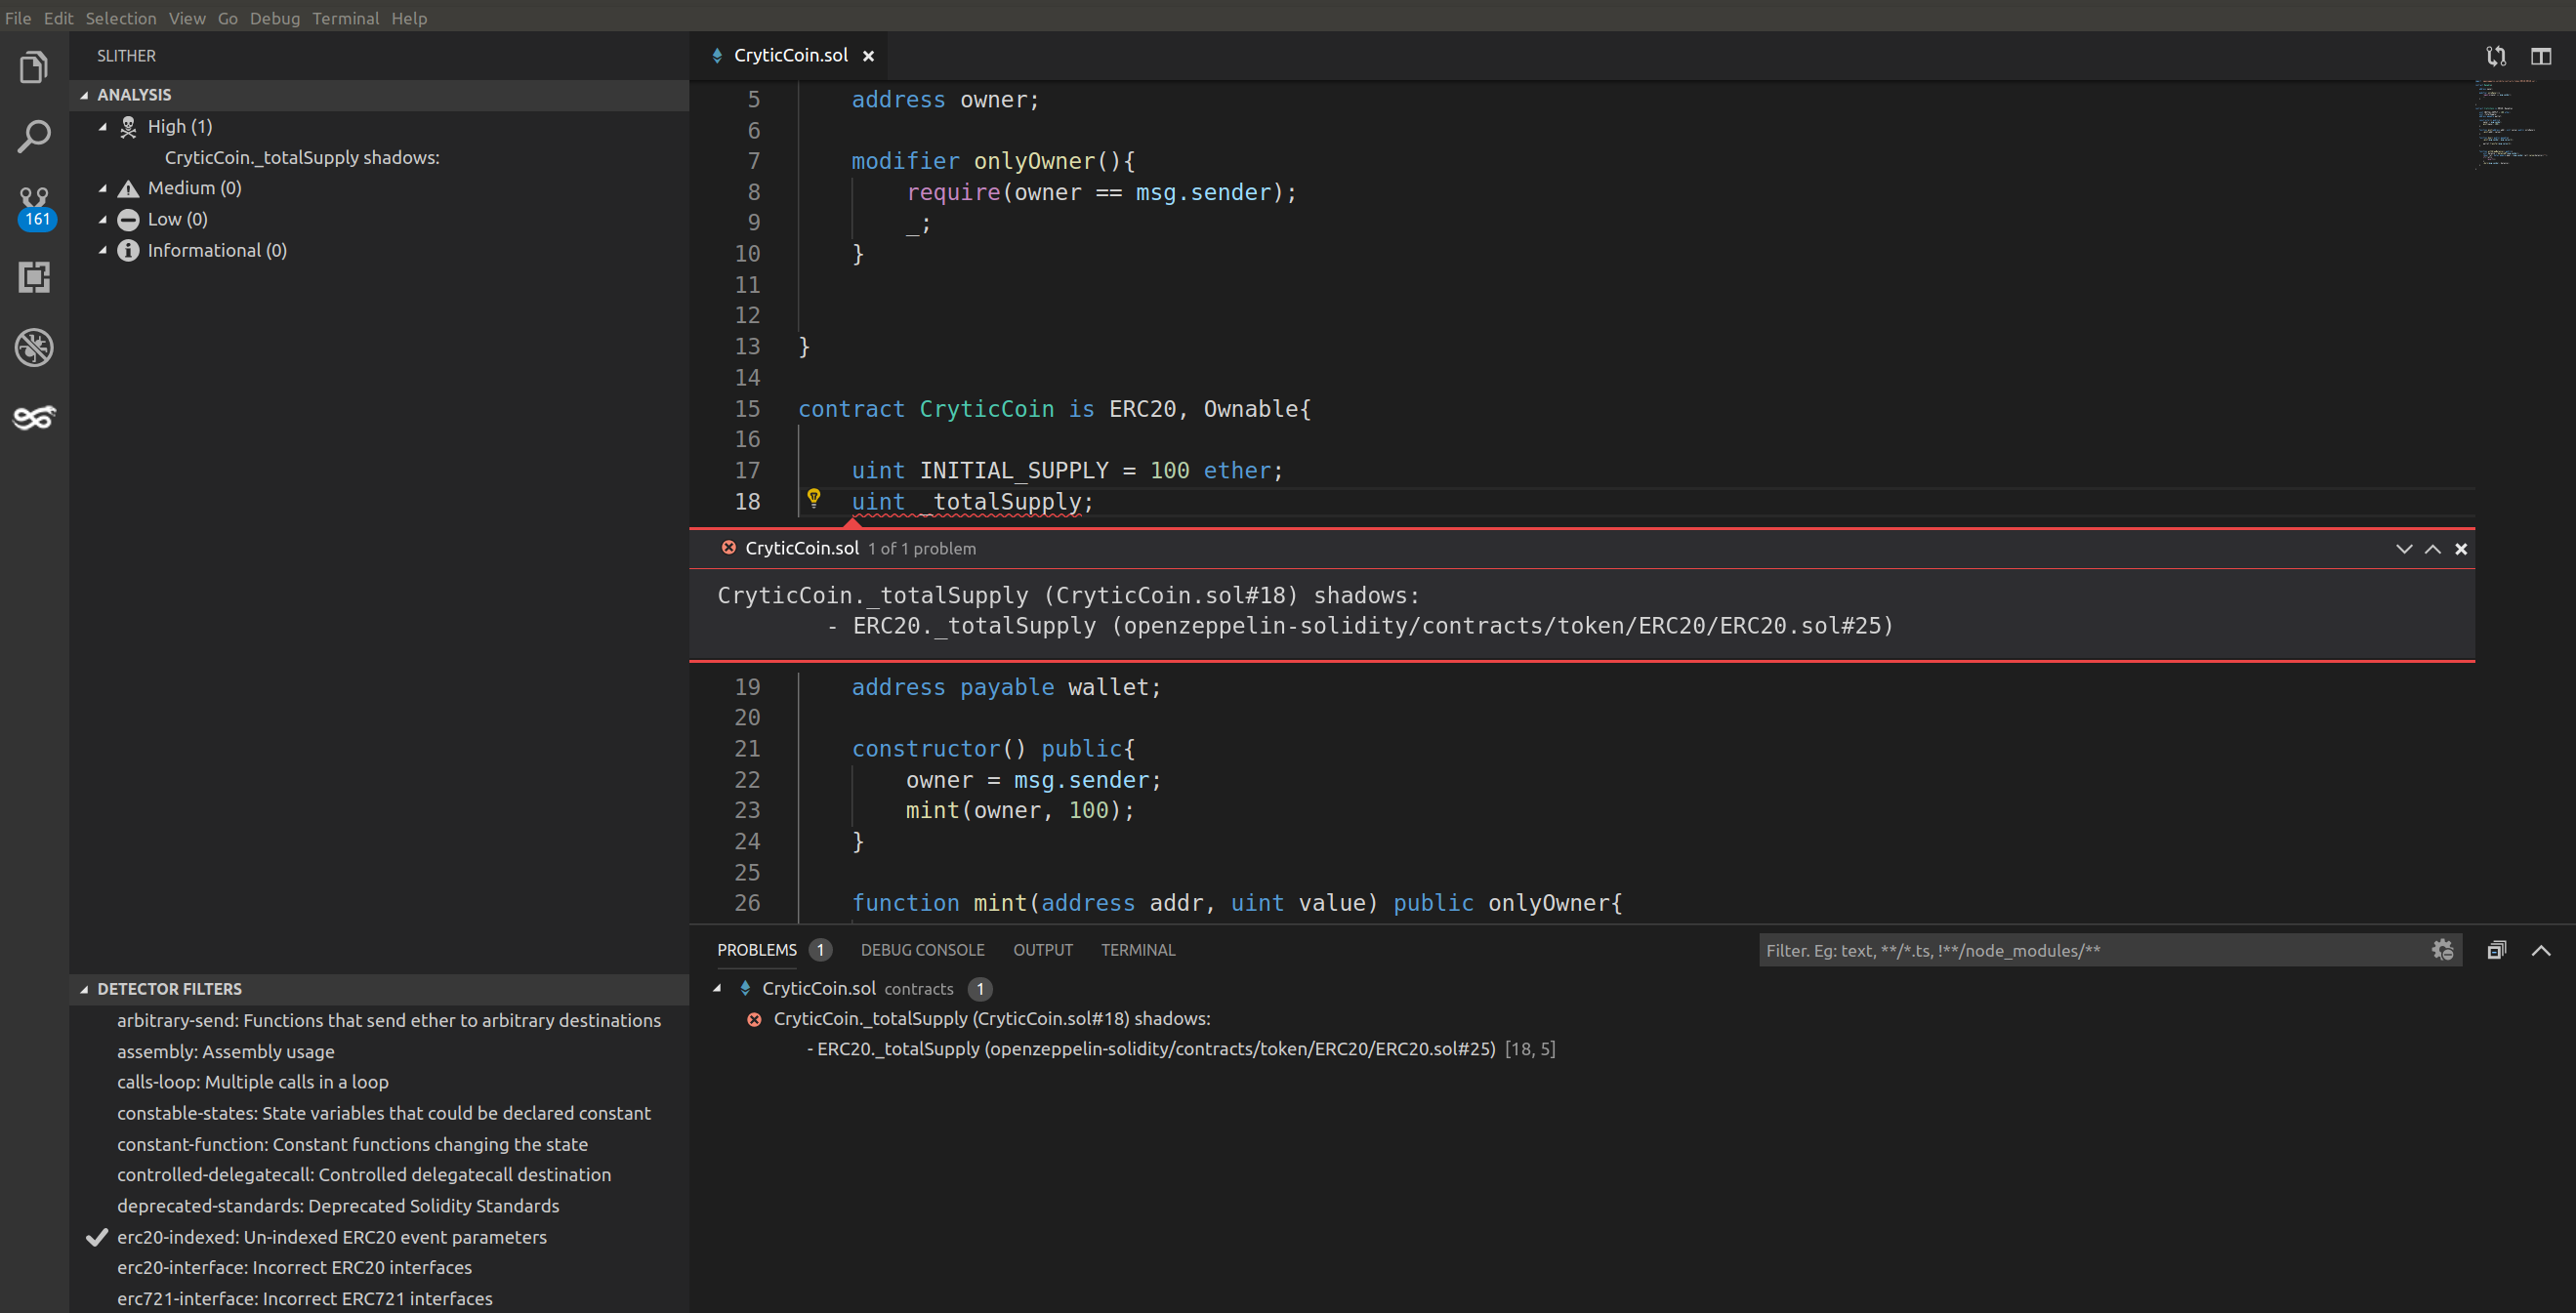
Trail of Bits has Slither, which is a static analyzer for Solidity that can provides all the information. This can be integrated as a VSCode extension and power a new Solidity extension.

A Slither vscode extension and language server is a good IRAD project that can have a great impact for assurance. It's something we have explored multiple times in the past, but we never managed to get to a point where we were happy with the results, because of the lack of resources. I think we can build a vscode plugin that does things like:

  • Better code syntax highlight that existing vscode plugin
  • Cross reference (ex: I click on a variable, it shows then where its defined, used etc)
  • Inheritance navigation
  • Printer integration. In particular we have a lot of printers that return markdown tables, and it would be awesome to have interactive filters. For example for the function summary printer, having a filter on "internal calls", to quickly see all the functions that have this internal calls
  • Advanced Slither features - e.g. data dependency integration: I click on a variable, and it shows all the dependencies

Background

The current ethereum and Solidity tooling is bad. There is no good solution to explore a solidity codebase and have the “basic features” that you expect from an IDE (like "go to reference"). There are two plugins available that together provide an incomplete solution:

Work has already been started on a Slither extension and Slither language server:

The working state and capabilities of these is unknown.

Slither VSCode Extension and Language Server

Slither comes with a lot of so called printers, which are basically visual representation of different things (inheritance graph, data dependency, etc..). I think we have also an opportunity to use vscode to shows them in a more intuitive way.

For a vscode plugin we can take different directions, like:

  • Having slither exporting all the information in a json (or similar), and just load everything in vscode
  • Or build an interactive system, where vscode would query a slither-deamon (e.g. through LSP)

A language server will make sure that the functionality is available for vscode and similar editors and IDEs. The slither-lsp has two components:

  1. The python-based LSP implementation from the ground up (the only other one to exist at the time was palantirs, and it was not extensible/bad)
  2. The slither-lsp app logic that uses the LSP protocol to offer slither-powered code analysis to VSCode

The Slither extension can invoke slither-lsp and communicate over the network (if a port is defined) or over stdin/stdout otherwise. Most of the LSP API handlers were added, there are some missing and probably new ones added since (this project hasn't been touched in over a year). LSP protocol stuff (agnostic from slither) goes in the slither_lsp/lsp directory, while app logic for slither-lsp is in the slither_lsp/app directory.

Because slither LSP is written in python and VSCode uses the LSP to communicate with it directly, we can just write python-based handlers for all the stuff like "go to definition", as you can see we implemented some of (but slither wasn't fully ready for at the time, it needed its API updated). See app_hooks.py.

New LSP command handlers are registered in the registered_handlers.py file.

Goals

In terms of capabilities, right now it just has some "dumb" code to compile a target (which we should try to replace with something faster because compiling with truffle is slow, so if we can conceptually auto-generate a solc standard input file that detected all files and compiled, it'd help. I started on some of this but stopped).

We want it so when you change code, after a few seconds it will recompile/reanalyze and update the state accordingly.

But generally the vision for this was: it will continuously analyze, it provides the typical language features like "go to", "find references", etc by operating on functions/variables/objects slither parsed by using a reference ID. And then we'd add custom command handlers in slither-lsp (and UI for it in slither-vscode, like a context/right-click menu item) for different analysis like taint analysis.
We wanted to be able to say things like "I clicked in this portion of the code, give me an ID for slither objects (if any) that live here" (a variable, a function, etc), then you can operate on that (like the "go to definition feature") by later passing that object ID to slither functions that would do the heavy lifting for you.

Slither is really powerful, but over CLI, you invoke it, and it runs, then ends. The idea with slither-lsp is that you'll have a slither analysis you can continuously interact with and we can begin to expose richer slither features that were only available through the Python API before.

a lot of the heavy lifting is already done so implementing more command handlers and just integrating with slither API to provide the actual experience we want is really what's left.

More broadly, this should NOT just be designed with this one VSCode purpose in mind. The LSP can be used to enable any application (web, desktop, vscode, etc) to perform interactive analysis with Slither. So this should be considered slither's interactive layer. We are simply writing the VSCode extension as one of the apps that can leverage this, to provide value to our auditing process.

Note: Slither had broken code for something in the base feature set. I can't remember what it was, maybe it was returning "references" incorrectly. I'd evaluate all those features.

Note: Slither has a dev-get_line_and_character_from_offset branch which was never merged and can be used to get the line number and offset, which is necessary for the vscode extension.

Potential Initial Steps

  • Determine the status of the current Slither extension and language server.
  • (Optional) Determine if the source file line / offset functionality has been added to Slither. If the functionality will be needed, work on getting the dev-get_line_and_character_from_offset branch merged.
  • Implement Solidity syntax highlighting.
  • Implement "go to definition" (see Slither's source mapping API).
  • Based on the above goals, determine what remaining tasks need to be completed.

VSCode output opens automatically on startup

After I quit VSCode, when I open a new window the output panel opens automatically with this message:

⸻ Slither: Solidity static analysis framework by Trail of Bits ⸻
Using slither version: 0.9.1
Refreshing explorer...
Loaded 136 issues, displaying 136

Originally, I thought this was an issue with another configuration, but after disabling the slither extension (inspired by a suggestion from: microsoft/vscode#34221 (comment)) the issue does not persist.

File changes should be detected, appropriate action taken

Verification should be done to ensure that slither results for are invalidated for files that have been changed since analysis, or if source mapping does not point to the original data.

Possible approach: insert source mapping hashes post-analysis. Use them to verify results are not out of sync. Recommend the user re-analyzes the file, or consider potentially offering an auto-analysis option.

not starting

Type: Bug

i dont know if its a problem in my vs code or not but the slither is not starting up inmy pc it is showing an activation error in the slither.please guide me with this error

Extension version: 0.0.7
VS Code version: Code 1.85.1 (0ee08df0cf4527e40edc9aa28f4b5bd38bbff2b2, 2023-12-13T09:49:37.021Z)
OS version: Windows_NT x64 10.0.22621
Modes:

System Info
Item Value
CPUs AMD Ryzen 5 5500U with Radeon Graphics (12 x 2096)
GPU Status 2d_canvas: enabled
canvas_oop_rasterization: enabled_on
direct_rendering_display_compositor: disabled_off_ok
gpu_compositing: enabled
multiple_raster_threads: enabled_on
opengl: enabled_on
rasterization: enabled
raw_draw: disabled_off_ok
video_decode: enabled
video_encode: enabled
vulkan: disabled_off
webgl: enabled
webgl2: enabled
webgpu: enabled
Load (avg) undefined
Memory (System) 15.33GB (7.06GB free)
Process Argv --crash-reporter-id bf4bc21f-997d-46f4-a241-9a9c4d982a71
Screen Reader no
VM 67%
A/B Experiments
vsliv368:30146709
vsreu685:30147344
python383:30185418
vspor879:30202332
vspor708:30202333
vspor363:30204092
vslsvsres303:30308271
vserr242:30382549
pythontb:30283811
vsjup518:30340749
pythonptprofiler:30281270
vshan820:30294714
vstes263:30335439
vscoreces:30445986
vscod805cf:30301675
binariesv615:30325510
bridge0708:30335490
bridge0723:30353136
vsaa593:30376534
pythonvs932:30410667
py29gd2263:30899288
vscaat:30438848
vsclangdf:30486550
c4g48928:30535728
dsvsc012:30540252
azure-dev_surveyone:30548225
f6dab269:30613381
a9j8j154:30646983
showlangstatbar:30737416
fixshowwlkth:30771522
showindicator:30805244
pythongtdpath:30769146
i26e3531:30792625
welcomedialog:30910333
pythonidxpt:30866567
pythonnoceb:30805159
asynctok:30898717
dsvsc013:30795093
dsvsc014:30804076
dsvsc015:30845448
pythontestfixt:30902429
pyreplss1:30897532
pythonmypyd1:30879173
pythoncet0:30885854
pythontbext0:30879054
accentitlementsc:30887149
dsvsc016:30899300
dsvsc017:30899301
dsvsc018:30899302
aa_t_chat:30882232
cp7184c:30925681

Update extension to use recent slither with crytic-compile

As of 0.6.3, slither has delegated the compilation process to crytic-compile. With this, some application arguments and source mapping structure has changed. The extension should be updated to use the current slither master branch, in preparation for the next release.

Investigate: Possibility to hide extension container without valid workspace

Currently the slither extension UI is always visible, even if a project without solidity files is open. VSCode documentation often encourages users to manually right click and hide tools they won't use. This is not an ideal solution however.

We must investigate the possibility of hiding the Slither view container in the activity bar.

Obtain AST from slither for further analysis

The Visual Studio Code extension should continue to expand by ingesting the Solidity AST created from Slither analysis. This will enable the Visual Studio Code extension to perform much deeper analysis and guide auditing practices. Changes to slither will be required.

Feature proposal: search, ignore comments

Feature request
It would be cool if slither-vscode could provide a better search experience than native vs code. E.g. ignore comments or even ignore any non-executable code (comments and strings).

E.g. searching new on my codebase (to identify which contracts are factories) yields about 20 results, but only two are relevant

(Adding this here bc it is not (yet) part of LSP spec)

Unknown contract item: ErrorDefinition

I'm running the Slither vc-code extension on a hardhat project and when I click the play button Slither runs for a while, and then I get the following output:

Unknown contract item: ErrorDefinition

I did a quick search of this repo and didn't see anything. Slither runs fine via command line for this project. I've used this extension on another hardhat project, so I know everything is set up properly in vs code. Any ideas/pointers? Really all I want is to see the Slither output overlaid on top of the lines in vs code. Is it possible to import a Slither report into the vs code extension somehow?

Create wiki

This issue serves as a reminder for wiki tasks to be completed

  • Installing Slither VSCode plugin + minimum requirements
  • Analyzing workspace + slither-results.json file (and adding to git ignore in case of custom/private slither detectors to not leak output)
    • Results Explorer usage (view mode, print detailed description, etc)
    • Diagnostics/inline messages + "goto" code actions
    • Detector Filtering
    • Output channel
    • Changing files + out-of-sync slither results
  • Understanding settings.json (custom solc path, etc)
  • Understanding errors

CodeLens should reflect changes in detector results/filters

Currently, changes to detector results and filters may not instantly take effect on CodeLens annotations, causing a clicked annotation to complain that it cannot find the associated slither result ExplorerNode for that annotation.

The CodeLens annotations should be refreshed upon detector filter changes, or new analysis being completed.

Error: spawn slither-lsp ENOENT (PATH issue)

Hey, just bringing it up to your attention.

This PR is still relevant. Extension has problem finding slither-lsp, even if echo $PATH lists appropriate directories (and, slither-lsp is installed). This happens for both global and venv active python interpreter.

The only way to run extension, for me, was to do the dev-installation and point to the specific slither-lsp server running. However, even with that, the currently released version seems to be missing some functionality. Below is the only visible display. Plugin doesn't seem to do anything else than just allowing to toggle options for detection filters.

contract-explorer

Add appropriate messages for longer running operations

Larger operations such as running Slither analyses on the workspaces should present better messages to prevent users from invoking another long running operation before the previous one had been completed. (ie: Prevent a user from impatiently invoking two "run analysis").

Error in workspace "$PATH": undefined

I am using the extension in a workspace with multiple projects.

⸻ Analysis: 0 succeeded, 1 failed, 0 skipped ⸻
Refreshing explorer...
Loaded 0 issues, displaying 0
⸻ Starting analysis ⸻
Error: Error in workspace "/Users/.../.../gitlab/audit":
undefined

On startup, the slither extension usually works, but every so often, when I rerun the command Slither: Analyze, the extension fails with this error.

Improve handling of configuration changes on open workspace

It would be ideal if this extension could reload all relevant configuration/state/UI when a configuration property is changed.

Currently the configuration is only reloaded if solcPath changes. Hidden detectors changes do not reload the workspace, as these changes might have been committed by the extension itself, causing an unnecessary workspace reloading operation (inefficient).

It is currently not recommended to change a workspace configuration while the workspace is open. Only changes to solcPath should be considered safe.

Slither result "go to" does not consider column positions

The current implementation of "go to" for a slither issue will select the affected lines of code, which may select too much information. They should instead take into account the lines + columns to start and end at, such that the result range is accurately reflected.

Recommend Projects

  • React photo React

    A declarative, efficient, and flexible JavaScript library for building user interfaces.

  • Vue.js photo Vue.js

    🖖 Vue.js is a progressive, incrementally-adoptable JavaScript framework for building UI on the web.

  • Typescript photo Typescript

    TypeScript is a superset of JavaScript that compiles to clean JavaScript output.

  • TensorFlow photo TensorFlow

    An Open Source Machine Learning Framework for Everyone

  • Django photo Django

    The Web framework for perfectionists with deadlines.

  • D3 photo D3

    Bring data to life with SVG, Canvas and HTML. 📊📈🎉

Recommend Topics

  • javascript

    JavaScript (JS) is a lightweight interpreted programming language with first-class functions.

  • web

    Some thing interesting about web. New door for the world.

  • server

    A server is a program made to process requests and deliver data to clients.

  • Machine learning

    Machine learning is a way of modeling and interpreting data that allows a piece of software to respond intelligently.

  • Game

    Some thing interesting about game, make everyone happy.

Recommend Org

  • Facebook photo Facebook

    We are working to build community through open source technology. NB: members must have two-factor auth.

  • Microsoft photo Microsoft

    Open source projects and samples from Microsoft.

  • Google photo Google

    Google ❤️ Open Source for everyone.

  • D3 photo D3

    Data-Driven Documents codes.