Decode CINRAD (China New Generation Weather Radar) data and visualize.
example folder contains detailed examples!
PyCINRAD supports Python version 3.5 and higher.
pip install cinrad
You can also download from github page and build from source
python setup.py install
Decode CINRAD radar data.
from cinrad.io import CinradReader, StandardData
f = CinradReader(your_radar_file) #Old version data
f = StandardData(your_radar_file) #New standard data
f.get_data(tilt, drange, dtype) #Get data
f.get_raw(tilt, drange, dtype)
The get_raw method returns radar records without other geographic information.
The get_data method returns xarray.Dataset with radar records, geographic coordinates, and all extra attributes. So, all benefits of xarray can be enjoyed.
>>> print(data)
<xarray.Dataset>
Dimensions:    (azimuth: 366, distance: 920)
Coordinates:
  * azimuth    (azimuth) float32 0.14084807 0.15812683 ... 0.12601277 0.14381513
  * distance   (distance) float64 0.25 0.5 0.75 1.0 ... 229.2 229.5 229.8 230.0
Data variables:
    ZDR        (azimuth, distance) float64 nan nan nan nan ... nan nan nan nan
    longitude  (azimuth, distance) float64 120.2 120.2 120.2 ... 120.6 120.6
    latitude   (azimuth, distance) float64 35.99 35.99 36.0 ... 38.04 38.04
    height     (azimuth, distance) float64 0.1771 0.1792 0.1814 ... 5.218 5.227
Attributes:
    elevation:        0.48339844
    range:            230
    scan_time:        2020-05-17 11:00:28
    site_code:        Z9532
    site_name:        青岛
    site_longitude:   120.23028
    site_latitude:    35.98861
    tangential_reso:  0.25
    nyquist_vel:      8.37801
    task:             VCP21D
For example, it's very convenient to save data as netcdf format.
>>> data.to_netcdf('1.nc')xarray also makes interpolation very convenient.
>>> data.interp(azimuth=np.deg2rad(300), distance=180)
<xarray.Dataset>
Dimensions:    ()
Coordinates:
    azimuth    float64 5.236
    distance   int32 180
Data variables:
    ZDR        float64 0.3553
    longitude  float64 118.5
    latitude   float64 36.8
    height     float64 3.6
Attributes:
    elevation:        0.48339844
    range:            230
    scan_time:        2020-05-17 11:00:28
    site_code:        Z9532
    site_name:        青岛
    site_longitude:   120.23028
    site_latitude:    35.98861
    tangential_reso:  0.25
    nyquist_vel:      8.37801
    task:             VCP21D
For single-tilt data (i.e. files that contain only one elevation angle), cinrad.io.StandardData.merge can merge these files to a file contains full volumetric scan.
Convert data structure defined in this module into pyart.core.Radar is very simple. cinrad.io.export has a function standard_data_to_pyart, which can take cinrad.io.StandardData as input and return pyart.core.Radar as output.
example folder contains a simple demo about this.
cinrad.io.PUP provides functions to decode PUP data. The extracted data can be further used to create PPI.
cinrad.io.SWAN provides similar interface to decode SWAN data.
from cinrad.io import PUP
f = PUP(your_radar_file)
data = f.get_data()cinrad.io.PhasedArrayData provides similar interface to decode level 2 data from phased array radar.
from cinrad.io import PhasedArrayData
f = PhasedArrayData(your_radar_file)
data = f.get_data(0, 40, 'REF')This submodule provides some useful algorithms in radar meteorology. All functions only accept numpy.ndarray as input data. This submodule extends the usage of this program, as these functions can accept customized data rather than only the data decoded by cinrad.io.
For direct computation of decoded data, cinrad.calc provides functions that simplify the process of calculation. For functions contained in this submodule, only a list of reflectivity data is required as the argument.
Code to generate the required list:
r_list = [f.get_data(i, 230, 'REF') for i in f.angleindex_r]
# or
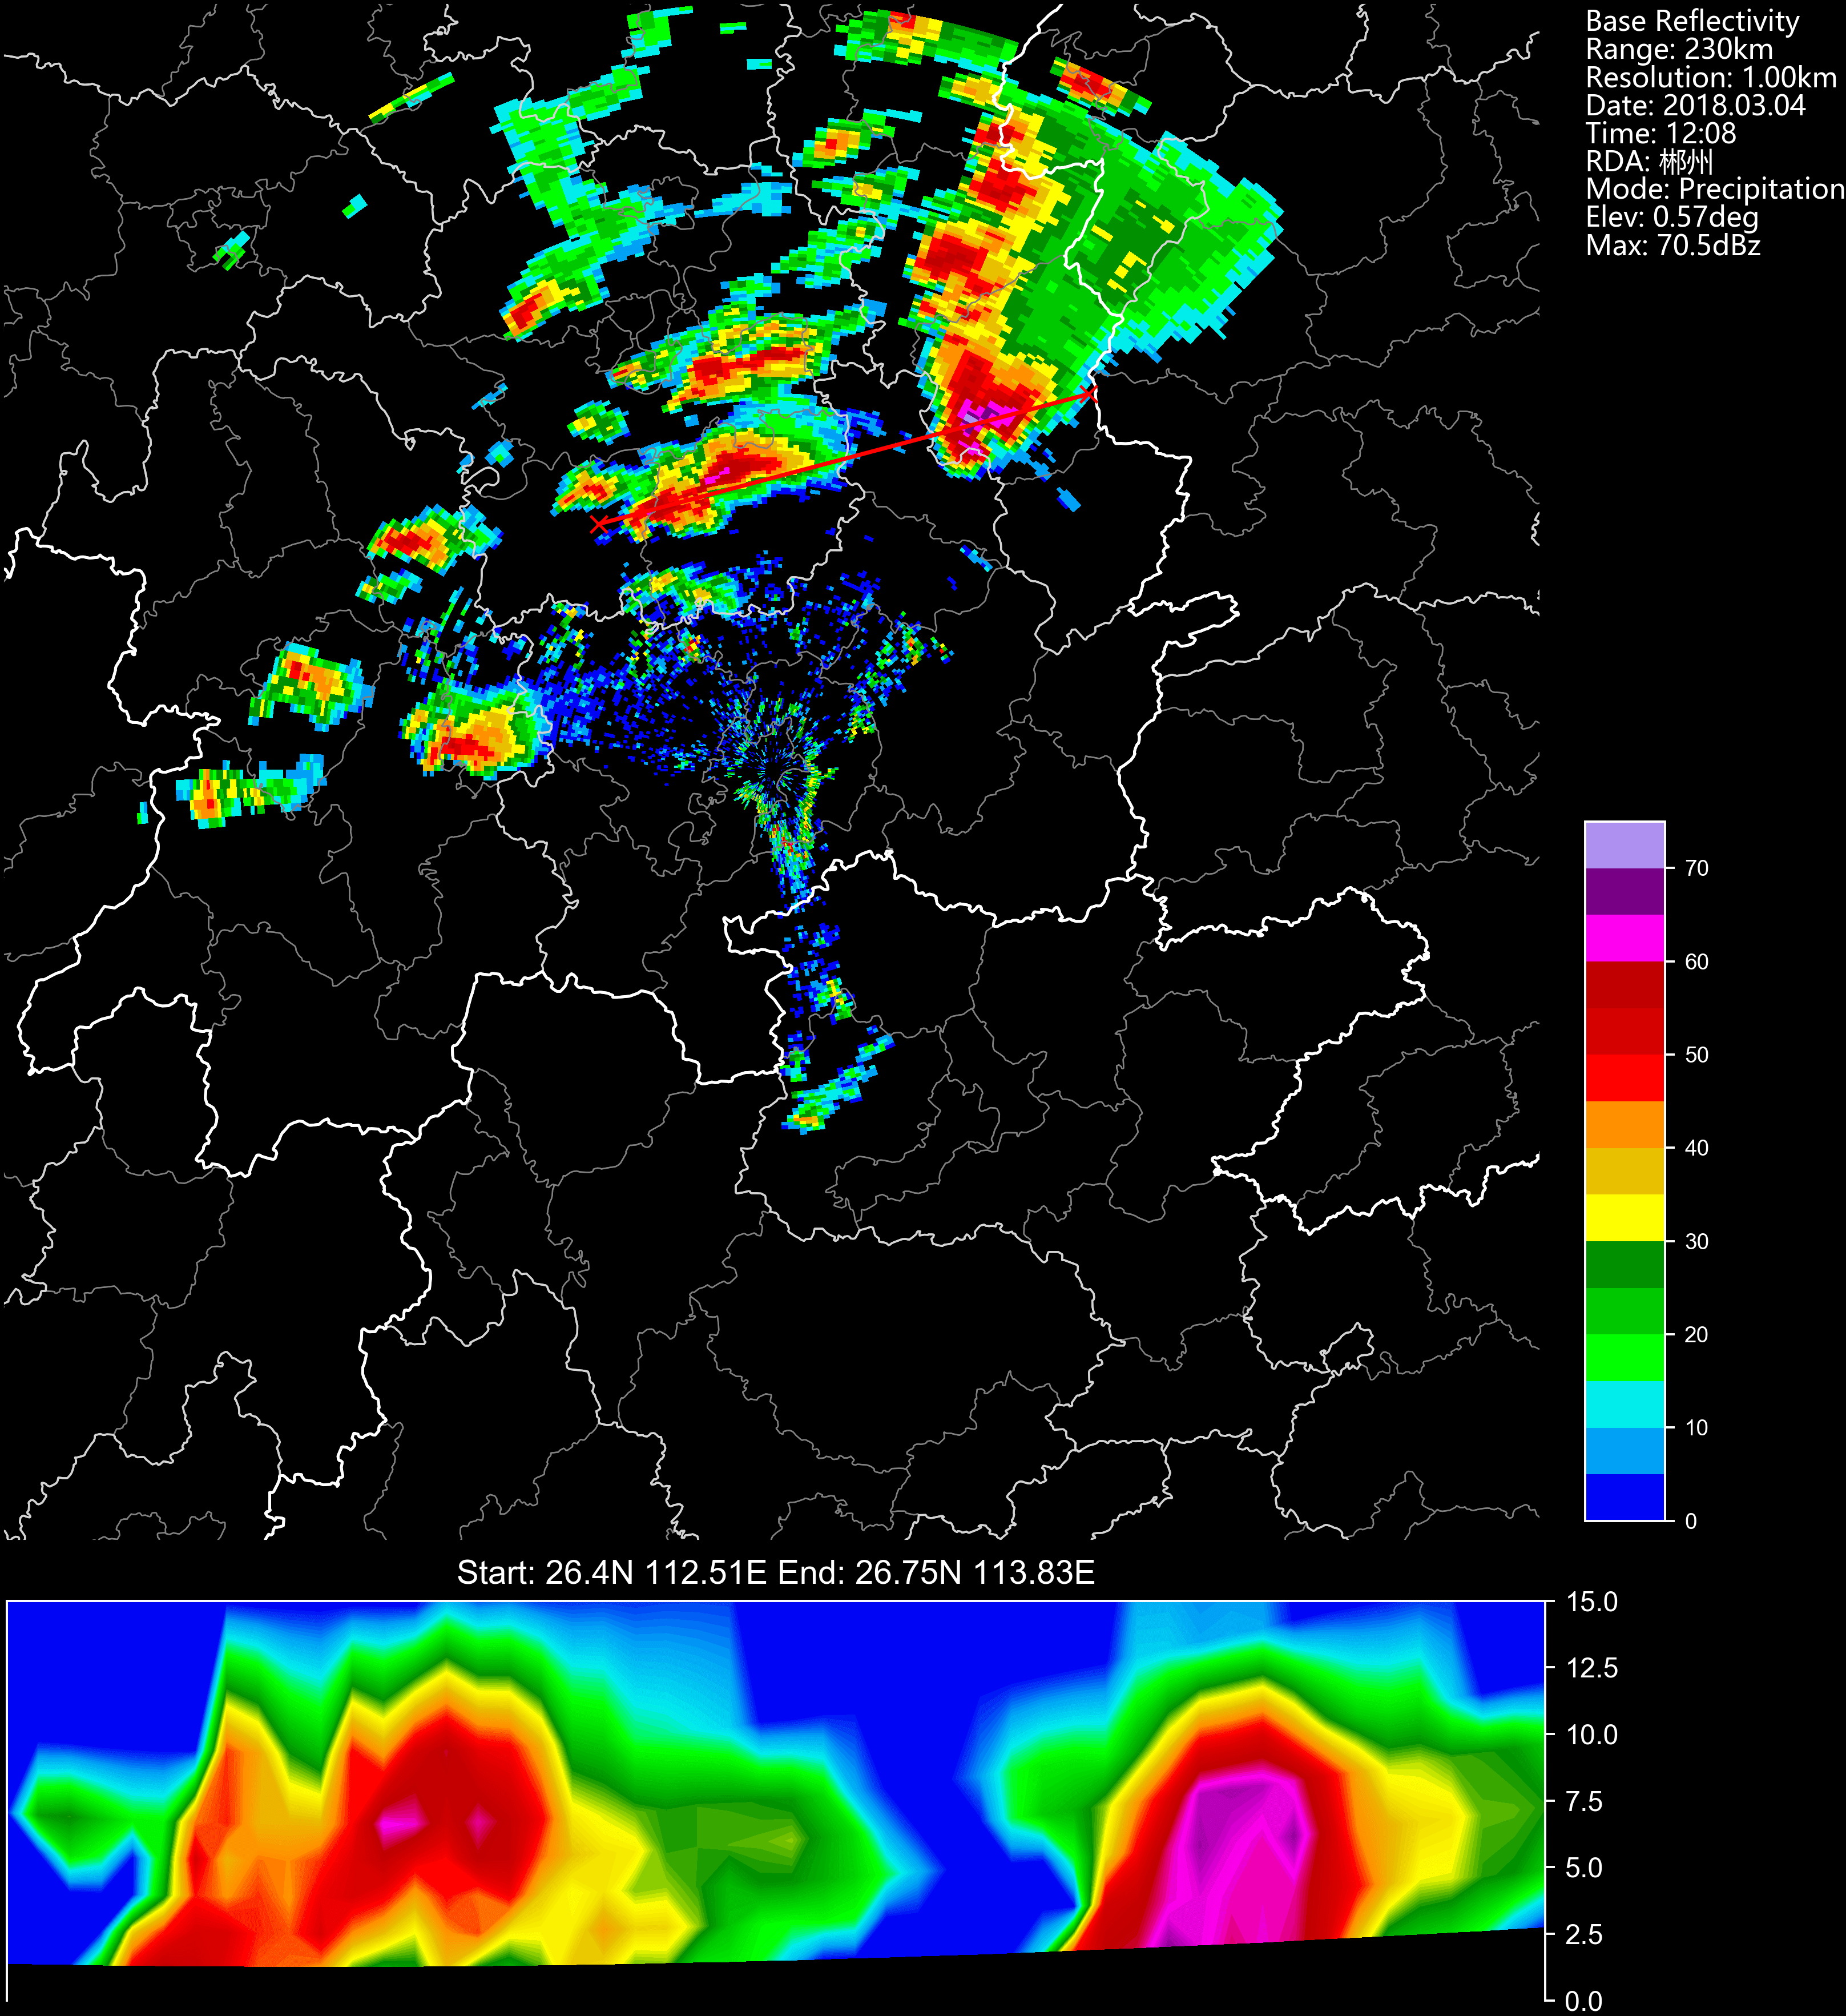
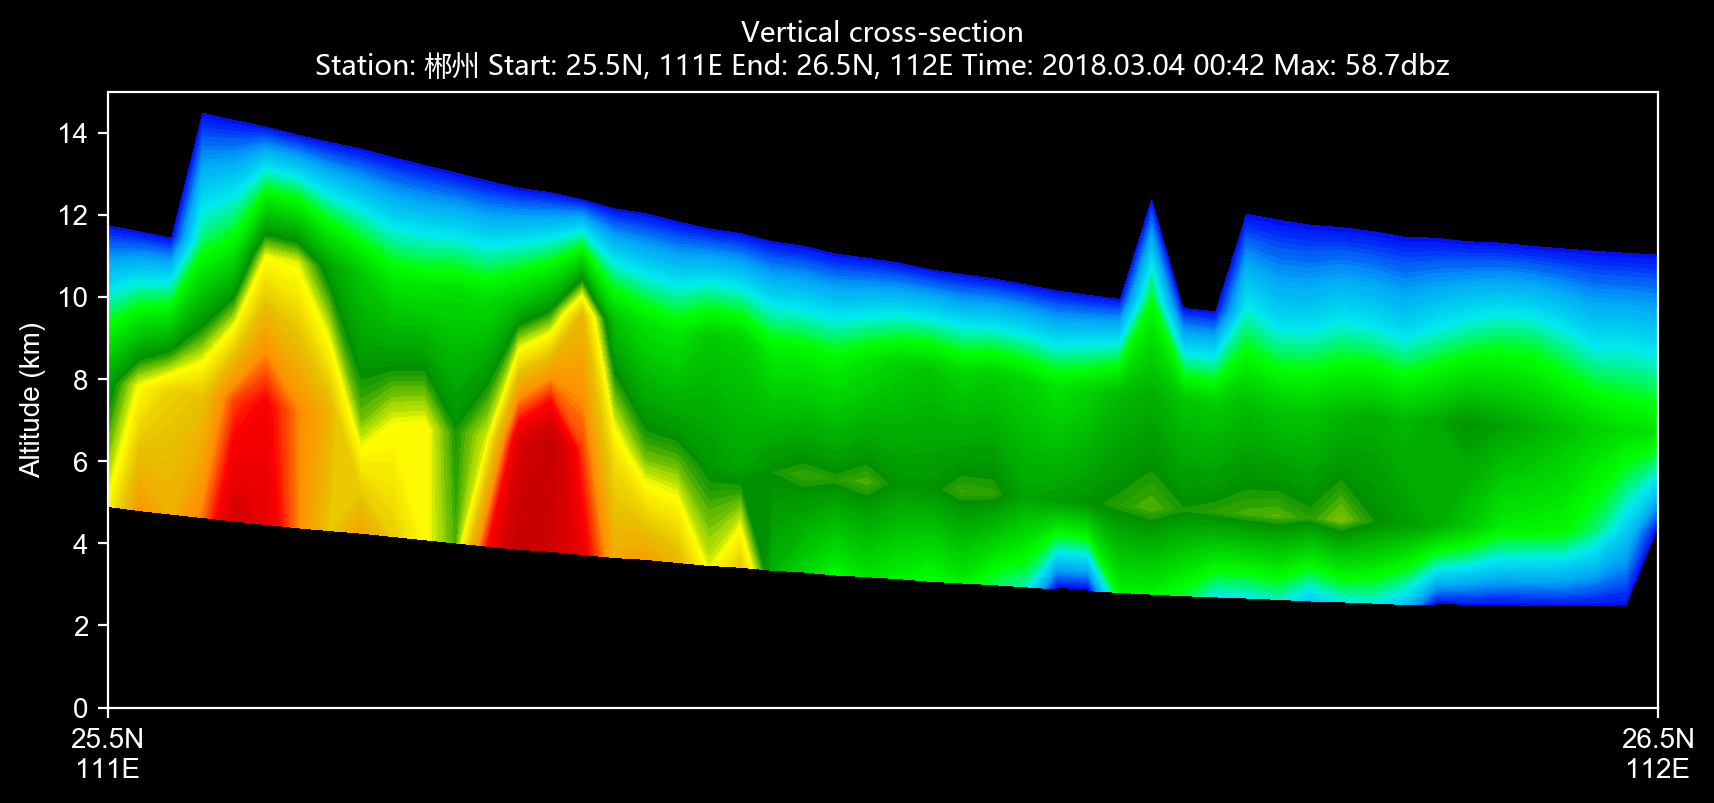
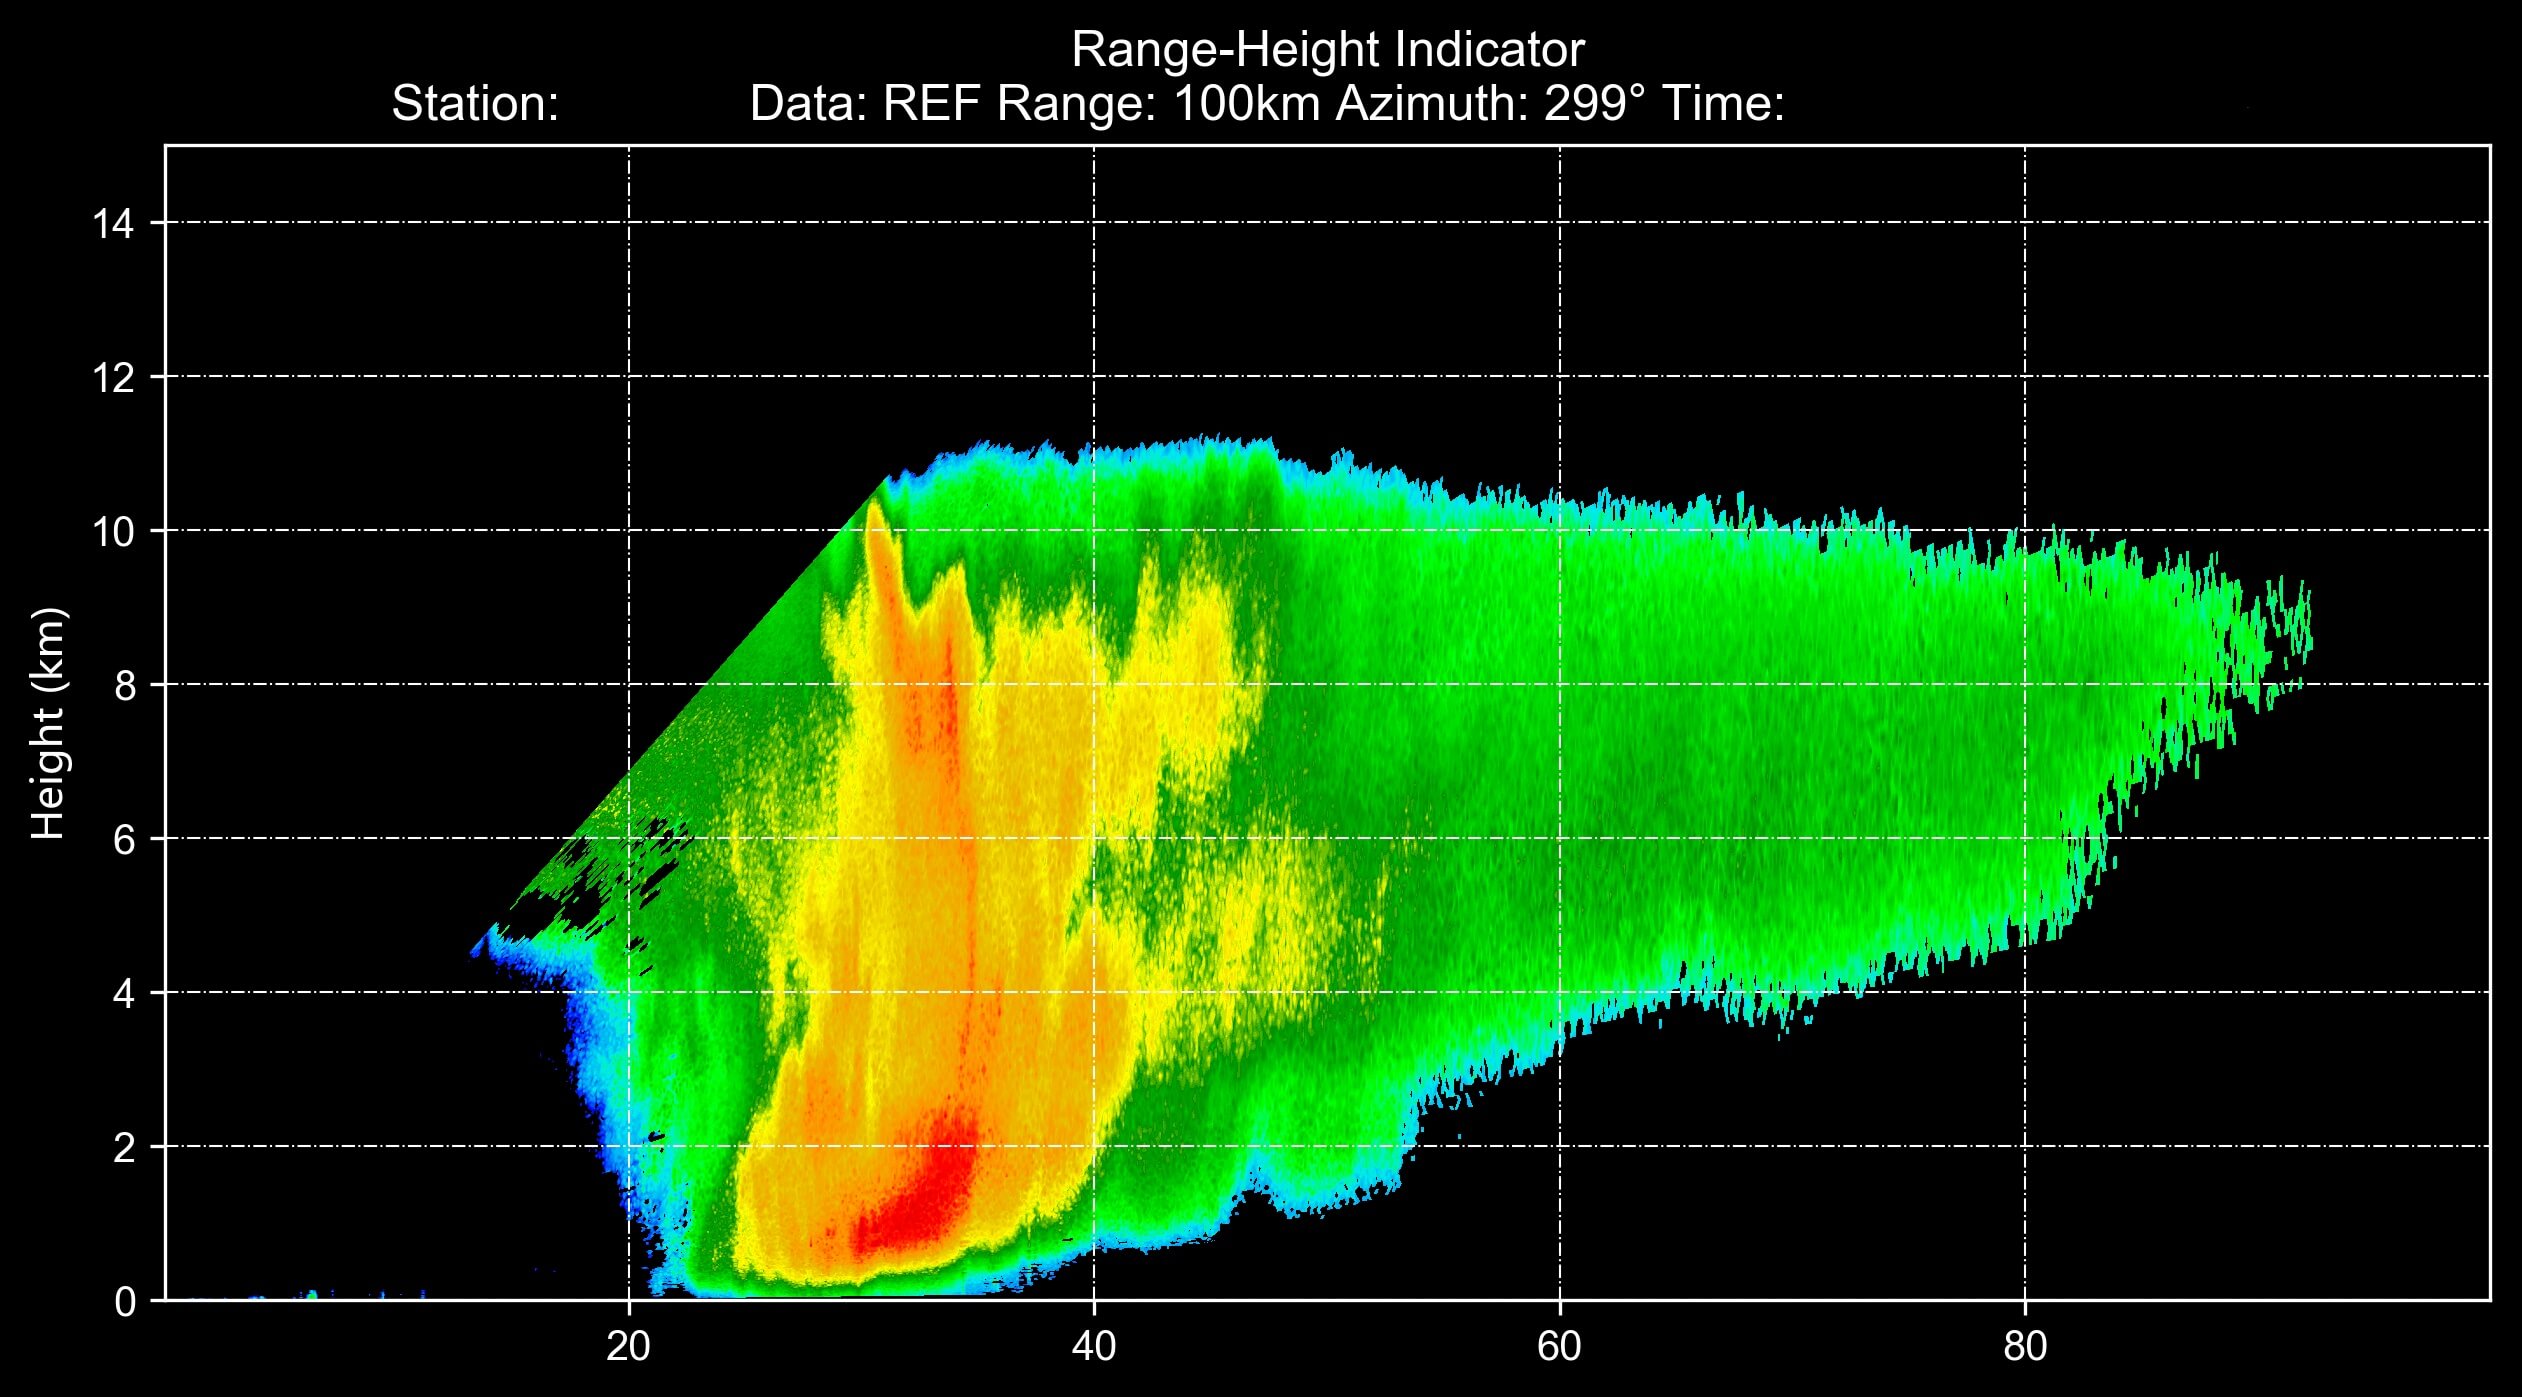
r_list = list(f.iter_tilt(230, 'REF'))cinrad.calc.VCS provides calculation of vertical cross-section for all variables.
import cinrad
from cinrad.visualize import Section
f = cinrad.io.CinradReader(your_radar_file)
rl = [f.get_data(i, 230, 'REF') for i in f.angleindex_r]
vcs = cinrad.calc.VCS(rl)
sec = vcs.get_section(start_cart=(111, 25.5), end_cart=(112, 26.7)) # pass geographic coordinates (longitude, latitude)
sec = vcs.get_section(start_polar=(115, 350), end_polar=(130, 30)) # pass polar coordinates (distance, azimuth)
fig = Section(sec)
fig('D:\\')cinrad.calc.GridMapper can merge different radar scans into a cartesian grid.
cinrad.calc.hydro_class uses algorithm suggested by Dolan to classify hydrometeors into 10 categories. (Requires REF, ZDR, RHO, and KDP)
This submodule provides algorithms to correct raw radar fields.
This function can unwrap the folded velocity using algorithm originated from pyart. (needs C compiler)
import cinrad
#(some codes omitted)
v = f.get_data(1, 230, 'VEL')
v_corrected = cinrad.correct.dealias(v)Visualize the data stored in acceptable format (cinrad.datastruct). It also means that you can using customized data to perform visualization, as long as the data is stored as xarray.Dataset and constructed by the same protocol (variables naming conventions, data coordinates and dimensions, etc.) For further information about this method, please see the examples contained in example folder.
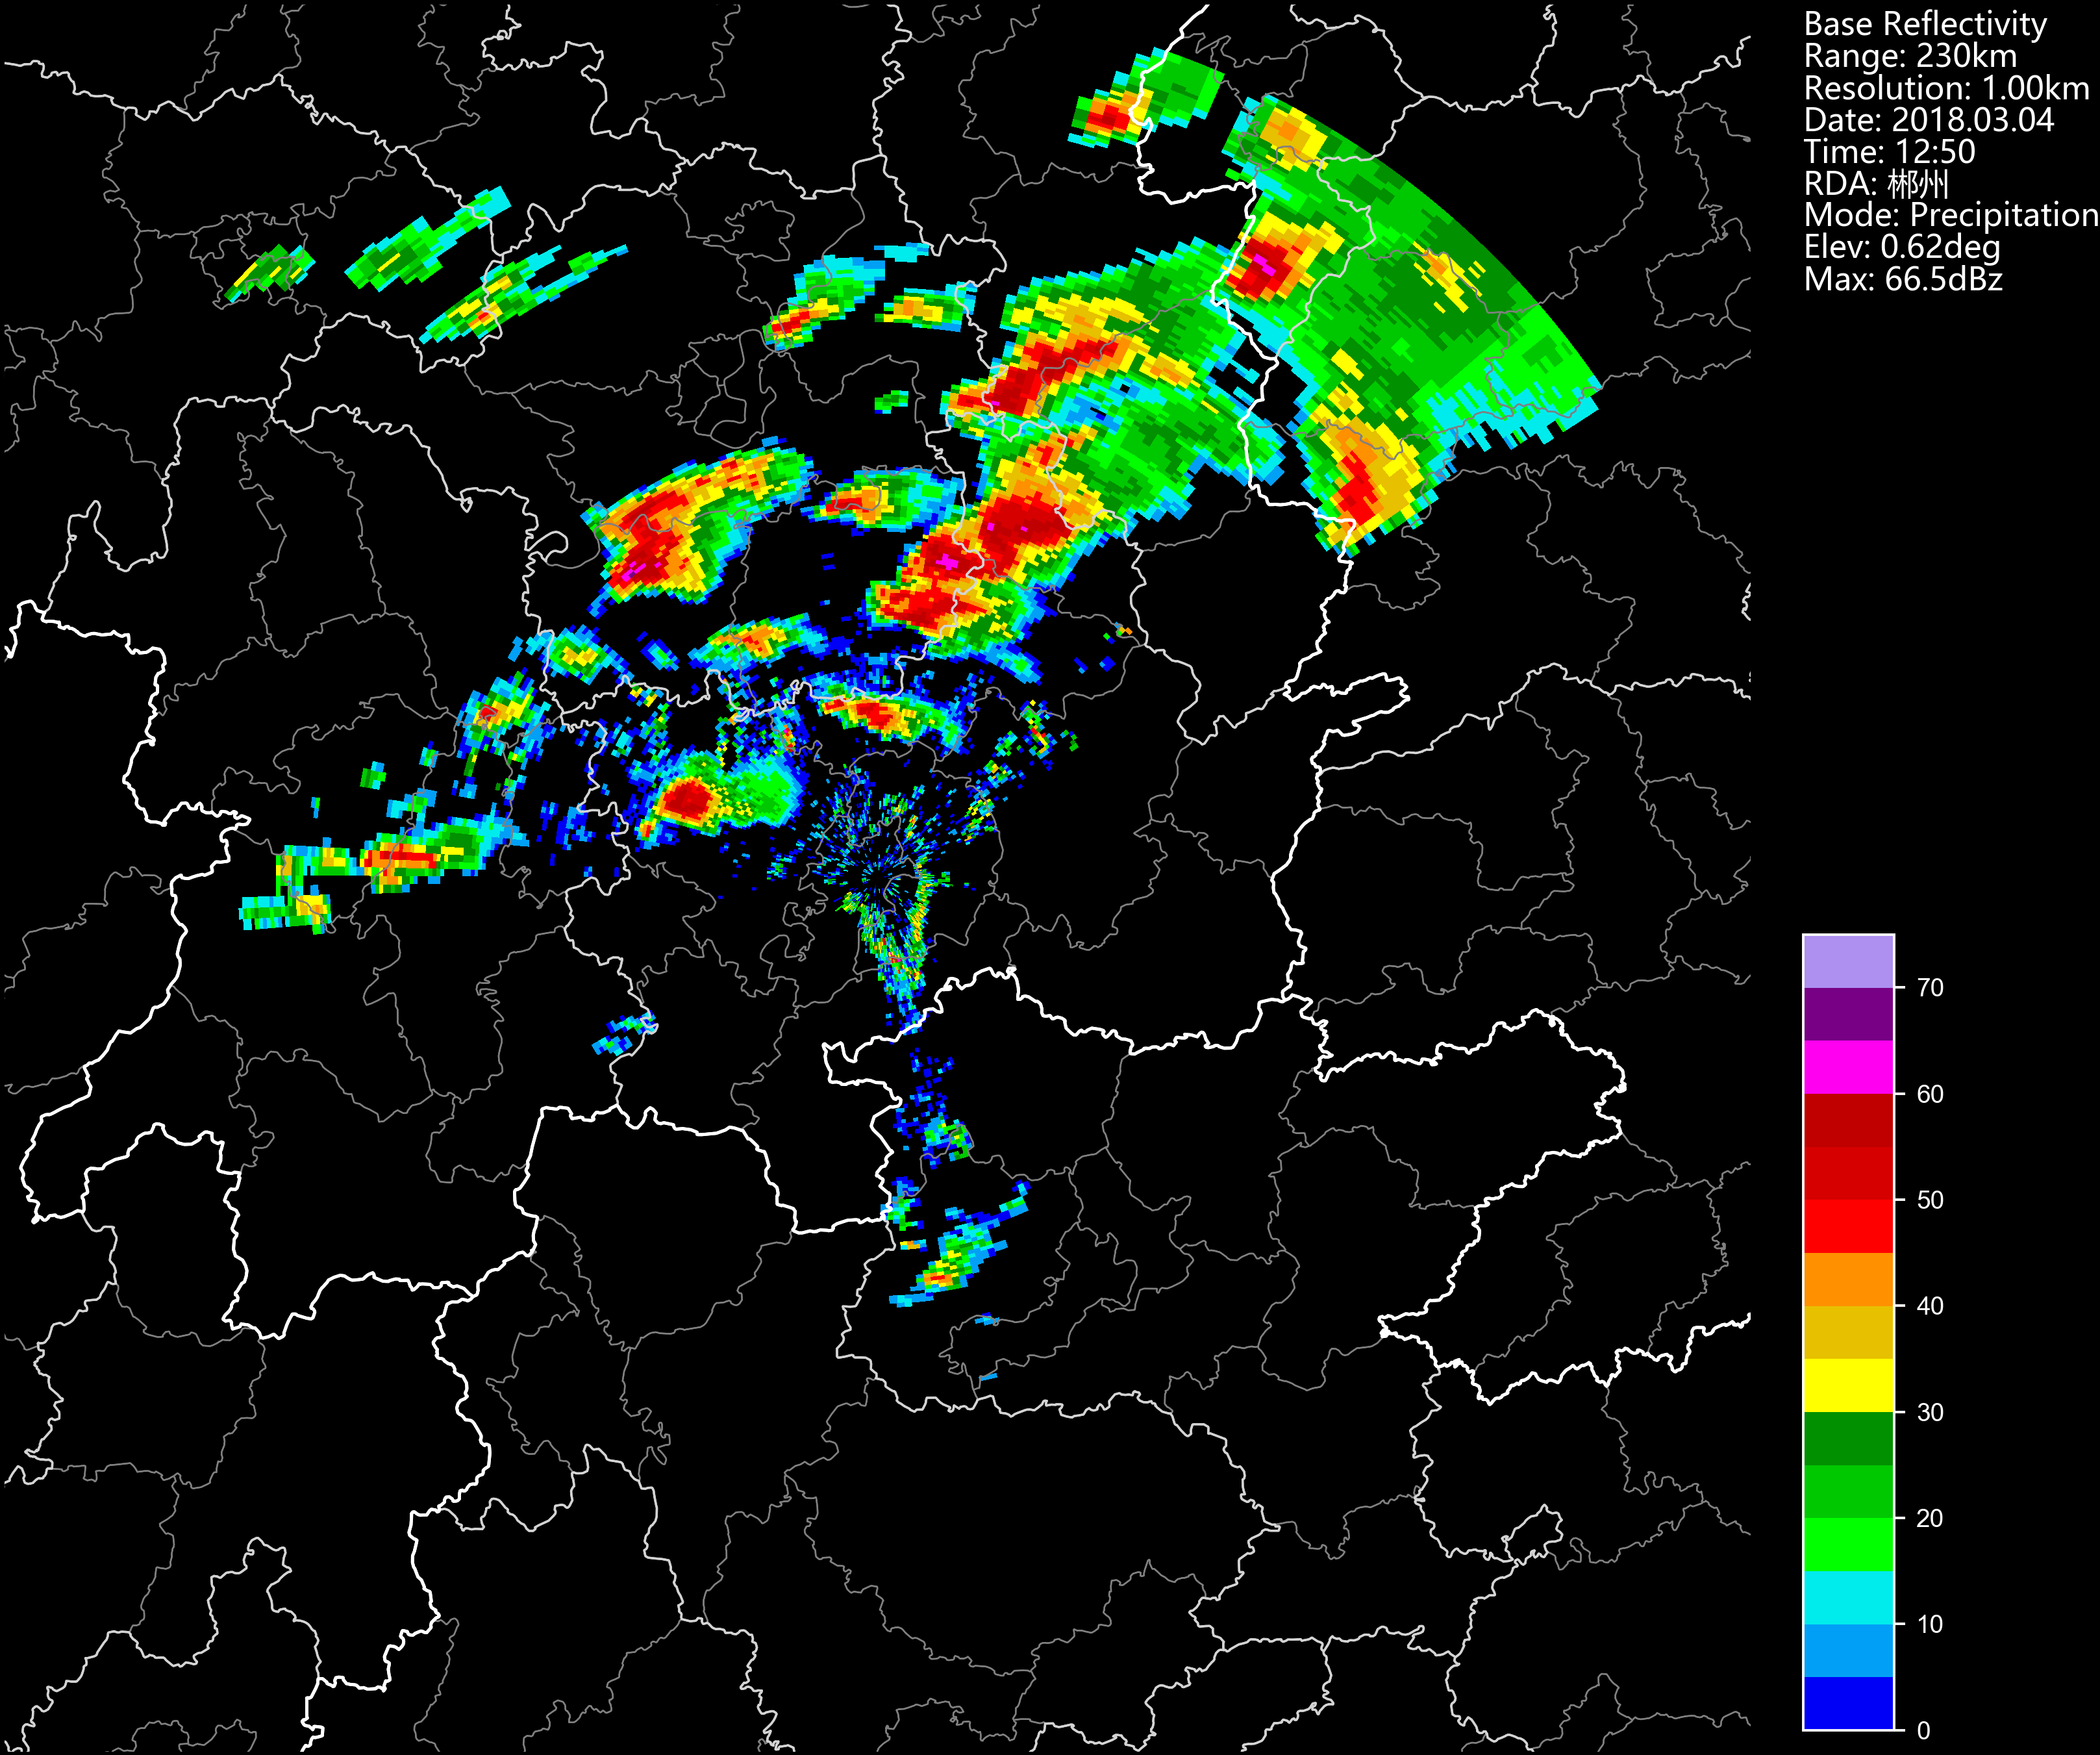
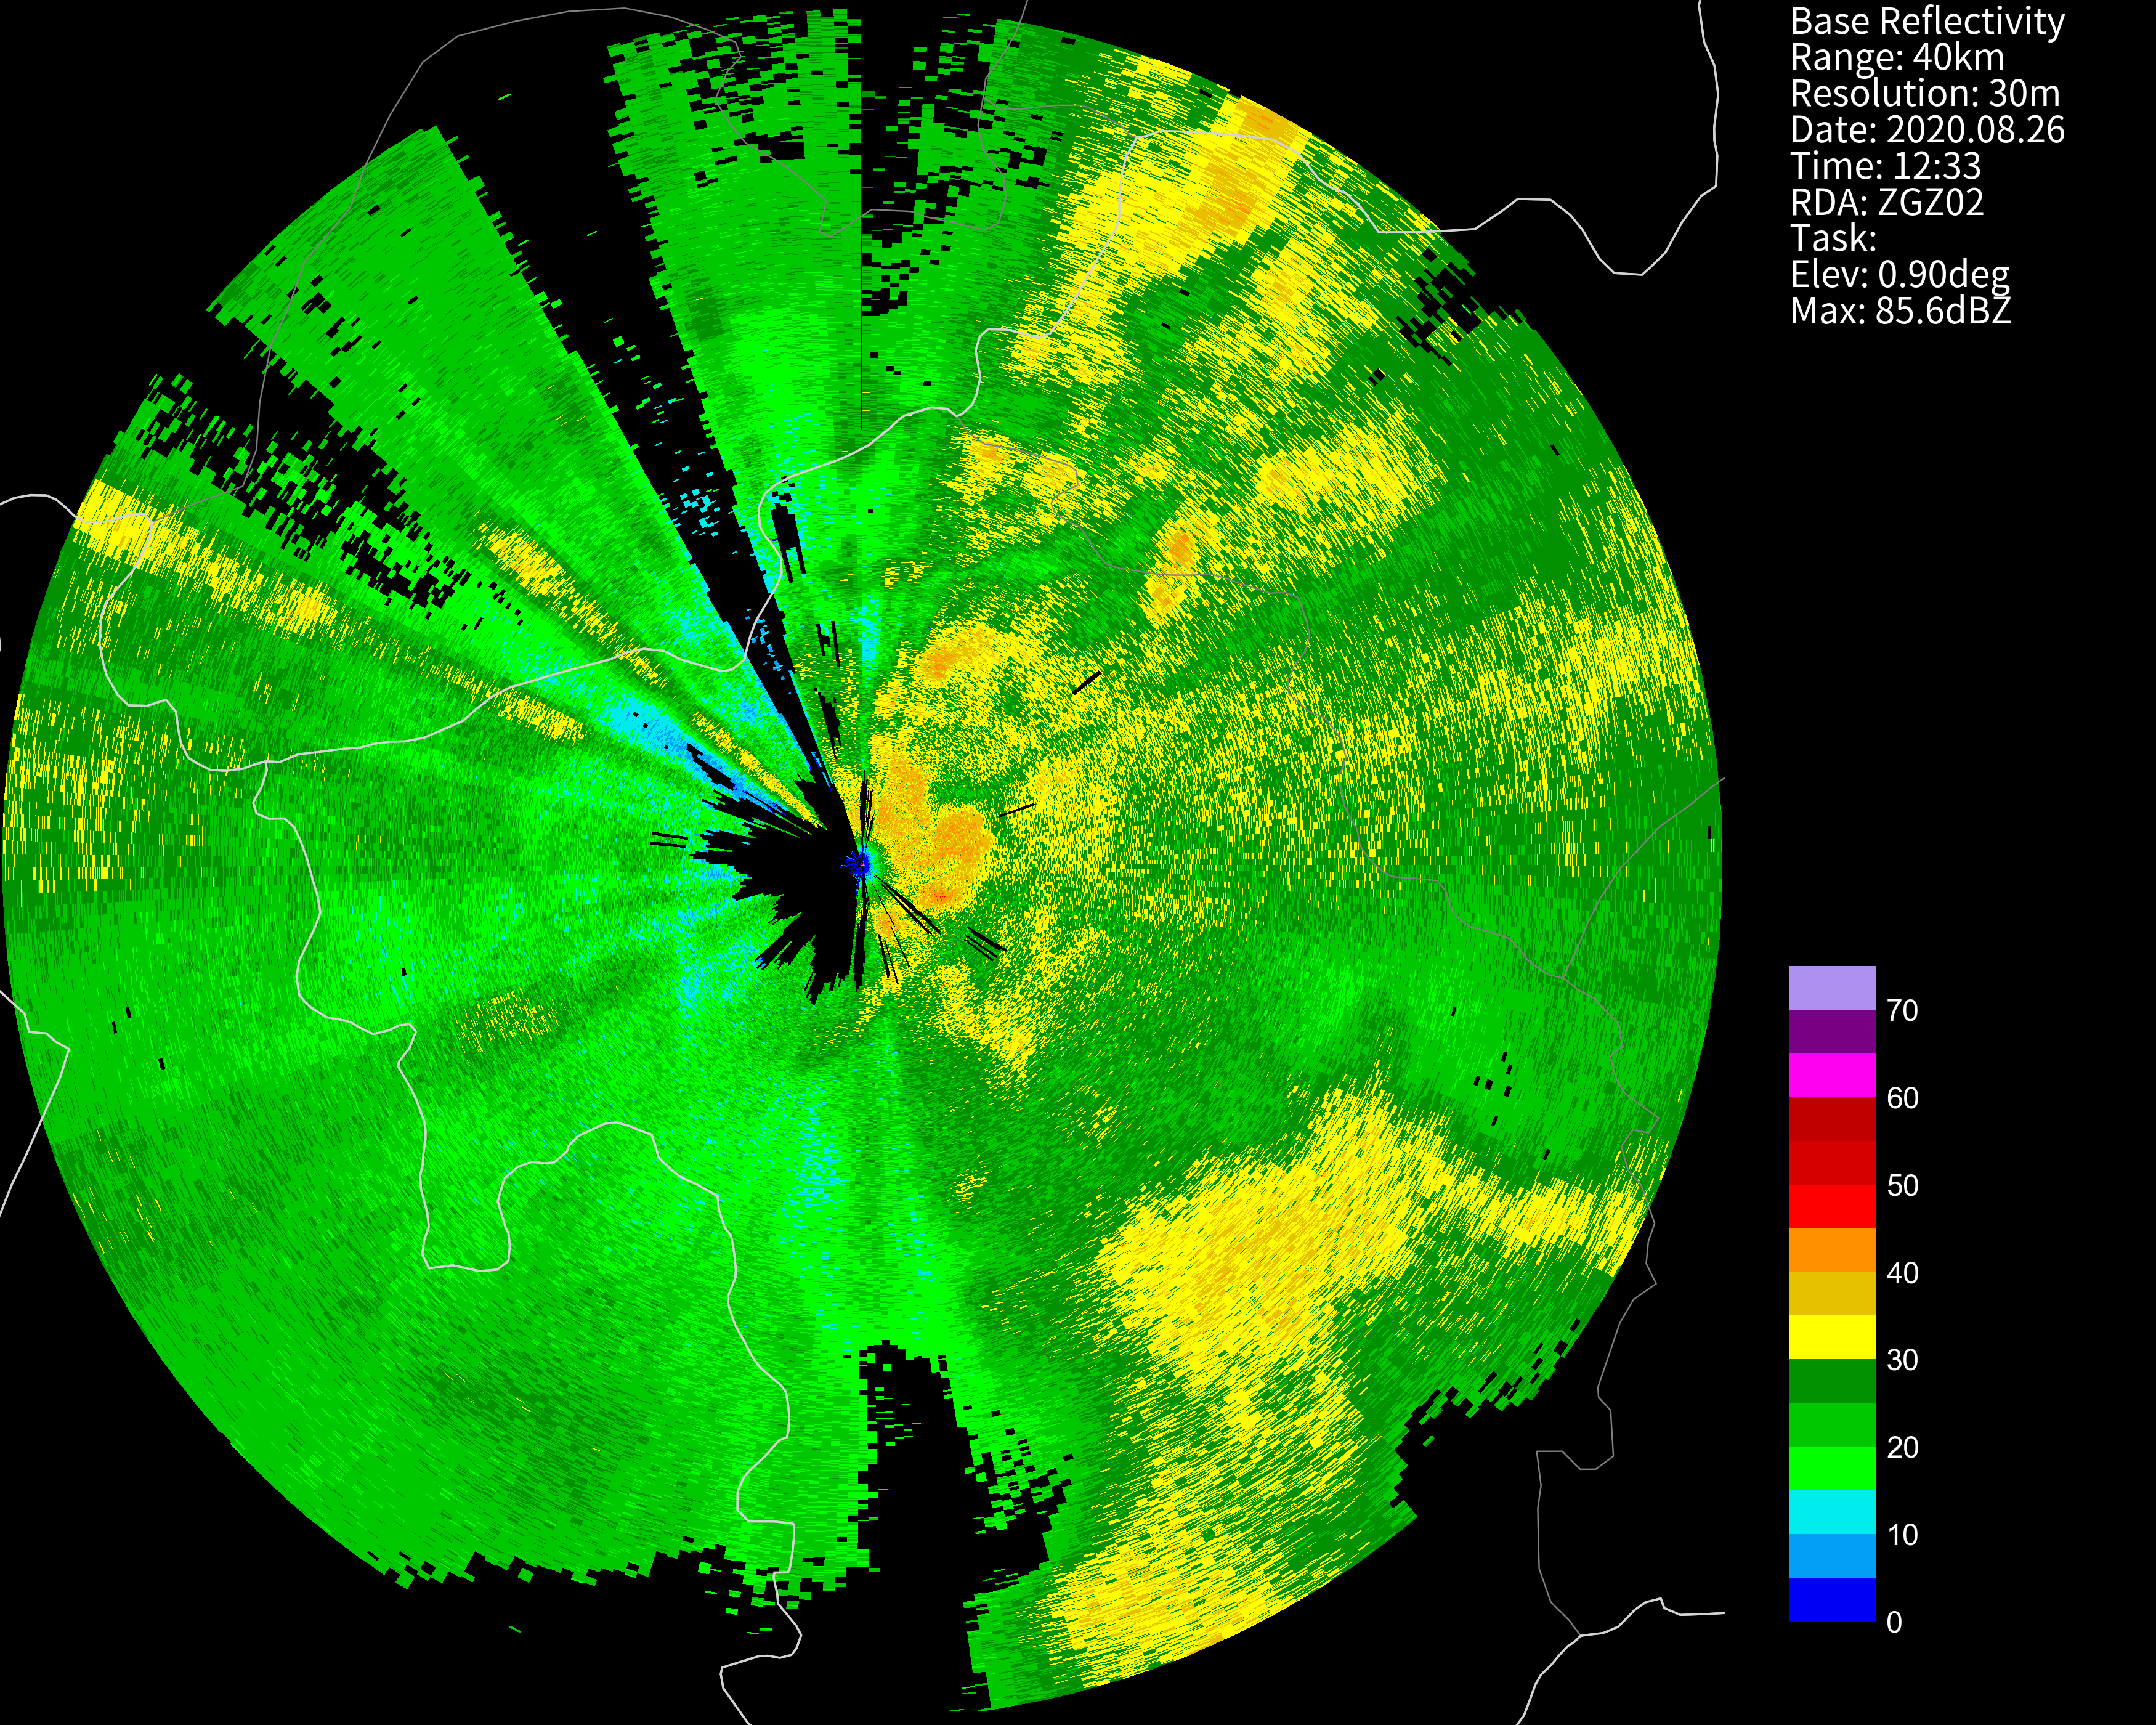
from cinrad.visualize import PPI
fig = PPI(R) #Plot PPI
fig('D:\\') #Pass the path to save the fig
from cinrad.visualize import Section
fig = Section(Slice_) #Plot VCS
fig('D:\\')
The path passed into the class can either be the folder path or the file path. Also, if no path is passed, the figure will be saved at the folder named PyCINRAD in the home folder (e.g. C:\Users\tom).
The summary of args that can be passed into PPI are listed as follows.
| arg | function |
|---|---|
cmap |
colormaps used for plotting |
norm |
norm used for plotting |
nlabel |
number of labels on the colorbar |
label |
labels on the colorbar |
highlight |
highlight area of input name |
dpi |
dpi of figure |
extent |
area to plot e.g. extent=[90, 91, 29, 30] |
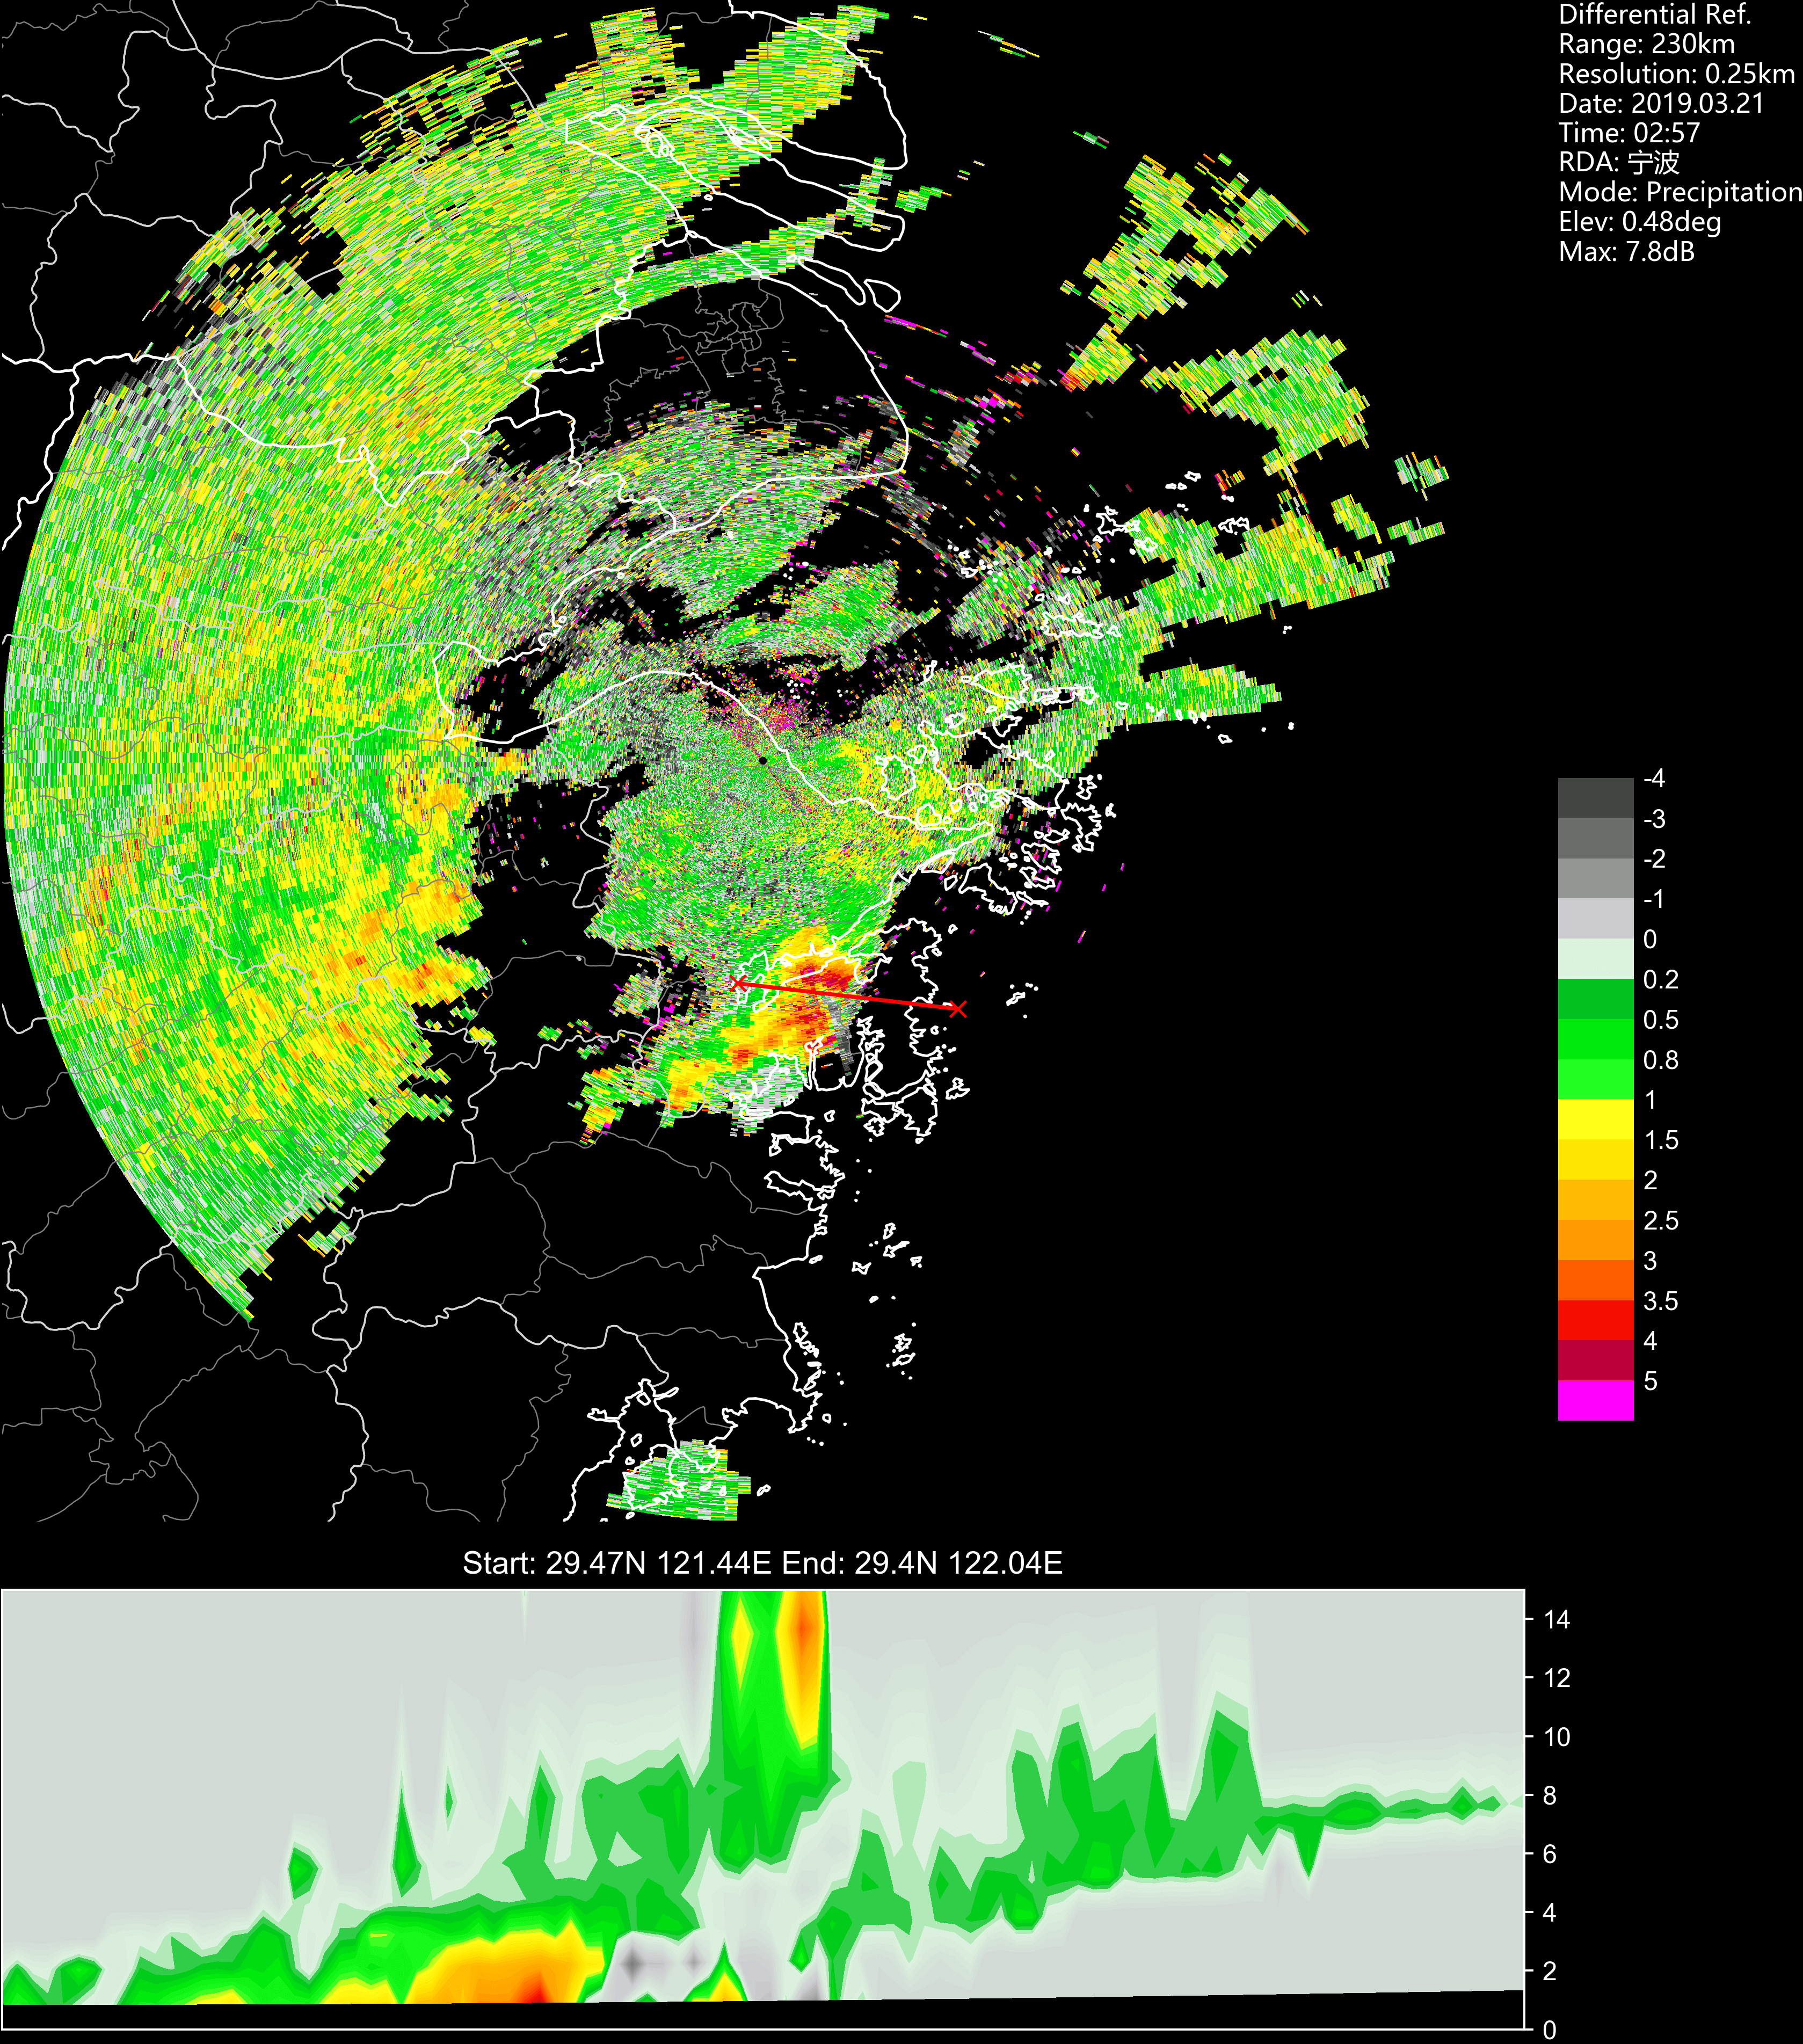
section |
cross-section data to ppi plot |
style |
control the background color black or white |
add_city_names |
annotate name of city on the plot |
Beside args, class PPI has some other auxiliary plotting functions.
Plot range rings on the PPI plot.
Plot VCS section under the PPI plot.
This function is very similar to vcs argument of class PPI, but the range of y-axis can be adjusted only by this function.
Plot PUP STI product on the current PPI map, including past positions, current position, and forecast positions.
If you use PyCINRAD in your paper, please cite PyCINRAD using the DOI below.
- Recognition and Analysis of Biological Echo Using WSR-88D Dual-polarization Weather Radar in Nanhui of Shanghai doi: 10.16765/j.cnki.1673-7148.2019.03.015
The hydrometeor classfication algorithm comes from Dolan, B., S. A. Rutledge, S. Lim, V. Chandrasekar, and M. Thurai, 2013: A Robust C-Band Hydrometeor Identification Algorithm and Application to a Long-Term Polarimetric Radar Dataset. J. Appl. Meteor. Climatol., 52, 2162–2186, https://doi.org/10.1175/JAMC-D-12-0275.1.
If you are interested in this program, you can join the developers of this program. Any contribution is appreciated!
If you have questions or advise about this program, you can create an issue or email me at [email protected].