The R code (available here) was written in January 2021 to analyze the PM10 pollution in Friuli Venezia Giulia, a region in the North-East of Italy. The results were analyzed in an article written for the Messaggero Veneto, a local newspaper. Here's the link to the article, though I have to say that it's paywalled.
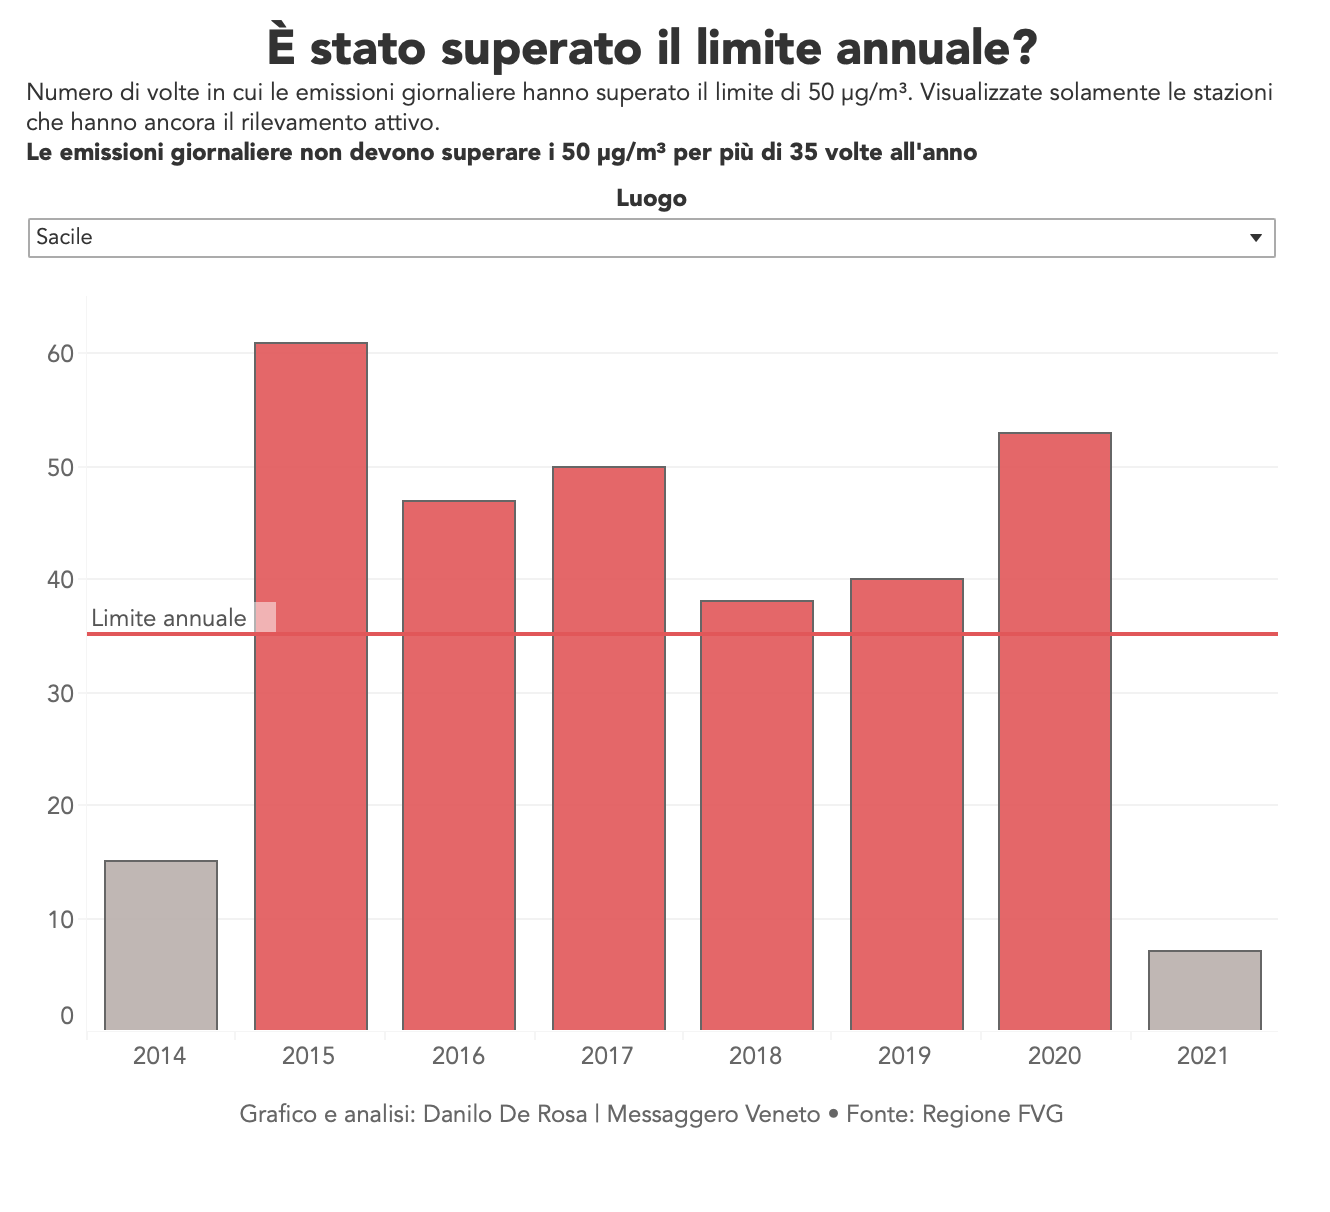
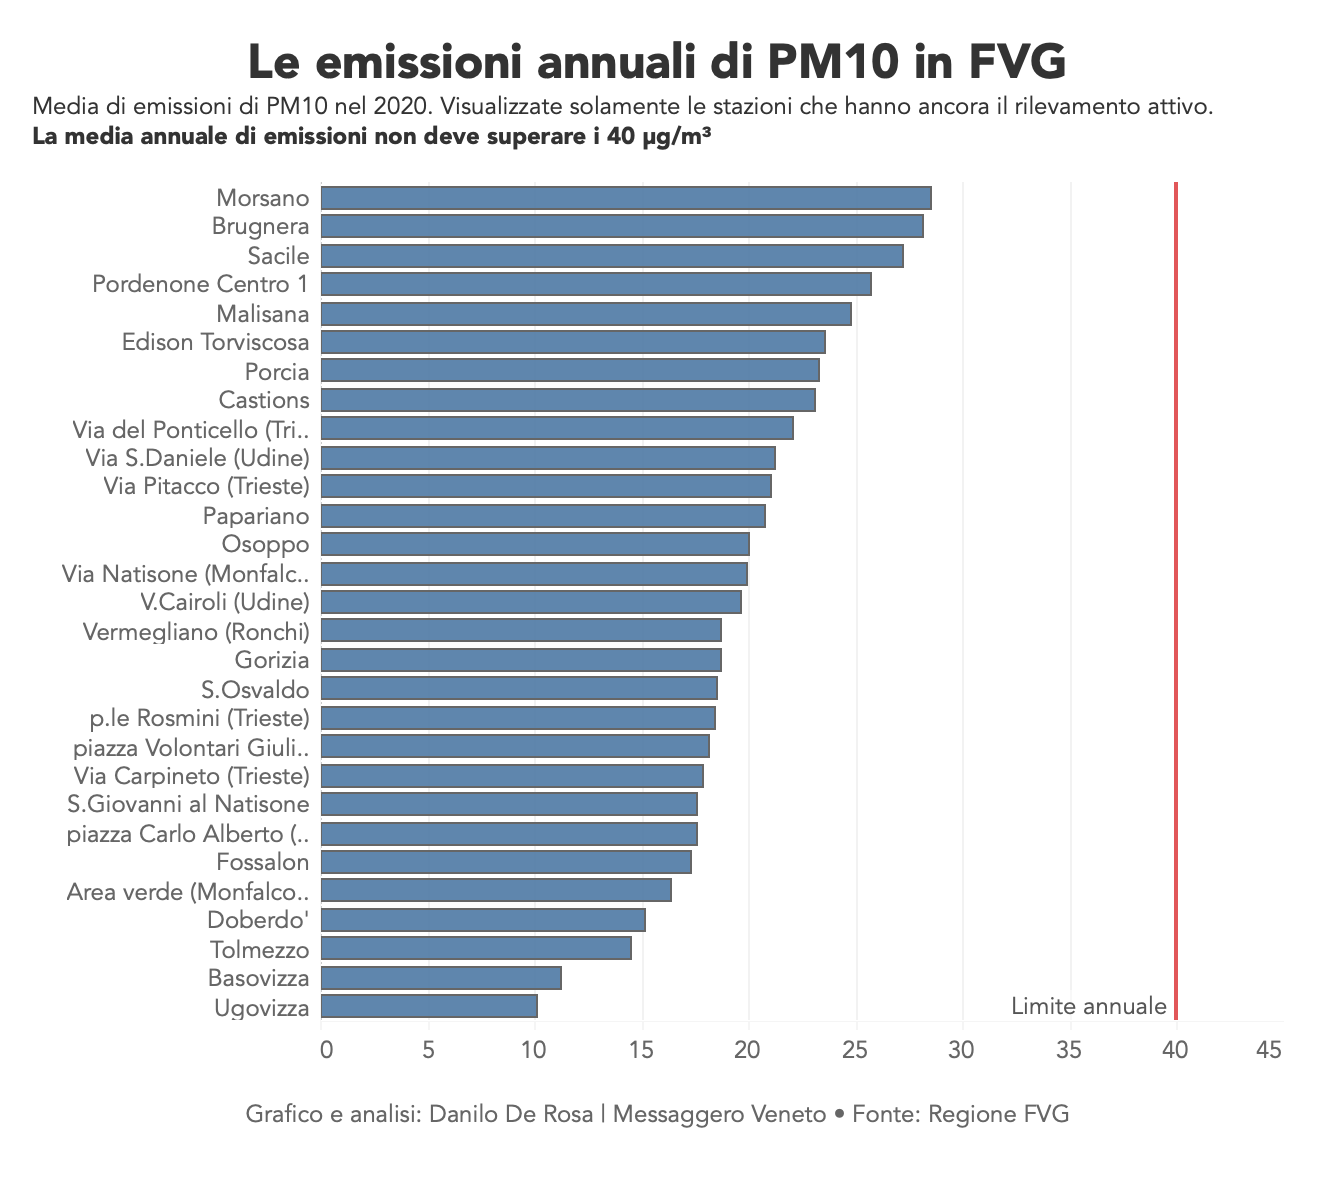
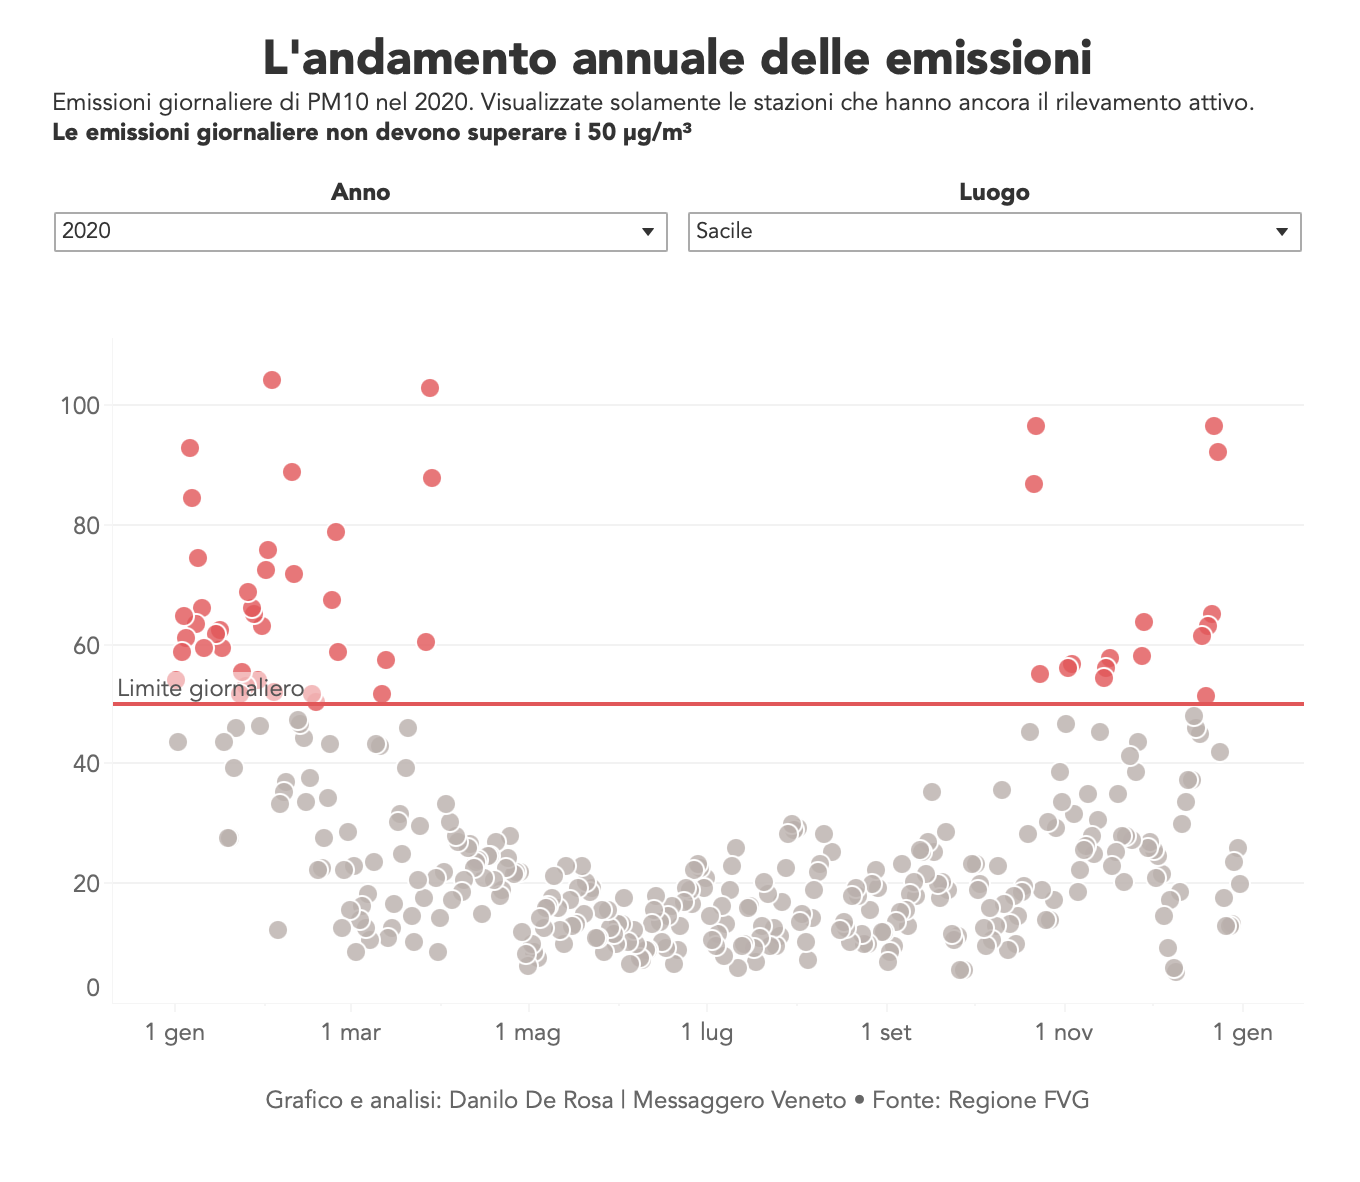
Below you can find four charts that I've made for this project. The first one was made in R and refined in Illustrator, while the other 3 were made in Tableau (by clicking on each one of the three you'll be redirect to the interactive version).