danopstech / starlink Goto Github PK
View Code? Open in Web Editor NEW📈 Starlink Monitoring System. Measuring the performance of your Starlink internet connection
License: GNU General Public License v3.0
📈 Starlink Monitoring System. Measuring the performance of your Starlink internet connection
License: GNU General Public License v3.0


Describe the bug
The speed test dashboard shows a worst speed of -133MB/s ... which is interesting?!

This logs like it might correlate with error logs:
speedtest_exporter_1 | time="2021-10-01T11:52:37Z" level=error msg="failed to carry out upload test: Post "http://speedtest.tor.fibrestream.ca:8080/speedtest/upload.php\": write tcp 172.18.0.2:51928->162.250.172.153:8080: use of closed network connection"
speedtest_exporter_1 | time="2021-10-01T16:53:27Z" level=error msg="failed to carry out upload test: Post "http://speedtest.us-east-02.greenhousedata.com:8080/speedtest/upload.php\": EOF"
Expected behavior
Failed speed tests should probably just be ignored from a stats perspective?
Additional context
Windows host, running latest image.
Installed on docker and all containers running. I can't access localhost:3000 and when looking at grafana logs:
GF_PATHS_DATA='/var/lib/grafana' is not writable.
mkdir: can't create directory '/var/lib/grafana/plugins': Permission denied
You may have issues with file permissions, more information here: http://docs.grafana.org/installation/docker/#migrate-to-v51-or-later
Raspberry Pi 4 B
ietpi@DietPi:~/starlink$ sudo docker-compose pull && docker-compose up --remove-orphan
Pulling starlink_exporter ... done
Pulling speedtest_exporter ... done
Pulling blackbox ... done
Pulling prometheus ... done
Pulling grafana ... done
Creating starlink_starlink_exporter_1 ... done
Creating starlink_grafana_1 ... done
Creating starlink_speedtest_exporter_1 ... done
Creating starlink_prometheus_1 ... done
Creating starlink_blackbox_1 ... done
Attaching to starlink_starlink_exporter_1, starlink_speedtest_exporter_1, starlink_blackbox_1, starlink_prometheus_1, starlink_grafana_1
blackbox_1 | level=info ts=2022-06-12T03:44:52.105Z caller=main.go:224 msg="Starting blackbox_exporter" version="(version=0.19.0, branch=HEAD, revision=5d575b88eb12c65720862e8ad2c5890ba33d1ed0)"
blackbox_1 | level=info ts=2022-06-12T03:44:52.105Z caller=main.go:225 build_context="(go=go1.16.4, user=root@2b0258d5a55a, date=20210510-12:57:25)"
blackbox_1 | level=info ts=2022-06-12T03:44:52.106Z caller=main.go:237 msg="Loaded config file"
blackbox_1 | level=info ts=2022-06-12T03:44:52.108Z caller=main.go:385 msg="Listening on address" address=:9115
blackbox_1 | level=info ts=2022-06-12T03:44:52.109Z caller=tls_config.go:191 msg="TLS is disabled." http2=false
prometheus_1 | level=info ts=2022-06-12T03:44:53.695Z caller=main.go:388 msg="No time or size retention was set so using the default time retention" duration=15d
prometheus_1 | level=info ts=2022-06-12T03:44:53.698Z caller=main.go:426 msg="Starting Prometheus" version="(version=2.28.0, branch=HEAD, revision=ff58416a0b0224bab1f38f949f7d7c2a0f658940)"
prometheus_1 | level=info ts=2022-06-12T03:44:53.698Z caller=main.go:431 build_context="(go=go1.16.5, user=root@1d5eaa28fd24, date=20210621-15:36:14)"
prometheus_1 | level=info ts=2022-06-12T03:44:53.698Z caller=main.go:432 host_details="(Linux 5.15.32-v8+ #1538 SMP PREEMPT Thu Mar 31 19:40:39 BST 2022 aarch64 d1cb22b4015e (none))"
prometheus_1 | level=info ts=2022-06-12T03:44:53.698Z caller=main.go:433 fd_limits="(soft=1048576, hard=1048576)"
prometheus_1 | level=info ts=2022-06-12T03:44:53.698Z caller=main.go:434 vm_limits="(soft=unlimited, hard=unlimited)"
prometheus_1 | level=info ts=2022-06-12T03:44:53.716Z caller=web.go:541 component=web msg="Start listening for connections" address=0.0.0.0:9090
prometheus_1 | level=info ts=2022-06-12T03:44:53.722Z caller=main.go:807 msg="Starting TSDB ..."
prometheus_1 | ts=2022-06-12T03:44:53.731Z caller=log.go:124 component=web level=info msg="TLS is disabled." http2=false
prometheus_1 | level=info ts=2022-06-12T03:44:53.750Z caller=head.go:780 component=tsdb msg="Replaying on-disk memory mappable chunks if any"
prometheus_1 | level=info ts=2022-06-12T03:44:53.750Z caller=head.go:794 component=tsdb msg="On-disk memory mappable chunks replay completed" duration=12.259µs
prometheus_1 | level=info ts=2022-06-12T03:44:53.750Z caller=head.go:800 component=tsdb msg="Replaying WAL, this may take a while"
prometheus_1 | level=info ts=2022-06-12T03:44:53.752Z caller=head.go:854 component=tsdb msg="WAL segment loaded" segment=0 maxSegment=0
prometheus_1 | level=info ts=2022-06-12T03:44:53.752Z caller=head.go:860 component=tsdb msg="WAL replay completed" checkpoint_replay_duration=227.649µs wal_replay_duration=1.14937ms total_replay_duration=2.325518ms
prometheus_1 | level=info ts=2022-06-12T03:44:53.758Z caller=main.go:834 fs_type=EXT4_SUPER_MAGIC
prometheus_1 | level=info ts=2022-06-12T03:44:53.759Z caller=main.go:837 msg="TSDB started"
prometheus_1 | level=info ts=2022-06-12T03:44:53.759Z caller=main.go:964 msg="Loading configuration file" filename=/etc/prometheus/prometheus.yml
prometheus_1 | level=info ts=2022-06-12T03:44:53.765Z caller=main.go:995 msg="Completed loading of configuration file" filename=/etc/prometheus/prometheus.yml totalDuration=6.057185ms remote_storage=4.518µs web_handler=1.76µs query_engine=2.815µs scrape=3.582871ms scrape_sd=178.092µs notify=2.333µs notify_sd=6.871µs rules=4.018µs
prometheus_1 | level=info ts=2022-06-12T03:44:53.766Z caller=main.go:779 msg="Server is ready to receive web requests."
starlink_exporter_1 | time="2022-06-12T03:44:53Z" level=fatal msg="could not start exporter: error creating underlying gRPC connection to starlink dish: context deadline exceeded"
starlink_exporter_1 | time="2022-06-12T03:44:58Z" level=fatal msg="could not start exporter: error creating underlying gRPC connection to starlink dish: context deadline exceeded"
starlink_starlink_exporter_1 exited with code 1
starlink_exporter_1 | time="2022-06-12T03:45:02Z" level=fatal msg="could not start exporter: error creating underlying gRPC connection to starlink dish: context deadline exceeded"
starlink_starlink_exporter_1 exited with code 1
starlink_exporter_1 | time="2022-06-12T03:45:07Z" level=fatal msg="could not start exporter: error creating underlying gRPC connection to starlink dish: context deadline exceeded"
starlink_starlink_exporter_1 exited with code 1
starlink_exporter_1 | time="2022-06-12T03:45:11Z" level=fatal msg="could not start exporter: error creating underlying gRPC connection to starlink dish: context deadline exceeded"
starlink_starlink_exporter_1 exited with code 1
starlink_exporter_1 | time="2022-06-12T03:45:17Z" level=fatal msg="could not start exporter: error creating underlying gRPC connection to starlink dish: context deadline exceeded"
starlink_starlink_exporter_1 exited with code 1
^CGracefully stopping... (press Ctrl+C again to force)
Stopping starlink_prometheus_1 ... done
Stopping starlink_blackbox_1 ... done
Stopping starlink_speedtest_exporter_1 ... done
Stopping starlink_grafana_1 ... done
Stopping starlink_starlink_exporter_1 ... done
My early tests of the beta show enormous amounts of unneeded bufferbloat on the starlink uplink, downlink, and the wifi. To me, this is an easily fixable starlink problem, assuming they are using linux. Add sch_cake on the outbound pr eferably with backpressure from "BQL"( https://blog.linuxplumbersconf.org/2011/ocw/sessions/171 ), or using cake's built in shaper ( https://lwn.net/Articles/758353/ ) , add fq_codel ( https://tools.ietf.org/html/rfc8290 ) or something similar to SQM at the head-end, and fq_codel for wifi ( https://www.usenix.org/conference/atc17/technical-sessions/presentation/hoilan-jorgesen .
All these have standard APIs in the linux kernel - and would take, like, a week, to implement on the dishy for someone with clue. Well, the bloat on the wifi side is harder to fix (only support for this on 4 chipsets) but the wifi AQL and fq_codel APIs have long been in linux. ( https://lwn.net/Articles/705884/ )
The alternative... for consistently low latency under normal conditions is... sigh... is for an end user to closely monitor the connection with a tool like yours and adjust their local openwrt router's "SQM" implementation dynamically to suit with:
ssh myrouter tc qdisc replace dev eth0 root cake bandwidth whateveritisnow...
or get your measurement tool to run directly on openwrt.
So to make starlink bufferbloat more visible to users I am curious if you would be interested in adding a far, far more robust test than speedtest to your suite? flent's rrul test is pretty good, and the tcp_nup and tcp_ndown pretty useful.
I've established a network of flent.org servers around the world just for starlink and a mailing list ([email protected]) to discuss this and other ongoing measurements (and one of the participants steered me to your github).
Hello, how do I edit the ping destinations?
What would be the easiest way to adjust the speed test frequency?
Last questions :)
Is is possible to amend the frequency and specify the server?

Stats that are circled do not populate.
Everthing seems to be working except the Grafana dashboard's it only happens to be showing the ping dashboard for me.

Is your feature request related to a problem? Please describe.
I like to have a monthly statistic on data usage as shown in the attached picture.

You see the data usage total in upright corner.
You have daily graphs which honor the heavy use times 7 am to 11 pm in light blue and the rest in grey.
The legend gives you hint on the daily usage.
Should be:
- job_name: 'speedtest' scrape_interval: 60m scrape_timeout: 70s static_configs: - targets: [ 'speedtest_exporter:9092' ]I am getting these 2 errors:
There's an error in your script :
TypeError: Can not read properties of undefined (reading 'fields') - line 3:28 (Check your console for more details)

And also:

It may be me getting my bits and bytes confused - apologies if it is.
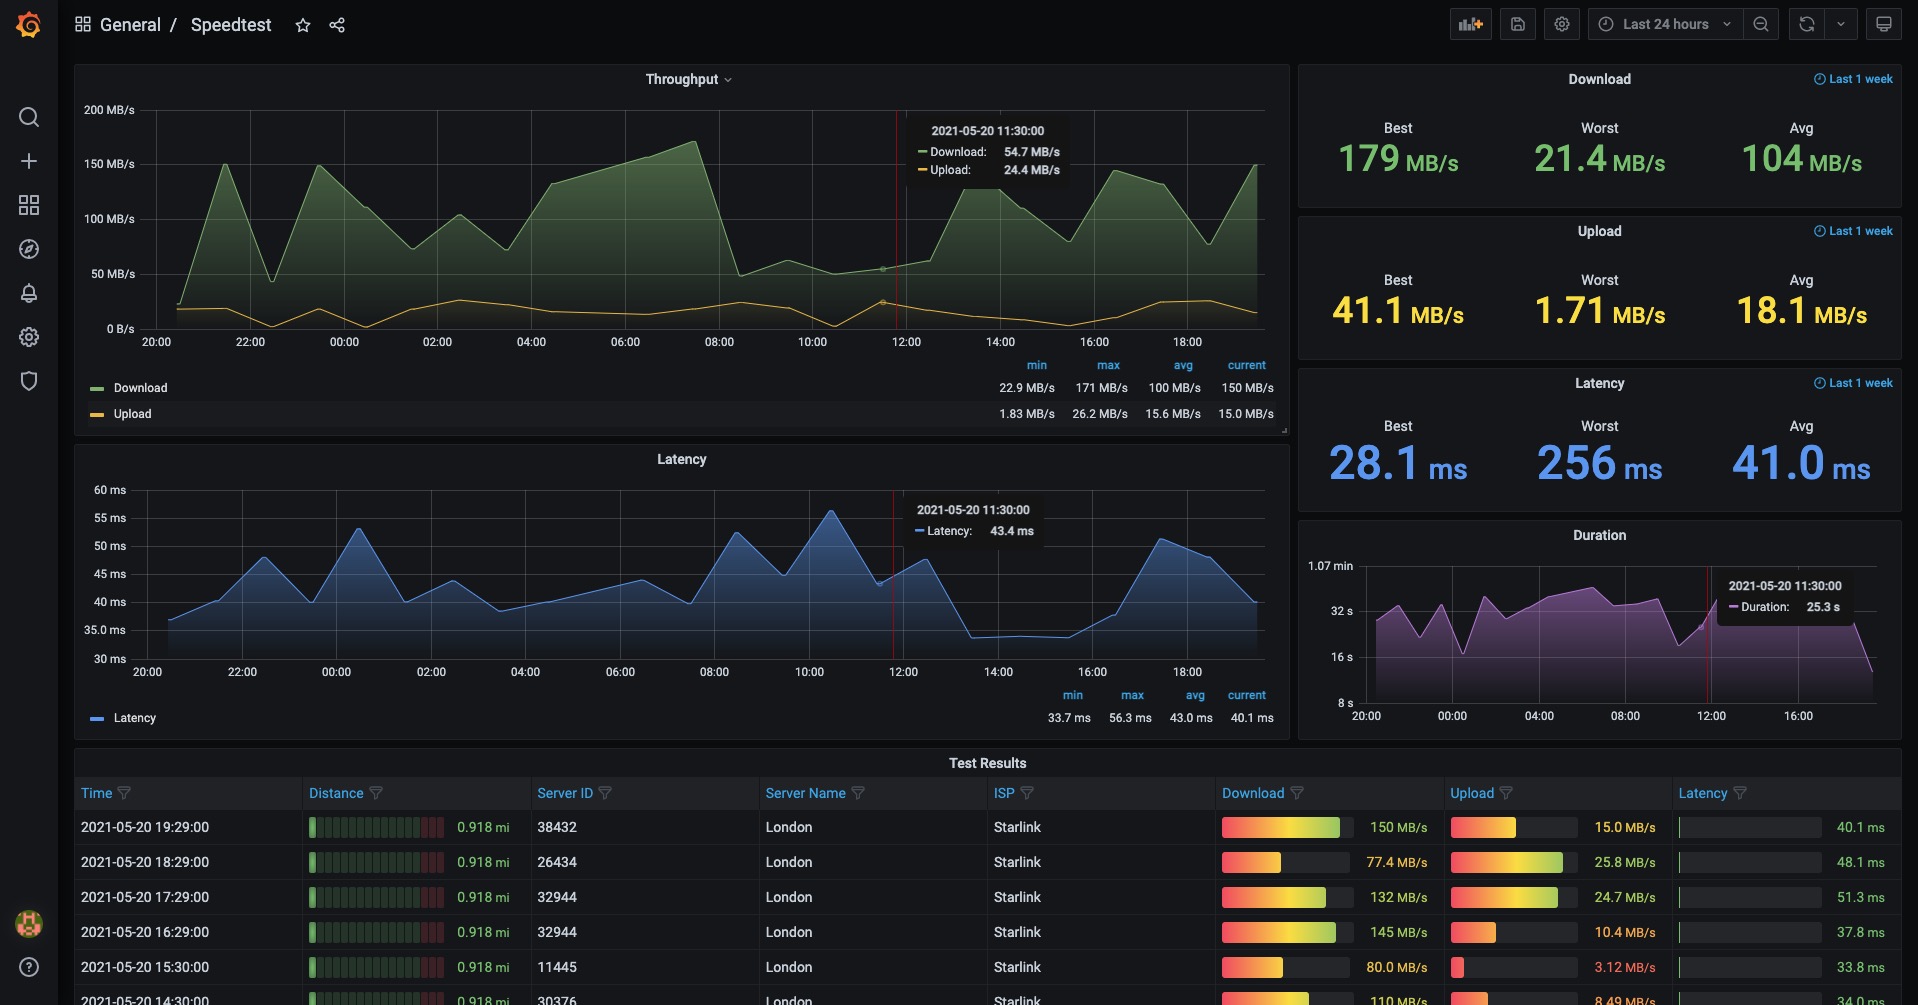
As an example Speedtest.net is reporting approx 179Mbps download speed which is roughly what the dashboard is showing, but the dashboard is labelled as MB/s? 179Mbps is 22.375 MB/s?
Hi just looking at the data and (it may well be me), but there appears to be a mismatch - 127mb/s shown as the best in the table on the top right and 167mb/s on the rows at the bottom?


Really like all the stats and the presentation :)
The only issue I am having is re. no speed tests showing.
When I run: 192.168.0.10:9090/targets shows the attached. The other file is a view of the dashboard. Manually running metrics seems to run okay? Let me know if you need any more info.
speedtest_download_speed_Bps{distance="1.280413",server_country="United Kingdom",server_id="14679",server_lat="51.5074",server_lon="-0.1278",server_name="London",test_uuid="aae26888-c50d-4364-8a68-666c31186e89",user_ip="176.116.125.2",user_isp="Starlink",user_lat="51.4964",user_lon="-0.1224"} 6.2774412372626126e+07
speedtest_latency_seconds{distance="1.280413",server_country="United Kingdom",server_id="14679",server_lat="51.5074",server_lon="-0.1278",server_name="London",test_uuid="aae26888-c50d-4364-8a68-666c31186e89",user_ip="176.116.125.2",user_isp="Starlink",user_lat="51.4964",user_lon="-0.1224"} 0.053275246
speedtest_scrape_duration_seconds{test_uuid="aae26888-c50d-4364-8a68-666c31186e89"} 44.773108303
speedtest_up{test_uuid="aae26888-c50d-4364-8a68-666c31186e89"} 1
speedtest_upload_speed_Bps{distance="1.280413",server_country="United Kingdom",server_id="14679",server_lat="51.5074",server_lon="-0.1278",server_name="London",test_uuid="aae26888-c50d-4364-8a68-666c31186e89",user_ip="176.116.125.2",user_isp="Starlink",user_lat="51.4964",user_lon="-0.1224"} 8.259880095672046e+06


Is your feature request related to a problem? Please describe.
No. It's an enhancement to speedtest dashboard/speedtest exporter.
Describe the solution you'd like
Optionally add in (at user discretion) the direct ookla speedtest test results url/id (as the uuid is not valid for the results url) for sharing to places such as https://starlinktrack.com/speedtests/ .
Relevant dev for above website:
@AliMickey
Describe alternatives you've considered
Alternatively for a more "realistic" use-case of the speedtest dashboard how about integrating this exporter instead as it's more relevant since it relies on Cloudflare Servers Only (real-world results for most websites/games/etc) for the test results rather than random servers that anyone can throw up via ookla's hosting guidelines.
https://github.com/martinbrose/cloudflare-speedtest-exporter
https://github.com/tevslin/cloudflarepycli
Relevant devs for above gits:
@martinbrose
@tevslin
Additional context
Cloudflarepycli often provides exact groundstation you're connecting to as well as 90th percentile averages.

It looks like Prometheus's data retention default is 15 days. Is there an easy way to change that(looking to store ~30 days)?
I am not an expert on containers or Prometheus.
Thank you.
Can we add ABS wedge fraction obstructions to the starlink dashboard?
I think it's just a case of copying the Current Wedge Fraction Obstructions and then changing it to look at wedge_abs_fraction_obstruction_ratio.
I've already done so on my install if the values seem to be sane I'll look at exporting the modified dashboard and submitting a PR.
Love the ability to monitor my starlink with this. Thank you for your hard work.
Any chance you could integrate Shelly Plug Smart Plugs to monitor power usage?. I've found an already made Shelly Plug Prometheus Exporter, (https://github.com/geerlingguy/shelly-plug-prometheus) just unsure how to integrate into your project.
I might be being dumb this morning so apologies, but I the graph from the speed test is not showing despite the data being there and the speed tests running. I've not edited or changed the installed speed test panel.

The other dashboards - ping & starlink are working fine. Completely removed and re-installed, still no joy. The metrics seem to be working ok, but still nothing on the graph despite the data being logged.
[email protected] does not work for me. Can you provide another email address

Thank you very much for creating and publishing a new and interesting Starlink monitoring tool.
I am trying to monitor Starlink observation data using the above mentioned monitoring tool, but I am having a problem that I cannot solve by myself.
As the screenshot attached to this email shows, I am getting an error message "An error occurred within the plugin".
I downloaded the plugin "ae3e-plotly-panel-master" and installed "plotly-panel" on Grafana.
I am very sorry, but if you could help me, I would appreciate it if you could tell me the appropriate plugin and how to use it.
Thank you in advance.
Hi, had to reset the password to make it work, can you please verify if it is set correctly.
If anyone needs to reset as well:
docker exec -ti <container ID> grafana-cli admin reset-admin-password admin
Is your feature request related to a problem? Please describe.
Unsure if it will be possible but can we still pull all these stats while the router is in bypass mode?
Describe the solution you'd like
Be able to use this app to pull stats while the router is in bypass mode.
Describe alternatives you've considered
Not running in bypass mode.
Additional context
I am going to be running a standard internet connection and starlink through a Firewall so the router will be in bypass mode.
Describe the bug
Dashboard showing unknown and 0 for status, uptime, cell id, gateway id, satellite id
To Reproduce
Steps to reproduce the behavior:
Expected behavior
status should be online, values should be non-zero
Screenshots

Additional context
Add any other context about the problem here.
Hi,
thank you for creating this repo. I don't have a starlink, but I do want to monitor my network on my server. That's why I took speedtest exporter and I'm using it in my grafana. However, the dashboard that I see on screenshot seems to be much nicer that what is provided after the import of JSON file
https://raw.githubusercontent.com/danopstech/starlink/main/.docs/assets/screenshot2.jpg
https://github.com/danopstech/starlink/blob/main/config/grafana/provisioning/dashboards/speedtest.json
I fixed myself the units problem, but I don't see this nice test result table. For me, it looks like this

Am I missing some grafana plugin or is the JSON just outdated?
Thanks!
docker-compose pull && docker-compose up
Shows an error in the CWFO panel

There's an error in your script :
TypeError: Cannot read properties of undefined (reading 'fields') - line 3:28 (Check your console for more details)
runRequest.catchError {"type":"cancelled","cancelled":true,"data":null,"status":-1,"statusText":"Request was aborted","config":{"method":"GET","url":"api/annotations","params":{"from":1684339656956,"to":1684341456956,"limit":100,"matchAny":false,"dashboardUID":"GG3mnflGz"},"requestId":"grafana-data-source-annotations-Annotations & Alerts-GG3mnflGz","retry":0,"headers":{"X-Grafana-Org-Id":1},"hideFromInspector":true}}
overrideMethod @ react_devtools_backend_compact.js:2367
Gauge rendering error Error: Invalid dimensions for plot, width = 0, height = 74
    at n.resize (jquery.flot.js:136:13)
    at new n (jquery.flot.js:114:10)
    at jquery.flot.js:1326:17
    at new s (jquery.flot.js:714:5)
    at e.plot (jquery.flot.js:3296:16)
    at v.draw (Gauge.tsx:140:9)
    at v.componentDidUpdate (Gauge.tsx:51:10)
    at ps (react-dom.production.min.js:219:502)
    at Au (react-dom.production.min.js:259:160)
    at t.unstable_runWithPriority (scheduler.production.min.js:18:343)
hello
I can't see the starlink data in graphana, the message is as follows:
There's an error in your script:
TypeError: Cannot read property 'fields' of undefined - line 3:28 (Check your console for more details)
on the console:
starlink_exporter_1 | time = "2021-07-14T16: 23: 50Z" level = error msg = "failed to collect context from dish: rpc error: code = Unimplemented desc = Unimplemented: " source = "exporter.go: 293"
can you help me please?
Thank you very much for this contribution!
Hi
Thanks for the lovely graphs, it would appear that with the release of dishy Mc Oblong the url of the stats and debug info has moved from the /support/debug to /debug
would it be possible to maybe add a small select dish type option?
Thanks and kind regards
Jon
I have set the speedtest interval down to 3m in the prometheus.yml - the graphing illustrates correctly with peaks in download panel reports the Best inaccurately - the attached image you can see that the peak in the graph is ~153MB/s and the Best in the Panel is ~134MB/s ?

Also noted that the interval in these panels are set to "last 1 week" ? When I changed the scrape interval - was there another setting I need to change somewhere ?
Great work on putting this together - saved me countless hours - let me know how I can help !
I only see zero on the Starlink dashboard for these values
Uptime
Cell ID
Gateway ID
Satellite ID
See attached.
I am not using the Starlink router, just my own.
Can I fix this? Or...

A declarative, efficient, and flexible JavaScript library for building user interfaces.
🖖 Vue.js is a progressive, incrementally-adoptable JavaScript framework for building UI on the web.
TypeScript is a superset of JavaScript that compiles to clean JavaScript output.
An Open Source Machine Learning Framework for Everyone
The Web framework for perfectionists with deadlines.
A PHP framework for web artisans
Bring data to life with SVG, Canvas and HTML. 📊📈🎉
JavaScript (JS) is a lightweight interpreted programming language with first-class functions.
Some thing interesting about web. New door for the world.
A server is a program made to process requests and deliver data to clients.
Machine learning is a way of modeling and interpreting data that allows a piece of software to respond intelligently.
Some thing interesting about visualization, use data art
Some thing interesting about game, make everyone happy.
We are working to build community through open source technology. NB: members must have two-factor auth.
Open source projects and samples from Microsoft.
Google ❤️ Open Source for everyone.
Alibaba Open Source for everyone
Data-Driven Documents codes.
China tencent open source team.