 Brought to you by Marco A. Lopez-Sanchez - Last update: 2022-11-22
A ternary plot is a triangular diagram that displays the proportion of three variables that sum to a constant, usually 1 or 100%. It is a common diagram in solid-earth but also in other physical sciences.
You want to use ternary diagrams in your Jupyter notebook (or Python script). Sadly you realise that matplolib does not have ternary plots by default. After some research on the internet, you realise that the alternatives are either to install other plotting libraries (e.g. Plotly) or third-party libraries that rely on matplolib (e.g. python-ternary or mpltern). Unfortunately, you don't feel like learning a new syntax for plotting (you are too comfortable with your matplolib buddy) or don't want to install a new Python library with all that this entails (dependencies, etc.) and that it seem overkill for your needs*. This is where the good news comes in. You can create a barebones ternary diagram with the minimum necessary elements in matplolib in few lines of code. In short, no installations, no new dependencies, your usual matplolib syntax, and no fuss.
*I have nothing against these libraries, quite the opposite, if you need more advanced features use them!
Simply copy and paste the functions into your Jupyter notebook cells and follow the usage examples.
# this is the minimum modules you must import to make it work
import matplotlib.pyplot as plt
from types import SimpleNamespace

# also used in the example although not strictly necessary
import numpy as np
Below we define three different Python functions that convert from ternary to Cartesian coordinates
def tri2cartX(upper_apex, right_apex, left_apex):
    """ Converts ternary to Cartesian x coordinates."""
    return 0.5 * (upper_apex + 2 * right_apex) / (upper_apex + right_apex + left_apex)

def tri2cartY(upper_apex, right_apex, left_apex):
    """ Converts ternary to Cartesian y coordinates."""
    return (3**0.5 / 2) * upper_apex / (upper_apex + right_apex + left_apex)

def tri2cart(upper_apex, right_apex, left_apex):
    """ Converts ternary to Cartesian coordinates.
    Normalises input values and returns Cartesian
    coordinates x, y as a float or array.

    Parameters
    ----------
    upper_apex : numeric or array-like
        coordinate related to the upper corner/apex
    right_apex : numeric or array-like
        coordinate related to the right corner/apex
    left_apex : numeric or array-like
        coordinate related to the left corner/apex

    Example
    -------
    x, y = tri2cart(20, 10.5, 3.2)
    """

    # normalize
    total = upper_apex + right_apex + left_apex
    upper_apex = upper_apex / total
    right_apex = right_apex / total
    left_apex = left_apex / total

    return tri2cartX(upper_apex, right_apex, left_apex), tri2cartY(upper_apex, right_apex, left_apex)
Finally, the function that create the ternary plot using matplolib
def ternary(upper_label=None, left_label=None, right_label=None, **fig_kw):
    """ No-fuss ternary plot using matplotlib, meaning: A simple
    ternary diagram using matplolib with the minimum necessary
    elements. It requires no other dependencies than matplolib.
    Returns the figure and axe objects with which you can use the
    typical matplotlib functions such as plot(), scatter(), etc.
    Coordinates must be converted from ternary to Cartesian for use.
    See tri2cart() function.

    Parameters
    ----------
    upper_label : str, optional
        the label of the upper corner/apex
    right_label : str, optional
        the label of the right corner/apex
    left_label : str, optional
        the label of the left corner/apex
    """
    # set grid (each 0.2)
    slines = (# //CB
              SimpleNamespace(x1=tri2cartX(4/5,0,1/5), y1=tri2cartY(4/5,0,1/5),
                              x2=tri2cartX(4/5,1/5,0), y2=tri2cartY(4/5,1/5,0)),
              SimpleNamespace(x1=tri2cartX(3/5,0,2/5), y1=tri2cartY(3/5,0,2/5),
                              x2=tri2cartX(3/5,2/5,0), y2=tri2cartY(3/5,2/5,0)),
              SimpleNamespace(x1=tri2cartX(2/5,0,3/5), y1=tri2cartY(2/5,0,3/5),
                              x2=tri2cartX(2/5,3/5,0), y2=tri2cartY(2/5,3/5,0)),
              SimpleNamespace(x1=tri2cartX(1/5,0,4/5), y1=tri2cartY(1/5,0,4/5),
                              x2=tri2cartX(1/5,4/5,0), y2=tri2cartY(1/5,4/5,0)),
              # //AB
              SimpleNamespace(x1=tri2cartX(0,1/5,4/5), y1=tri2cartY(0,1/5,4/5),
                              x2=tri2cartX(1/5,0,4/5), y2=tri2cartY(1/5,0,4/5)),
              SimpleNamespace(x1=tri2cartX(0,2/5,3/5), y1=tri2cartY(0,2/5,3/5),
                              x2=tri2cartX(2/5,0,3/5), y2=tri2cartY(2/5,0,3/5)),
              SimpleNamespace(x1=tri2cartX(0,3/5,2/5), y1=tri2cartY(0,3/5,2/5),
                              x2=tri2cartX(3/5,0,2/5), y2=tri2cartY(3/5,0,2/5)),
              SimpleNamespace(x1=tri2cartX(0,4/5,1/5), y1=tri2cartY(0,4/5,1/5),
                              x2=tri2cartX(4/5,0,1/5), y2=tri2cartY(4/5,0,1/5)),
              # //AC
              SimpleNamespace(x1=tri2cartX(0,4/5,1/5), y1=tri2cartY(0,4/5,1/5),
                              x2=tri2cartX(1/5,4/5,0), y2=tri2cartY(1/5,4/5,0)),
              SimpleNamespace(x1=tri2cartX(0,3/5,2/5), y1=tri2cartY(0,3/5,2/5),
                              x2=tri2cartX(2/5,3/5,0), y2=tri2cartY(2/5,3/5,0)),
              SimpleNamespace(x1=tri2cartX(0,2/5,3/5), y1=tri2cartY(0,2/5,3/5),
                              x2=tri2cartX(3/5,2/5,0), y2=tri2cartY(3/5,2/5,0)),
              SimpleNamespace(x1=tri2cartX(0,1/5,4/5), y1=tri2cartY(0,1/5,4/5),
                              x2=tri2cartX(4/5,1/5,0), y2=tri2cartY(4/5,1/5,0))
              )

    # make plot
    fig, ax = plt.subplots(constrained_layout=True, **fig_kw)

    # draw master (triangle) lines
    ax.plot([0, 1], [0, 0], '-', color='black', linewidth=2, zorder=11)
    ax.plot([0, 0.5], [0, 0.8660254], '-', color='black', linewidth=2, zorder=11)
    ax.plot([0.5, 1], [0.8660254, 0], '-', color='black', linewidth=2, zorder=11)

    # draw grid lines
    for line in slines:
        ax.plot([line.x1, line.x2], [line.y1, line.y2], '-', color='grey', linewidth=1, zorder=1)

    if upper_label is not None:
        ax.text(x=0.5, y=0.91, s=upper_label, fontsize=14, horizontalalignment='center', verticalalignment='top', zorder=11)
        ax.text(x=1.05, y=-0.01, s=right_label, fontsize=14, horizontalalignment='center', verticalalignment='top', zorder=11)
        ax.text(x=-0.05, y=-0.01, s=left_label, fontsize=14, horizontalalignment='center', verticalalignment='top', zorder=11)

    # Prettify
    ax.set_axis_off()  # remove the box, ticks, etc.
    ax.axis('equal')  # ensure equal aspect ratio

    return fig, ax
Alternatively, you can download the python file containing the functions here and save it to the same folder where your notebook is located. Then simply run the script using %run mpl_ternary.py or import it as a module. More details in https://github.com/marcoalopez/ternary_plots/blob/main/example_two.ipynb
# show figure primitives
fig, ax = ternary()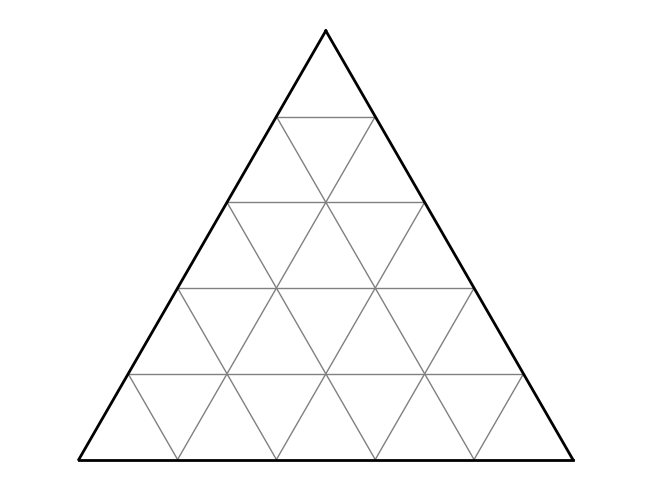
Plotting some points for reference
fig, ax = ternary(upper_label='upper label', left_label='left label', right_label='right label')

ax.plot(tri2cartX(1, 0, 0), tri2cartY(1, 0, 0), 'o', markersize=12, label='(1,0,0)')
ax.plot(tri2cartX(0, 1, 0), tri2cartY(0, 1, 0), 'o', markersize=12, label='(0,1,0)')
ax.plot(tri2cartX(0, 0, 1), tri2cartY(0, 0, 1), 'o', markersize=12, label='(0,0,1)')
ax.plot(tri2cartX(1/3, 1/3, 1/3), tri2cartY(1/3, 1/3, 1/3), 'o', markersize=12, label='the centre')

ax.legend(fontsize=14)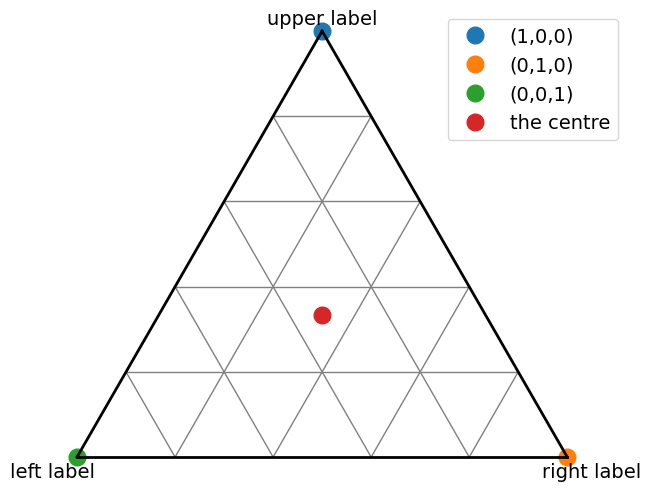
To use ternary diagrams it is always the same two-step process:
- Normalise and convert your ternary coordinates to Cartesian ones. For this you will use the
tri2cart()function. - Then initialize your ternary diagram using the
ternary()function and use your ususal matplolib commands (plot(),scatter(), etc.)
Important: Usage examples will be available soon
The notebooks are licensed under a Creative Commons Attribution-NonCommercial-ShareAlike 4.0 International License and codes under Mozilla Public License 2.0.

Copyright © 2022 Marco A. Lopez-Sanchez
Information presented on this website and the notebooks is provided without any express or implied warranty and may include technical inaccuracies or typing errors; the author reserve the right to modify or enhance the content of this website as well as the notebooks at any time without previous notice. This webpage and the notebooks are not liable for the content of external links.
Hosted on GitHub Pages
