djay / covidthailand Goto Github PK
View Code? Open in Web Editor NEWThailand Covid testing and case data gathered and combined from various sources for others to download or view
Thailand Covid testing and case data gathered and combined from various sources for others to download or view


perhaps to the end of the year?
Should be able to get the rate for the last 2 weeks and plot a dotted line going forward. Maybe even a line to show where it hits 70% and 80%?
enhanced version might modify the 2nd dose estimate by factoring in time since first dose and vaccines used?
Problem: Data sources change sometimes and currently exceptions are handled by the main python process. Such that any exception will cause runs to exit with a fatal error. (Fail early)
The feature request is:
Proposed solution:
df or per dataset source/url):
try-excepts into __main__, around each function call (i.e. entrance into call graph chain).main continue to handle exceptions.Expected Outcomes:
Vaccinations report is not up to date krub


None of the scrapers rely on each other adn can be done in any order. So should be easy to put in a worker queue and use multiple processes to process them faster on actions.
The current infections estimate uses the ages of the population to infer the chance of a given person dying of covid. However if this was accurate then the predicted median age of death would be ~80 instead of 65-70.
Ideas
from dashboard

The most interesting data are on the right side of the chart. To have labels only on the left side makes it somehow hard to read.

the following is no longer in the report
All we have now is total + % for each shot of top 10 provinces vaccinated.
The cases data from https://covid19.th-stat.com/api/open/cases which is used to build provinces data is currently down and causes error while scraping.
covidthailand/covidthailand.py
Line 1279 in b61ac75
EDIT
Since the official API for cases, deaths, hospitalization data (https://covid19.th-stat.com/en/api) is unreliable: it's not regularly maintained and can't access from outside of Thailand (yep what the hell) which prevents server-side request; can you please add total death, cases and hospitalization numbers in the Daily Situation Reports?
Currently the daily reports doesn't include 3rd dose data but can be found with this link (as far as i know). Would be great to include this in the vac_timeline as well.
north, south, east, west, central (and maybe split out Bangkok + suburbs from central?)
Not that interesting but should be there.
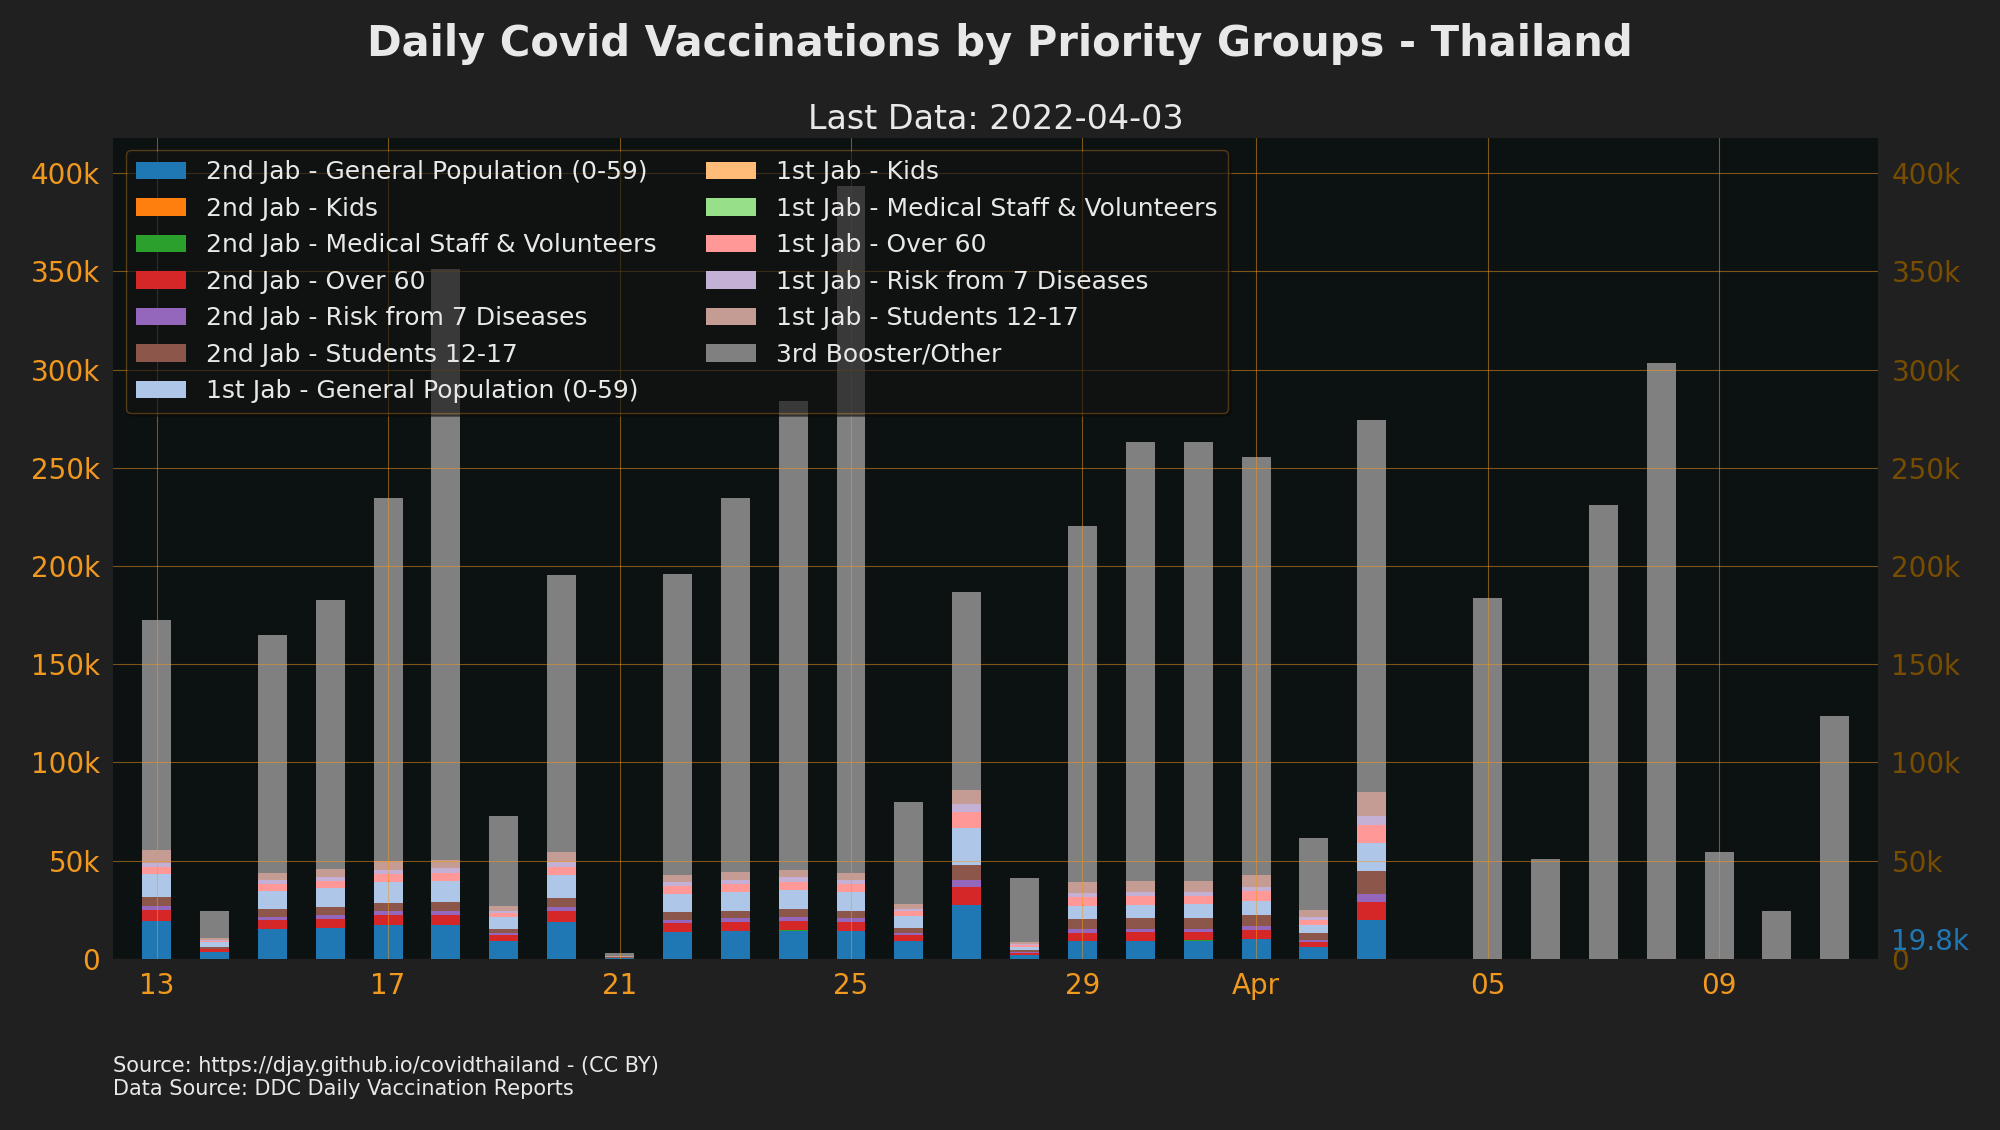
https://github.com/djay/covidthailand/wiki/vac_groups_daily_30d.png
The reason is we have data for 1st, 2nd, 3rd dose earlier than the breakdowns per group.
Dashboard and briefings give us the dose totals. Vac reports give us the groups.
So need to show this data properly. Proberly with a 1st dose, 2nd dose category which is only show on days where the other data is missing. Similar to the unknown feature of teh plot_area function but in this case we have 3 types of data we can show when groups aren't available.
Replace the 1 week runway ffom imports with allocated. Also line on total doses graphs
e.g. https://github.com/djay/covidthailand/wiki/vac_top5_doses_2_30d.png
Can reuse the existing code used for groups - https://github.com/djay/covidthailand/blob/main/covid_plot.py#L966
dashboard data has extra breakdown on field hospitals
                D_Hospitel="Hospitalized Field Hospitel",
                D_HICI="Hospitalized Field HICI",
                D_HFieldOth="Hospitalized Field Other",
Needs to be broken up but into how many files?
The code roughly breaks down like this
Not sure yet if there is one utils file or many?
Desktop viewers viewing on https://djay.github.io/covidthailand/ can zoom in or click to expand image sizes.
Desktop viewers viewing on https://github.com/djay/covidthailand/ cannot zoom in, as github css maintains image (/column) width.
This can make reading legends and title headings more difficult.
matplotlib rc.params default settings are around this line:
Line 170 in 25fe9c5
Add / update rc.params for these items, until making those plots easily read at a quick glance (rc-params-list):
Then:
There are some deceptive sites like https://www.worldlifeexpectancy.com/ trying to covid yearly instead of weekly or by month.
Should be able to get all teh data out of http://ghdx.healthdata.org/gbd-results-tool but it's only yearly.
Could add additional graph to excess deaths to show estimated causes of deaths based on previous years vs covid vs excess.
I'm now collecting cumulative CFR for 3 age ranges (since 1st april) from situation reports.

However these cumulative CFR values can sometimes decrease (see "W3 CFR 15-39" on 29th). CFR can go down if cases increases but the cumulative cases I am using don't seem to match rise at the right times.
So turning this into daily deaths by age is turning out to be a bit tricky as so far I end up with negative deaths on certain days (
Line 488 in 1f4f4fb
Need to work out how to correct for these to get reasonable numbers that align with min, max and median of reported deaths.
The test data from dashboard is a bit suspect but see what it shows.
used to appear in each vaccination report
พบผู้ที่มีอำกำรไม่พึงประสงค์ภำยหลังได้รับวัคซีนรุนแรงที่ได้รับกำรยืนยันจำกคณะผู้เชี่ยวชำญ* รวม 18 รำย โดย 15 รำย มีอำกำร แพ้รุนแรง (Anaphylaxis) และมีอำกำรชำ (polyneurophaty) 3 รำย หลังรักษำอำกำรเป็นปกติดี และไม่พบผู้เสียชีวิตที่มีสำเหตุมำจำกวัคซีน ช่วงเวลำ | จำนวนผู้มีอำกำรไม่พึงประสงค์รุนแรง  ที่ได้รับกำรยืนยันจำกคณะผู้เชี่ยวชำญ*
-- | --
สะสมตั้งแต่วันที่ 28 กุมภำพันธ์ 2564 | 18
แพ้รุนแรง (Anaphylaxis) | 15
ชำ (polyneurophaty) | 3
From these MOPH daily slides on the 2nd page- https://ddc.moph.go.th/uploads/ckeditor2//files/Slide%202021-07-30.pdf
Example data
{
    "date":"2021-07-04",
    "Sinovac_daily": 20170,
    "AstraZeneca_daily": 61284,
    "Sinopharm_daily": 17151,
    "AstraZeneca_total": 4061982,
    "Sinopharm_total": 95076,
    "Sinovac_total": 6513839
  },
The Researcher has already collect this type of data but it's incomplete with some dates missing some data.
https://github.com/porames/the-researcher-covid-bot/blob/master/components/gis/data/vaccine-manufacturer-timeseries.json
probably best way is to change the code in
covidthailand/utils_scraping.py
Line 350 in 5151cab
web_files has a similar check=True mode mode that will use cached content instead if available.
  tests_reports = get_test_reports()
  File "/home/runner/work/covidthailand/covidthailand/covid_data.py", line 2286, in get_test_reports
    for file, dl in test_dav_files(ext=".pptx"):
  File "/home/runner/work/covidthailand/covidthailand/utils_scraping.py", line 362, in dav_files
    client.list(get_info=True),
  File "/opt/hostedtoolcache/Python/3.9.7/x64/lib/python3.9/site-packages/webdav3/client.py", line 67, in _wrapper
    res = fn(self, *args, **kw)
  File "/opt/hostedtoolcache/Python/3.9.7/x64/lib/python3.9/site-packages/webdav3/client.py", line 264, in list
    response = self.execute_request(action='list', path=directory_urn.quote())
  File "/opt/hostedtoolcache/Python/3.9.7/x64/lib/python3.9/site-packages/webdav3/client.py", line 230, in execute_request
    raise ResponseErrorCode(url=self.get_url(path), code=response.status_code, message=response.content)
To make it easy for people to get access to the source data if they want.
Listed by date.
Data from COVID-19 Vaccines Track and Traceability Platform is no longer reliable (I hope just for temporary). Meanwhile, DDC report now includes numbers for provincial vaccination. Perhaps you could modify the old code to scrape data from it.
perviously this was on the cumulative vaccine plot and also the vac_daily (was a runway amount, ie how many per day to run out in 1 week).
A test framework has been put in place in https://github.com/djay/covidthailand/blob/main/tests/test_scraping.py#L85
Todo
[ ] - identify the parsers which break most often e.g. briefings
[ ] - rework the get_links code to into seperate function and actual download as enclosure to enable test to only the files it needs
[ ] - identify from comments or commits which dates required changes. generate a json file for each
As seen here in graphs five through eight: Top/Lowest Provinces for Vaccination 2nd/1st Dose.
Not sure what they have done or if there is a way unencode it
Hopefully it goes away today when it next updates.
But since the API version and xlsx are 3 weeks out of date and the csv has now been overwritten in the cache, it does show a weak point in the system they I'm not sure how to get around.
Goal would be to have a better name and sharable url and a single site to go to
Hi Dylan, I noticed that the "Vac Given " is gone from the vac_timeline.csv file. Was it moved to another file or is this a bug? If this is a bug, I could try and help fix it.
Nat
Order of columns remains the same. We can just find the row where there is a number and add column names afterward.
def parse_raw(url):
  response = requests.get(url)
  file = open("tmp/daily_report.pdf", "wb")
  file.write(response.content)
  file.close()
  tables = camelot.read_pdf('tmp/daily_report.pdf', pages='2,3',split_text=True)
  raw_table = pd.DataFrame()
  for i in range(2):
    df=tables[i].df
    df=df[df[1].str.isdigit()]
    df.drop([2], axis=1, inplace=True)
    raw_table = raw_table.append(df,ignore_index=True)
  table_dict=raw_table.transpose().to_dict()
  rows=[]
  for row_num in table_dict:
    cleaned_row=[]
    for (key,value) in table_dict[row_num].items():
      for col in value.replace(" ", "").split('\n'):
        if(col): cleaned_row.append(col)
    rows.append(cleaned_row)
  cleaned_table = pd.DataFrame(rows)
  return cleaned_table
df=parse_raw("https://ddc.moph.go.th/vaccine-covid19/getFiles/9/1628485849393.pdf")
test = df.iloc[:,0:12]
test.columns=["Health Area", "Population", "Vac Allocated AstraZeneca", "Vac Allocated Sinovac", "Vac Allocated Pfizer", "Vac Allocated Total", "Vac Given 1 Cum", "Vac Given 1 %", "Vac Given 2 Cum", "Vac Given 2%", "Vac Given 3 Cum", "Vac Given 3 %"]
display(test)
Seems to happen when it needs to get more than one date is one session
for example 2021-09-01 is actually 85 not 35 but 156 is correct.
https://github.com/djay/covidthailand/runs/3492265169?check_suite_focus=true
2021-09-02 00:00:00 MOPH Dashboard Retry Missing data at (datetime.datetime(2021, 9, 2, 0, 0), 'Buriram') for ['Vac Given 1 Cum', 'Vac Given 2 Cum', 'Vac Given 3 Cum']. Retry
2021-09-02 MOPH Dashboard 156.0 0.0 0.0 0.0 156.0 0.0 NaN NaN NaN NaN Buriram
...
2021-09-01 00:00:00 MOPH Dashboard Retry Missing data at (datetime.datetime(2021, 9, 1, 0, 0), 'Buriram') for ['Vac Given 1 Cum', 'Vac Given 2 Cum', 'Vac Given 3 Cum']. Retry
2021-09-01 MOPH Dashboard 34.0 0.0 0.0 0.0 34.0 1.0 NaN NaN NaN NaN Buriram
The existing code tries to reset the connection if there is a failure. somehow it must be going wrong.
https://github.com/djay/covidthailand/blob/main/utils_scraping.py#L694
This data is currently collected from the dashboard scraping but not displayed anywhere.
Could help show the effect of vaccinations as it should show severe for elderly trending down and severe for younger trending up in a % plot
@djay The viz-updates branch was originally intended for visualisation updates but these have been covered through other branches already. The viz-updates also contained miscellaneous updates that have nothing to do it how data is being presented (for example code cleanup, which I plan to implement at a later stage).
I suggest deleting the viz-updates branch as I am not planning on merging it or further working on it.
The idea would be to have similar ability to view details for every day of every line similar to OWID. Could also show actual and average values this way.

Consider the time to reimplement all the customisations in plot function vs How nice the interactivity or plotting is
MPLD3
Redo plot_area with plotly
Age etc only comes from api which is often days delayed but plot says its up to date today. Need to check each plot and make sure calculation is is correct for all.

Could be one of several problems
According to the raw data published by MOPH, Vaccine allocation data are separated by the manufacturers (Sinovac and Astrazeneca). However, the scraped data shows Vac Allocated AstraZeneca 1 | 2 and Vac Allocated Sinovac 1 | 2. What is the difference between the two?
Also vaccine allocation data of every province is missing after 9th May 2021 .
Thanks.
A declarative, efficient, and flexible JavaScript library for building user interfaces.
🖖 Vue.js is a progressive, incrementally-adoptable JavaScript framework for building UI on the web.
TypeScript is a superset of JavaScript that compiles to clean JavaScript output.
An Open Source Machine Learning Framework for Everyone
The Web framework for perfectionists with deadlines.
A PHP framework for web artisans
Bring data to life with SVG, Canvas and HTML. 📊📈🎉
JavaScript (JS) is a lightweight interpreted programming language with first-class functions.
Some thing interesting about web. New door for the world.
A server is a program made to process requests and deliver data to clients.
Machine learning is a way of modeling and interpreting data that allows a piece of software to respond intelligently.
Some thing interesting about visualization, use data art
Some thing interesting about game, make everyone happy.
We are working to build community through open source technology. NB: members must have two-factor auth.
Open source projects and samples from Microsoft.
Google ❤️ Open Source for everyone.
Alibaba Open Source for everyone
Data-Driven Documents codes.
China tencent open source team.